

Everyone associated with Business Intelligence (BI) applications is talking about their Artificial Intelligence (AI) journey and the integration of AI in analytics. Artificial intelligence encompasses a broad spectrum of categories, including machine learning, natural language processing, computer vision, and automated insights. ThoughtSpot has been a leader in augmented analytics, leveraging AI to automate insights and empower users to make data-driven decisions.
Nonetheless, even with these advanced capabilities, certain crucial aspects of augmented analytics are often overlooked, which can hinder organizations from fully realizing the potential of their data. The primary challenge lies in automatically identifying the columns or features that will yield the most valuable insights and support in-depth analysis.
Why is identifying impactful columns important?
There are established machine learning techniques such as LightGBM, CatBoost, Neural Networks, or Mutual Information, which can identify the impactful features for a given measure. The challenge, however, lies in accessing the relevant data. This is problematic due to the following reasons:
High Cost: Fetching data for each cloud data warehouse (CDW) query with specific filters is computationally expensive.
Scalability Issues: Fetching all the data from a worksheet could lead to memory issues or challenges when joining tables (chasm traps), making it infeasible.
Security Concerns: Even if customers are willing to bear the cost, storing this data for retraining purposes raises security concerns.
Challenges
Enhanced insights can be delivered if the most impactful columns for a specific query are known. Through a series of techniques, the challenge of selecting the right features for analysis can be simplified to the problem of choosing the correct columns from a table. This eliminates the need to address the aforementioned challenges. The key question is how to identify relevant columns without accessing the actual dataset.
Thoughtspot eliminates the challenges stated above by solving the column selection problem without fetching the actual data. This is achieved with the help of the following ThoughtSpot features:
Sage/Autocomplete: The AI-driven search engine that facilitates searching through your data in simple natural language
SpotIQ: A Thoughtspot feature that uses Generative AI and helps you find relevant and better insights at pace.
Atlas: The in-house metadata store that enables us to deliver most of ThoughtSpot at scale and low latency.
ThoughtSpot’s AI-Powered Analytics
Let's illustrate the importance of column selection in automated insight generation with a few examples.
Change Analysis is a feature in ThoughtSpot that helps users understand why a measure changed over time. For example, if sales dropped by $100 million between August 2023 and December 2023, Change Analysis can provide data points to explain this change based on attributes like product, item type, region, city, and more.
The challenge with Change Analysis and column selection in general is how to identify the relevant analysis attribute columns, such as product, item type, region, or city, when dealing with hundreds or thousands of columns related to a measure (like Sales). ThoughtSpot is the only platform that can solve this problem with its robust tools and information processing technology, all without saving any customer data.
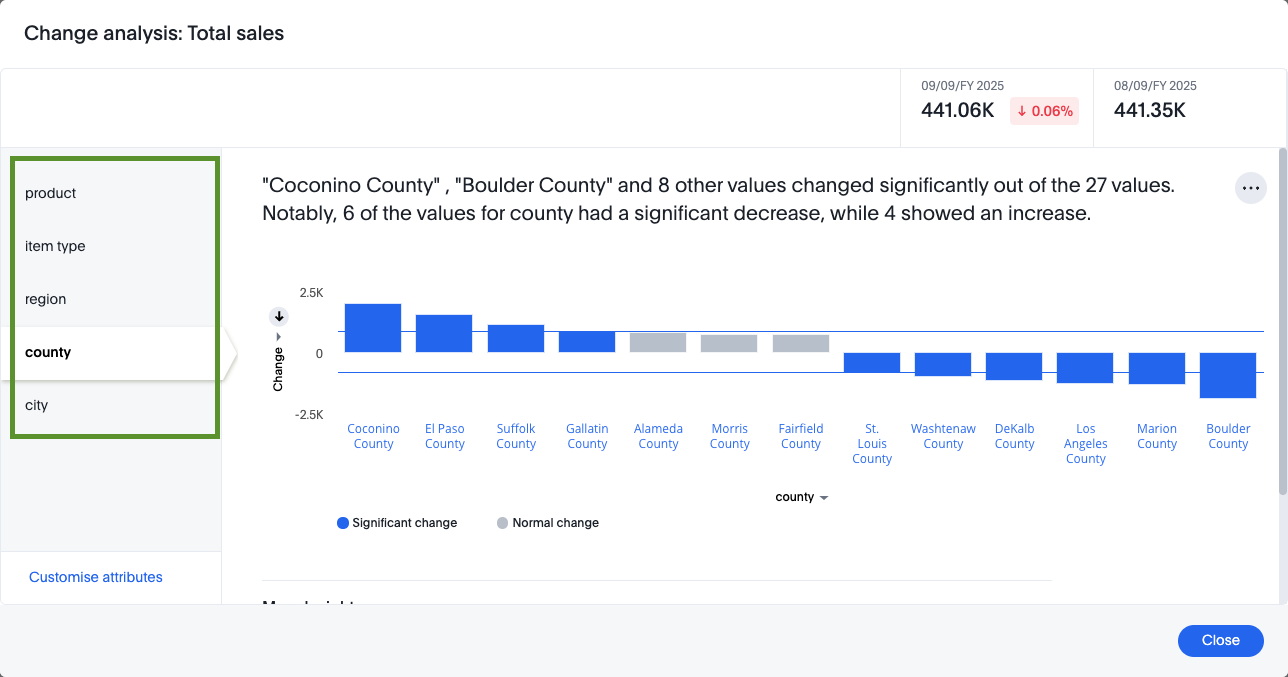
Figure 1 - Change analysis output
Consider the example shown in Figure 1, SpotIQ Column selection figured out that Product, Item type, Region, Country, and city are relevant features to analyze the sales metric.
In the following example, the SpotIQ column selection figured out that “Total quantity” is a relevant column to do cross-correlation analysis with sales(measure at test).
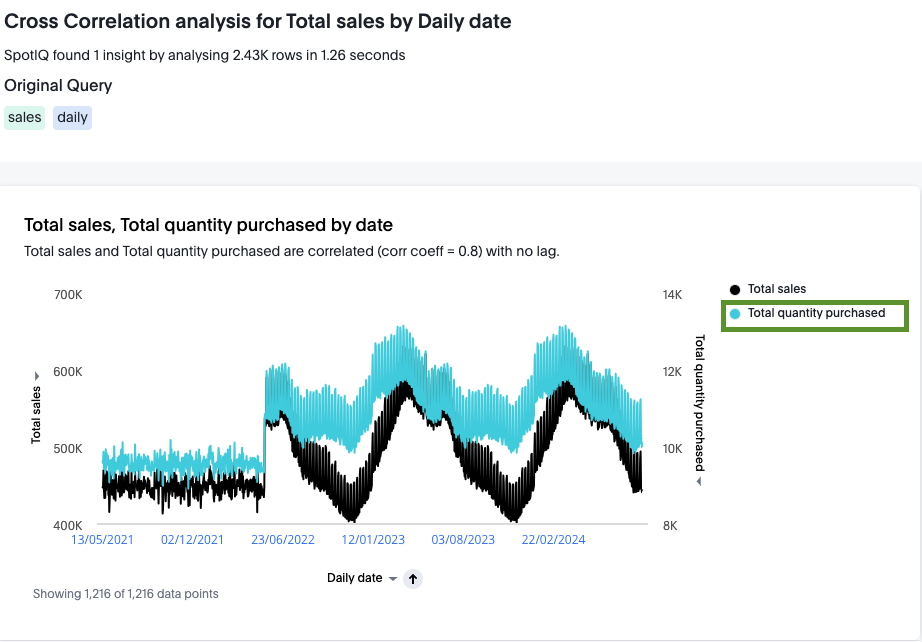
Figure 2 - SpotIQ analysis output
The ThoughtSpot Analytics engine “SpotIQ” tackles this problem elegantly as shown in Figure 1 and Figure 2. ThoughtSpot builds the context around any analysis that a user intends to execute. The power of ThoughtSpot Sage, Natural Language Search, indexing, and execution context is what distinguishes ThoughtSpot from other BI tools. All these features and technologies help gain information on what could be the most relevant columns impacting the measure that a user might want to analyze. ThoughtSpot processes all these relevant signals with our algorithms to extract the most relevant columns that can be used for the analysis.
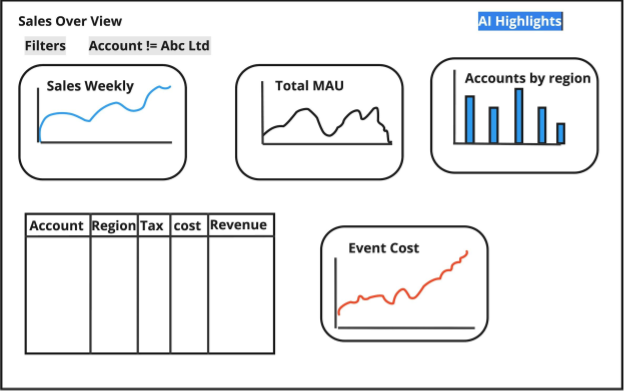
Figure 3 - A simplified example of a ThoughtSpot Liveboard
Let's take a closer look at how SpotIQ suggests relevant columns for analysis. Consider a Liveboard(Figure 3), Liveboards are collections of your related charts, tables, and headlines that assist users in understanding their data and making impactful business decisions.
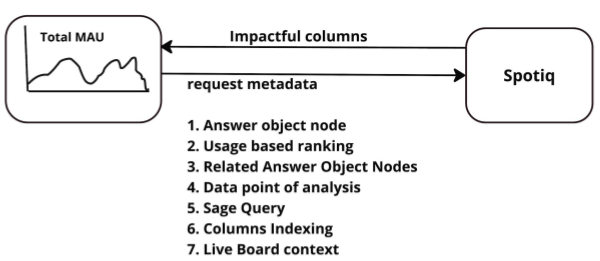
Figure 4 - A simplified view of the impactful column API context
When analyzing a Key Performance Indicator (KPI) on a Liveboard chart, for example, the Total MAU chart shown in Figure 3, to analyze why the Total MAU is declining, we can run a Change analysis by selecting two points on the chart. A request goes to SpotIQ along with the valuable context information.
A chart on a ThoughtSpot Liveboard is abstracted as an Answer object, which is saved in our GraphDB called Atlas, along with all relevant metadata. This metadata is passed along with the insight request to the SpotIQ service, which utilizes our algorithms to further refine the metadata and use the execution context to generate a filtered set of impactful columns.
Data filtering algorithms
Let’s look at the algorithm at work. There are multiple types of filtering we apply to determine the right set of columns. Among these, the following types of filtering are important:
Heuristic-based filtering
Context-based filtering
Heuristic-based filtering
In the heuristic approach, we initially refine the base request query by eliminating irrelevant tokens, phrases, and sort clauses that are not applicable to the current execution context.
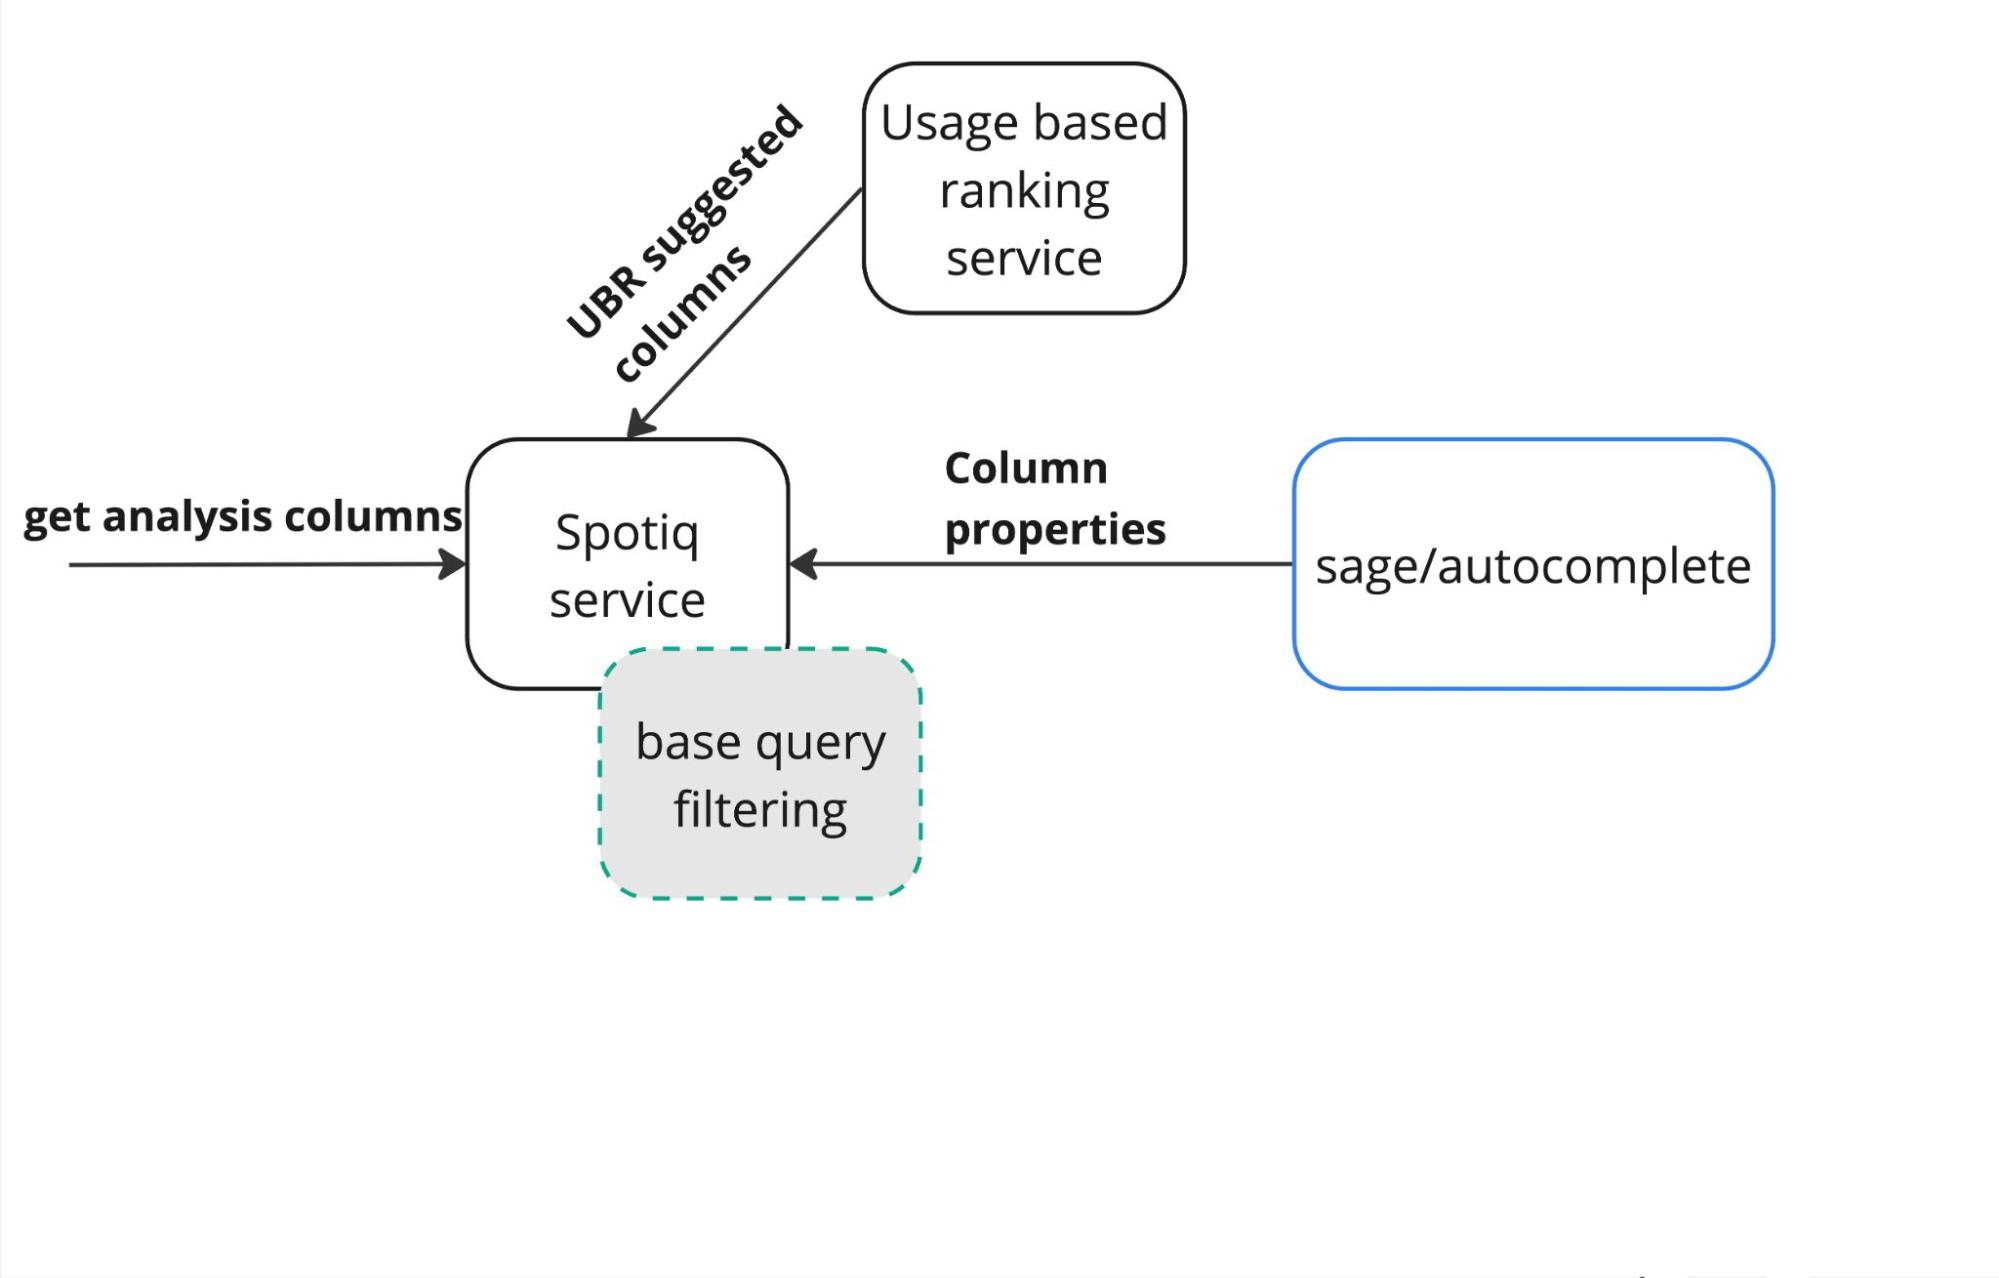
Figure 5 - SpotQ heuristic filtering
Subsequently, we extract column properties from ThoughtSpot Sage/Autocomplete services and re-rank the usage-based ranking (UBR) columns.
Context-based filtering
The initial columns filtered from heuristic filtering are fed into the context filtering algorithm as shown in Figure 6. This block takes input from ThoughtSpot Sage/Autocomplete to get data from similar columns that apply to the current execution or request context. The context filtering gets all the related information from its GraphDB, Atlas. Atlas provides a graph of all related Answers, their columns, and the relationship between them. Finally, all this information is combined to generate a score for each suggested column, after sorting the columns by score, the top n columns are returned as a response. All of this happens in real-time with a latency of a few 100 ms.
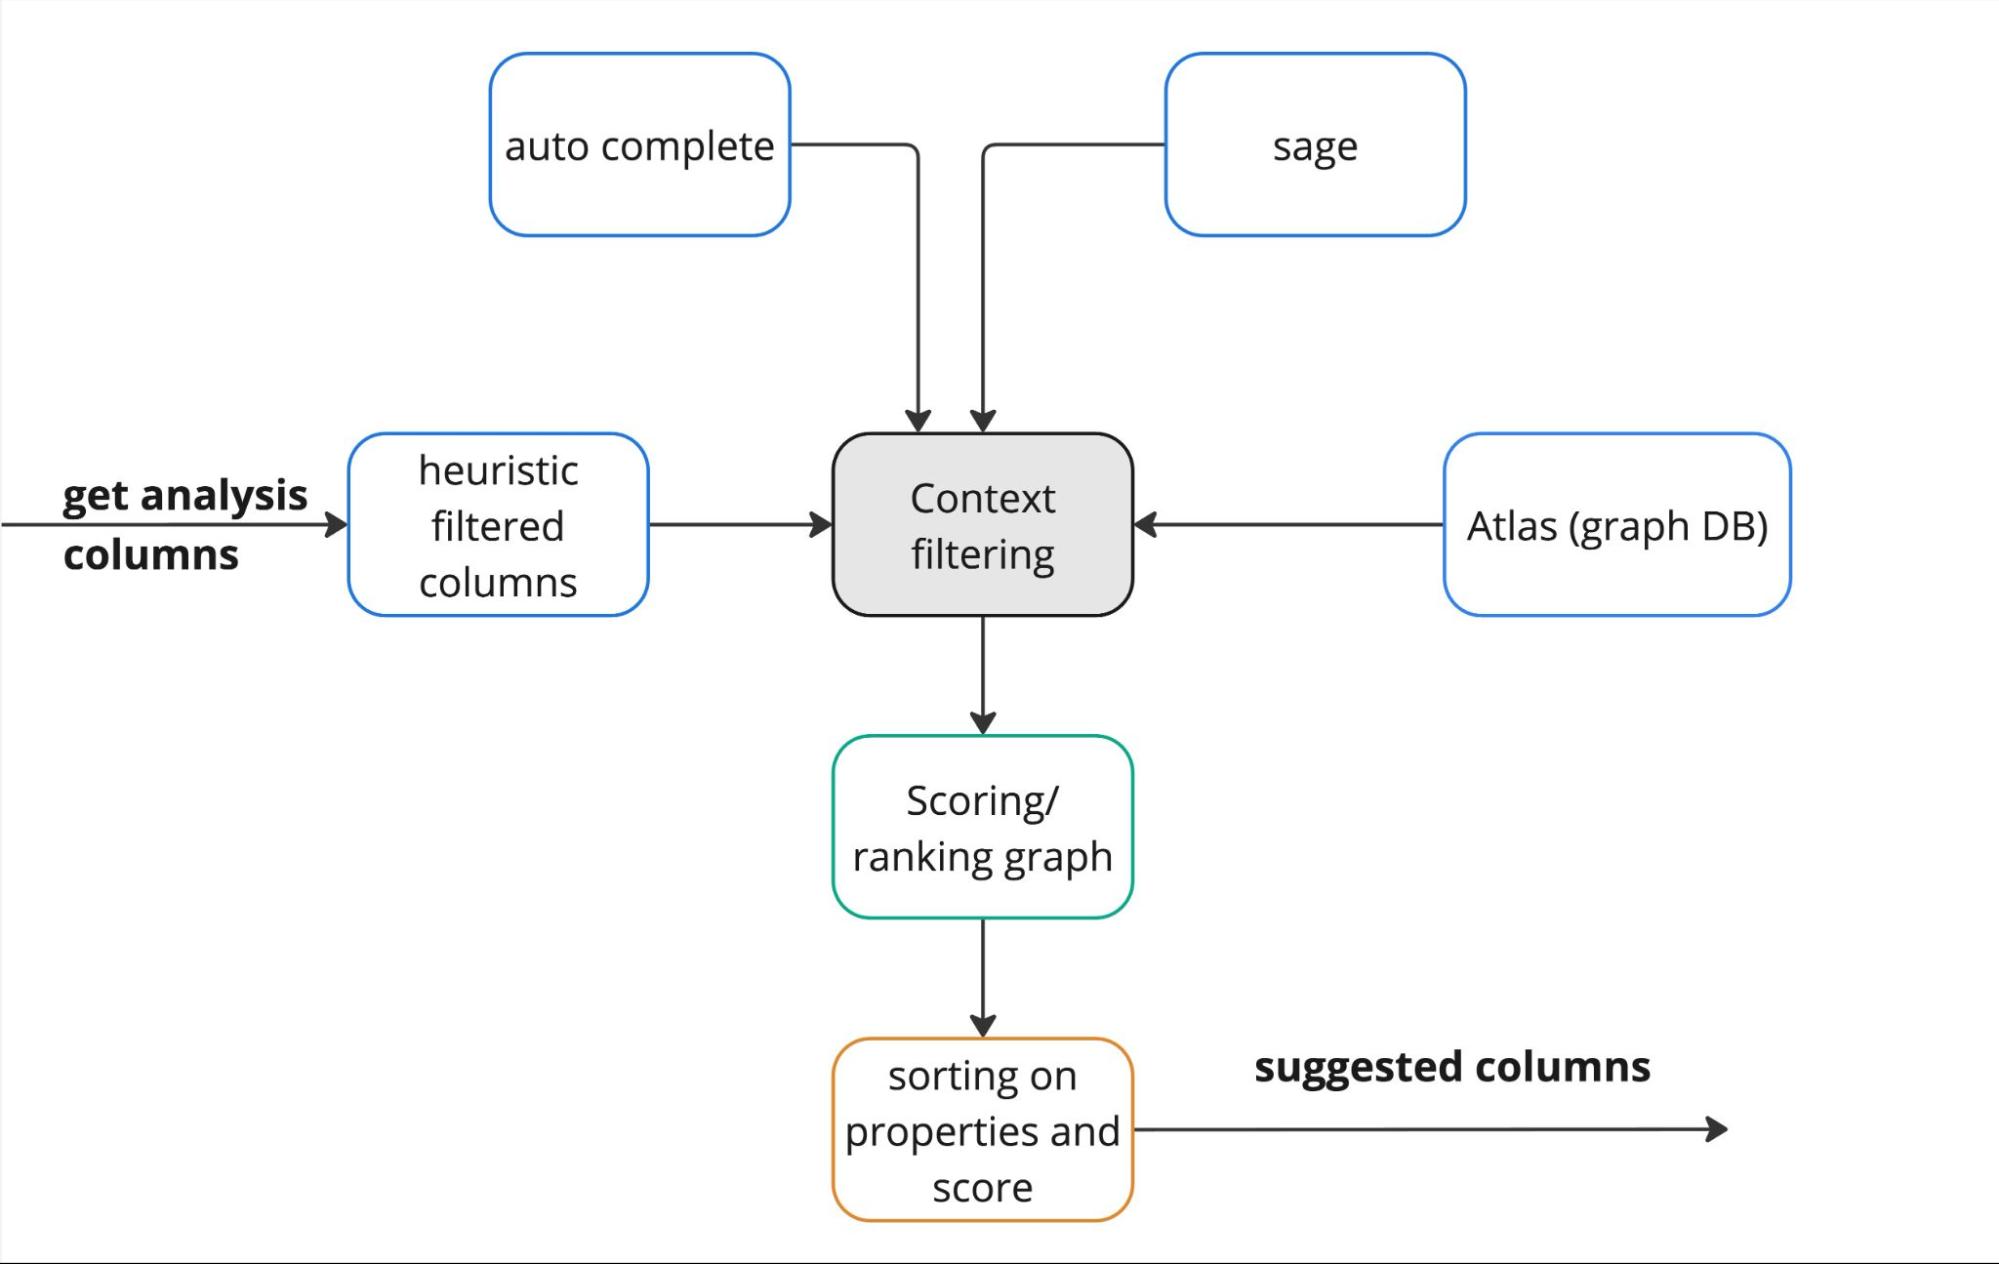
Figure 6 - Context-based column filtering
Conclusion
Identifying key columns or attributes within data is essential for generating relevant insights that drive impactful business decisions. However, this can be challenging without utilizing the actual data.
ThoughtSpot addresses this challenge using AI-driven technology, combined with its robust natural language search capabilities and the Insight engine, SpotIQ. This innovative approach allows users to efficiently pinpoint crucial data elements, leading to more informed and effective business decisions.


