After being recognized by Gartner as the leading generative analytics experience for augmented analytics, ThoughtSpot’s SpotIQ just got an upgrade.
As an integral part of ThoughtSpot’s core platform for nearly seven years, SpotIQ has unlocked the value of billions of rows of data for hundreds of customers. Even more inspiring are the customer testimonials highlighting how SpotIQ empowers business users to perform complex analytics and analyze key metrics—even on the go.
It’s a direct validation of our vision for delivering meaningful, transparent, and personalized insights to our users in the age of generative AI. SpotIQ neatly integrates into the ThoughtSpot workflow, instead of forcing you to switch into yet another separate app experience. That means your users' AI-powered search experience is augmented with relevant, curated insights they otherwise may have missed.
Today, we’re excited to highlight a number of recent additions to SpotIQ and a view of what’s to come. Keep reading for the full recap, or click the links below to jump to the new feature descriptions:
Stay on top of unusual changes with automatic, anomaly-based alerts
We know you’ve got a lot on your plate. Let ThoughtSpot handle the task of monitoring your ever-changing business metrics.
With anomaly-based alerts, you receive notifications whenever SpotIQ detects an unusual change in key performance indicators (KPIs), allowing you to take timely action to address potential problems and seize new opportunities. This feature complements existing alerting capabilities, such as the ability to set scheduled alerts and customizable threshold-based alerts. You can also receive alerts on the go via push notifications with the ThoughtSpot mobile app.
Traditional statistical methods often fall short when identifying unusual patterns within seasonal and erratic data. In contrast, SpotIQ leverages machine learning models to analyze past data and provide more accurate trend predictions. With SpotIQ, you can feel confident in receiving automatic alerts on the updates that truly matter, so you can stay informed and focused.
Get to the bottom of changes with iterative change analysis
You received an alert that piqued your interest. Now, you only have a few minutes to understand the ‘why’ behind the change.
SpotIQ goes beyond the surface observations. It simplifies the process of uncovering the root causes of changes into just a few clicks, and without switching between different screens.
Previously you could run change analysis and pinpoint significant attributes contributing to changes in key metrics between two points in time. Now with iterative change analysis, you can drill into each specific attribute and gain highly specific insights into why changes are happening.
For example, let’s say you are a digital marketing analyst and want to find out what drove your total conversions. You find that your latest campaign on hockey sticks contributed to almost 40% of the increase! After using iterative change analysis, you find that the increase is largely driven by social media channels, which particularly did well with the East region. Looks like you found a key insight for a great business opportunity!
By breaking down the various factors contributing to shifts, SpotIQ gives you precise insights into what drives your business metrics and enables you to target the right areas for improvement and growth. Additionally, you can choose between Google Gemini and GPT-4 to power change analyses.
Leverage past trends, growth and seasonality to project future trends.
Your data exploration doesn’t stop at understanding the past.
We’re excited to introduce forecasting to SpotIQ. With a single click, you now have the power to answer the question “What will happen next?” for a KPI.
SpotIQ’s forecasting feature uses machine learning models to predict future trends based on past data. By thoroughly analyzing patterns in historical increases, rates of increases, and seasonality on metrics, forecasting provides valuable insights into how your KPIs might behave. With predictive analytics in hand, you can take proactive actions and stay ahead of the curve.
See your Liveboard hits all in one view
Now, what if you don’t know where to start looking? Maybe you got introduced to a new set of metrics on a Liveboard. Perhaps you’re returning to a Liveboard and wondering what changed since your last visit. What do these numbers mean, and what’s the key takeaway? That’s where ThoughtSpot’s AI-Powered Analytics can help.
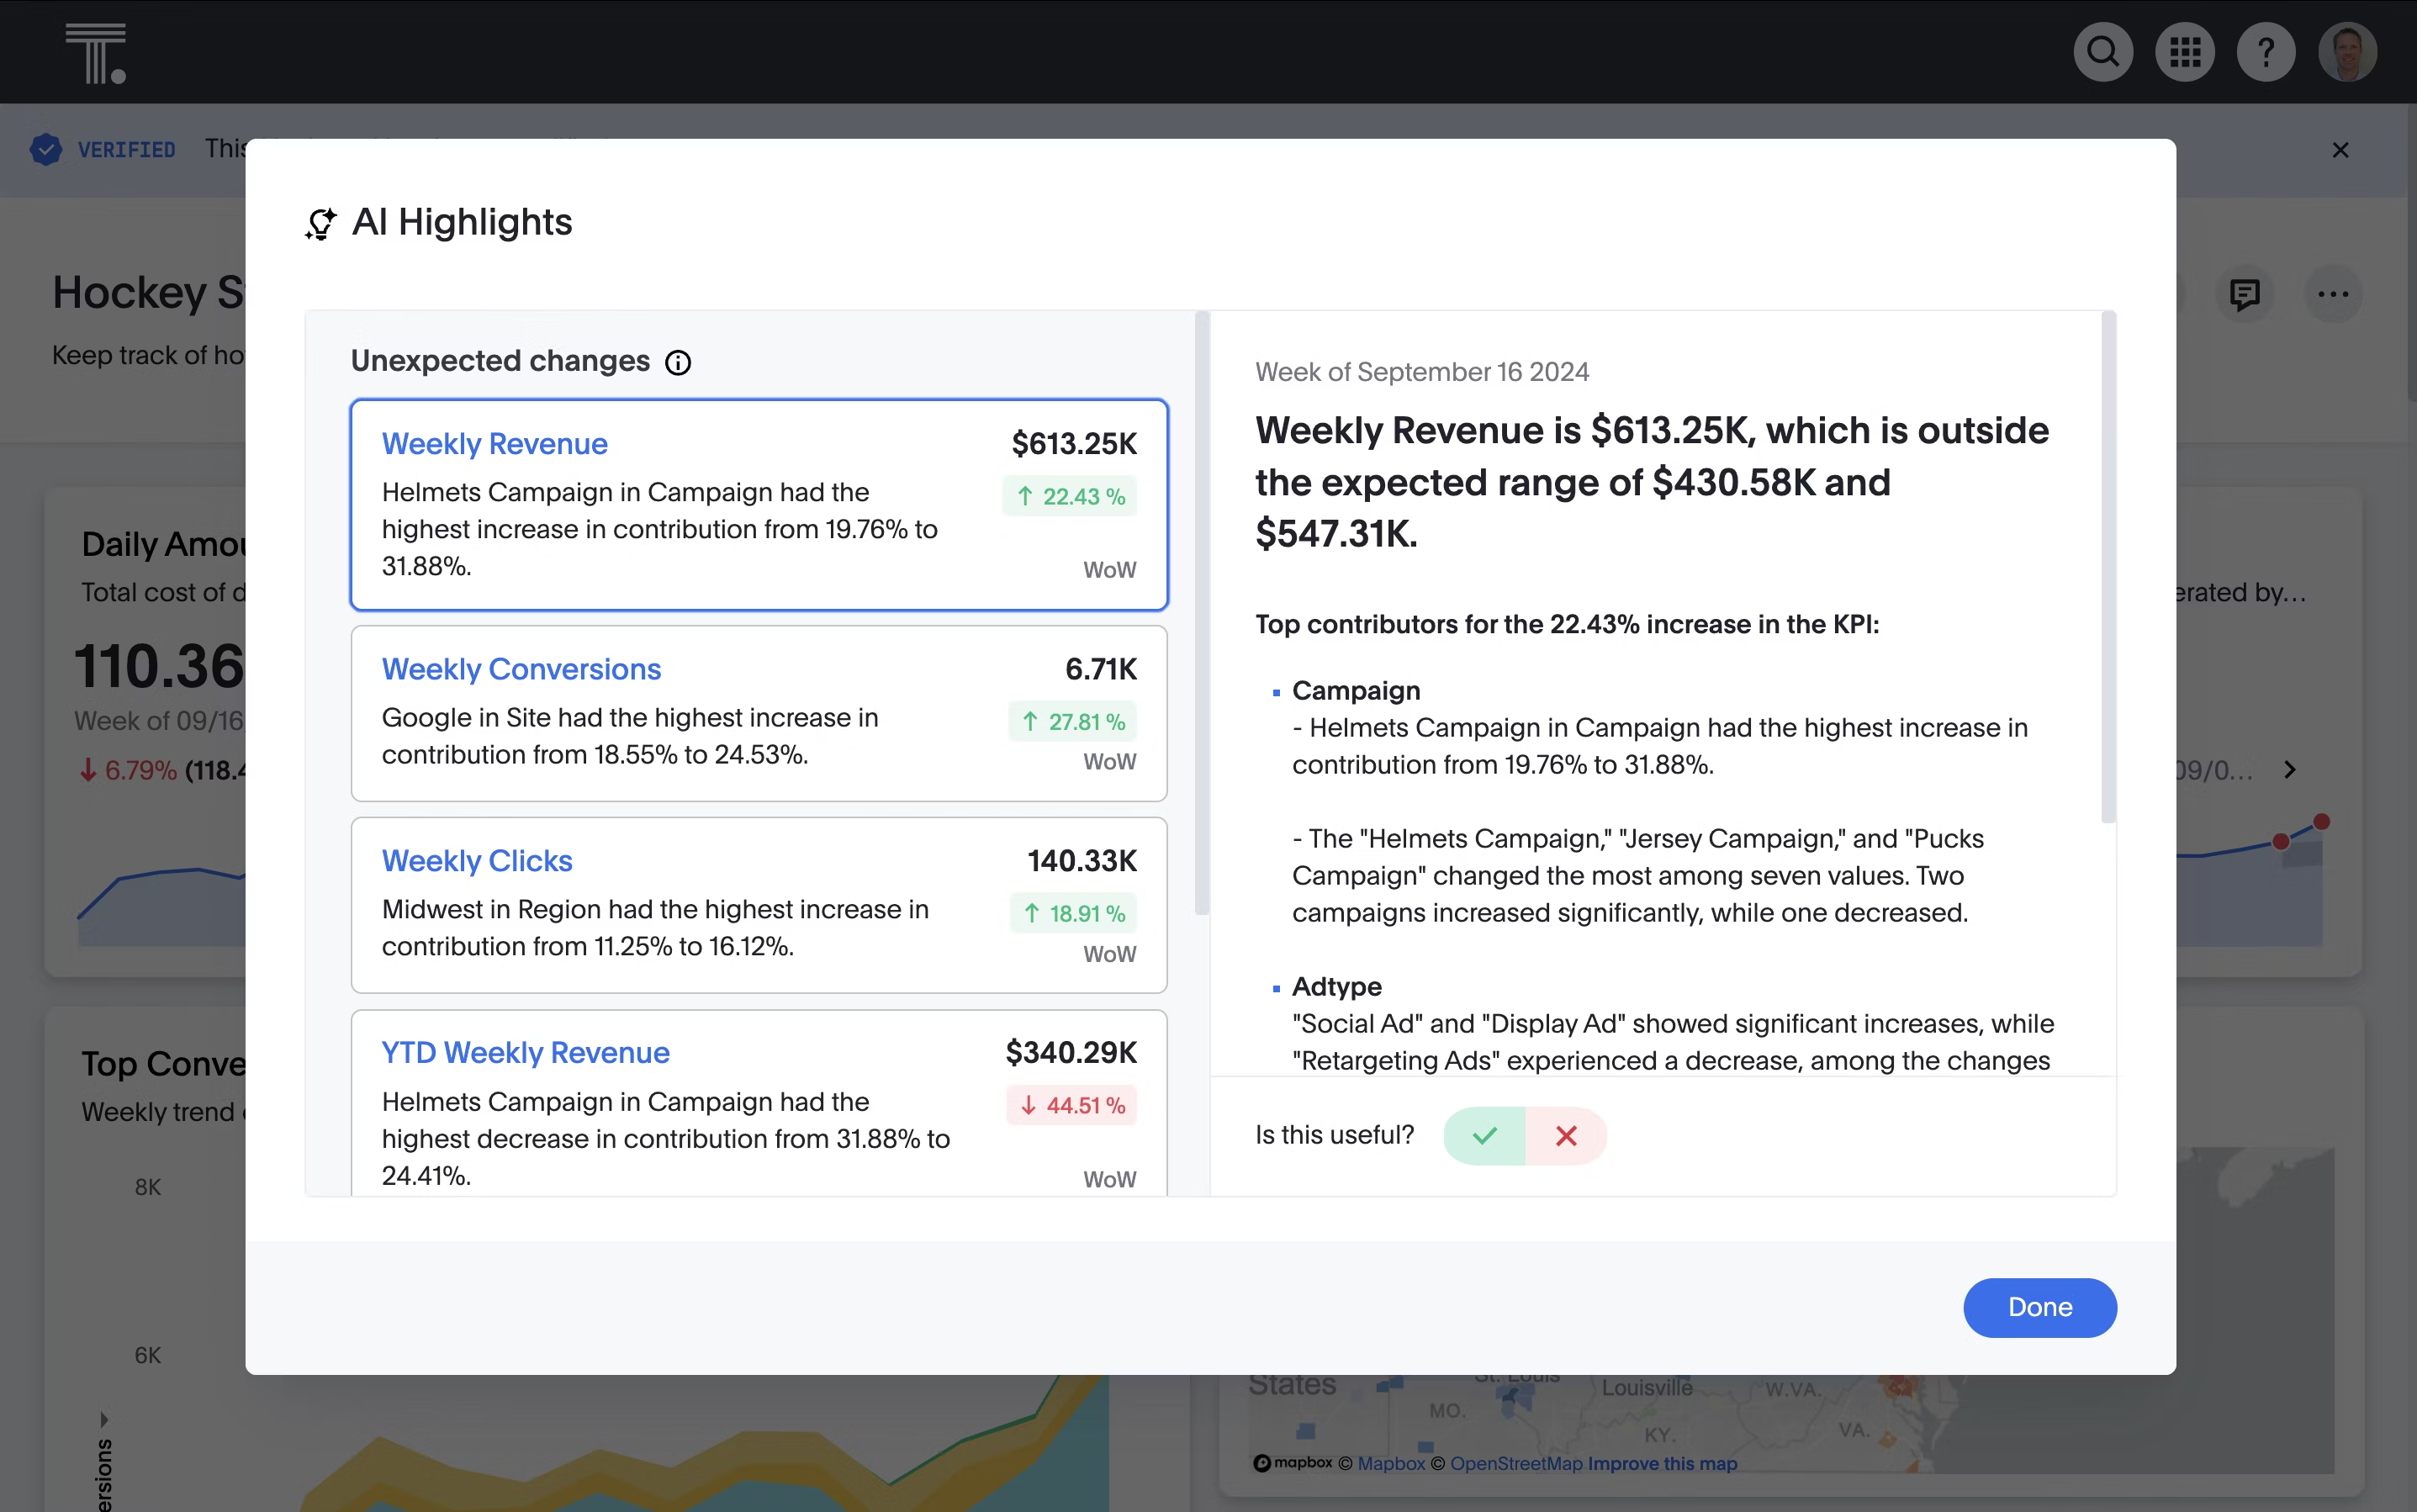
With one click, you can access AI Highlights to view a natural language summary of significant trends, anomalies, and changes with your most important KPIs.

While it can’t make decisions for you, AI Highlights can help you quickly look at all angles, offer a starting narrative, and point out key elements you don’t want to miss—creating a path to decision intelligence.
Today, AI Highlights is powered by GPT-4. In the near future, customers will also be able to use Google Gemini. By developing an open ecosystem, Thoughtspot is supporting innovation and delivering more value to users seeking to leverage the latest AI innovations in their data stack.
What’s next with ThoughtSpot augmented analytics
These updates represent significant introductions and enhancements in SpotIQ descriptive, diagnostic, and predictive analytics capabilities. And there are more exciting announcements on the horizon, including:
More coverage for advanced queries and analyses, supporting an enterprise-grade change analysis experience
Ability to monitor KPIs with even greater precision by specifying attributes
Cohesive experience for running your choice of analyses on individual KPIs
ThoughtSpot’s continued innovation in GenAI and augmented analytics underlines our commitment to closing the gap between data and outcomes.
We invite you to co-innovate with us by joining the ThoughtSpot Community. Already a member? Start engaging with our Product Ideas forum today.
And if you’ve never tried ThoughtSpot, take a product tour to see the value of trusted, secure, AI-Powered Analytics for yourself.


