


Over the last two decades, I have used several bug and project management tools, such as ClearQuest, BugZilla, and Atlassian's Jira. Jira is a popular tool for managing and tracking projects. It is widely regarded as a flexible and efficient system that offers interesting features such as JQL (Jira Query Language) and personalization options.
Jira also provides basic dashboard support with in-built chart types, making it easier for users to visualize their project data and get basic insights into the ongoing tasks, team progress, and issue resolution at any point in time. Any Jira user, from scrum masters, project managers, and developers alike, can view the snapshot of their project in a single place.
Current limitations of Jira
While Jira comes with report generation and other user-friendly features, it doesn't provide enhanced data visualization capabilities like a true business intelligence (BI) tool will offer. This is where the challenges start with Jira. Although Jira reporting tools can create a wide range of high-level or detailed reports, users often find it challenging to leverage the full potential of Jira data due to the following limitations:
Limited variety of chart types
Limited capability of range in created vs resolved charts
Limited options for historical data analysis and visualization
No ability to incorporate data from other related systems in analysis
No ability to share insights with a broader audience both due to user licensing as well as flexibility in distribution (mobile app, PPT plug in etc)
To us, the key drawback of Jira’s default reporting tools is their inability to track changes over time effectively. For example, if you want to analyze how many issues were “status-open” (not created issues) in the system on a particular date and want to see the trend, it is not possible in Jira.
As Operations leaders, we require access to not just the current data but also insightful trend analyses. Trendlines add a critical dimension to data interpretation, clearly comparing planned objectives against actual performance over time. Regularly monitoring these trends is essential for data-driven decision-making and effective strategic planning.
To leverage insights from the Jira data, sometimes organizations will depend on another external BI tool.
ThoughtSpot as a savior
ThoughtSpot’s AI-powered analytics platform addresses these limitations, by enabling users to build not only a wide range of system-generated charts but also custom charts. These charts can be created to show the trends across time. With ThoughtSpot, teams can visualize historical data effortlessly and identify patterns that Jira's default reporting tools cannot provide.
Why ThoughtSpot?
Before we delve into the examples to show how ThoughtSpot bridges the gap, let’s understand why visualizations are required in the first place.
Natural to humans: Visualization works from a human perspective because we respond to and process visual data better than any other type of data. As per some studies, the human brain processes images 60,000 times faster than text, and 90 percent of the information transmitted to the brain is visual.
Faster identification of opportunities and risks: Presenting data in an interactive and visual format makes potential opportunities and risks more visible. Early detection of challenges or emerging trends allows organizations to pivot, adjust their strategies promptly, and maintain a competitive advantage.
Enhanced insights and decision-making: Visualizing data helps identify patterns, trends, and correlations that might not be apparent in raw data. This clarity enables leaders to make informed, evidence-based decisions and formulate strategies.
Bringing data into ThoughtSpot
One of the challenges is to connect Jira data to another app outside Atlassian. In most cases, it requires a connector designed for custom integration. With ThoughtSpot, you can upload Jira data effortlessly through CSV uploads, direct database connections, or by integrating with various data sources using drivers.
At ThoughtSpot, we streamlined this process by extracting Jira data via API calls and loading it into our Snowflake Staging Environment. We at ThoughtSpot snapshot Jira data on a daily basis. With a robust transformation layer built using SQL and DBT, we refine the raw data into structured and organized data. Once integrated into ThoughtSpot, this data is not just ready for visualization—it becomes a powerful tool for decision-making.
What makes this even more impactful is the ability to enrich Jira data by combining it with other critical business sources such as Salesforce, Workday, and more. This holistic view empowers teams to assess their performance with clarity, optimize workflows, and drive efficiency at both individual and team levels. In the following example, the chart combines the Jira data with Employee data (i.e. in this case - type of employee) and shows the resolved Jira tickets (Bug + Tasks) per contractor per month.
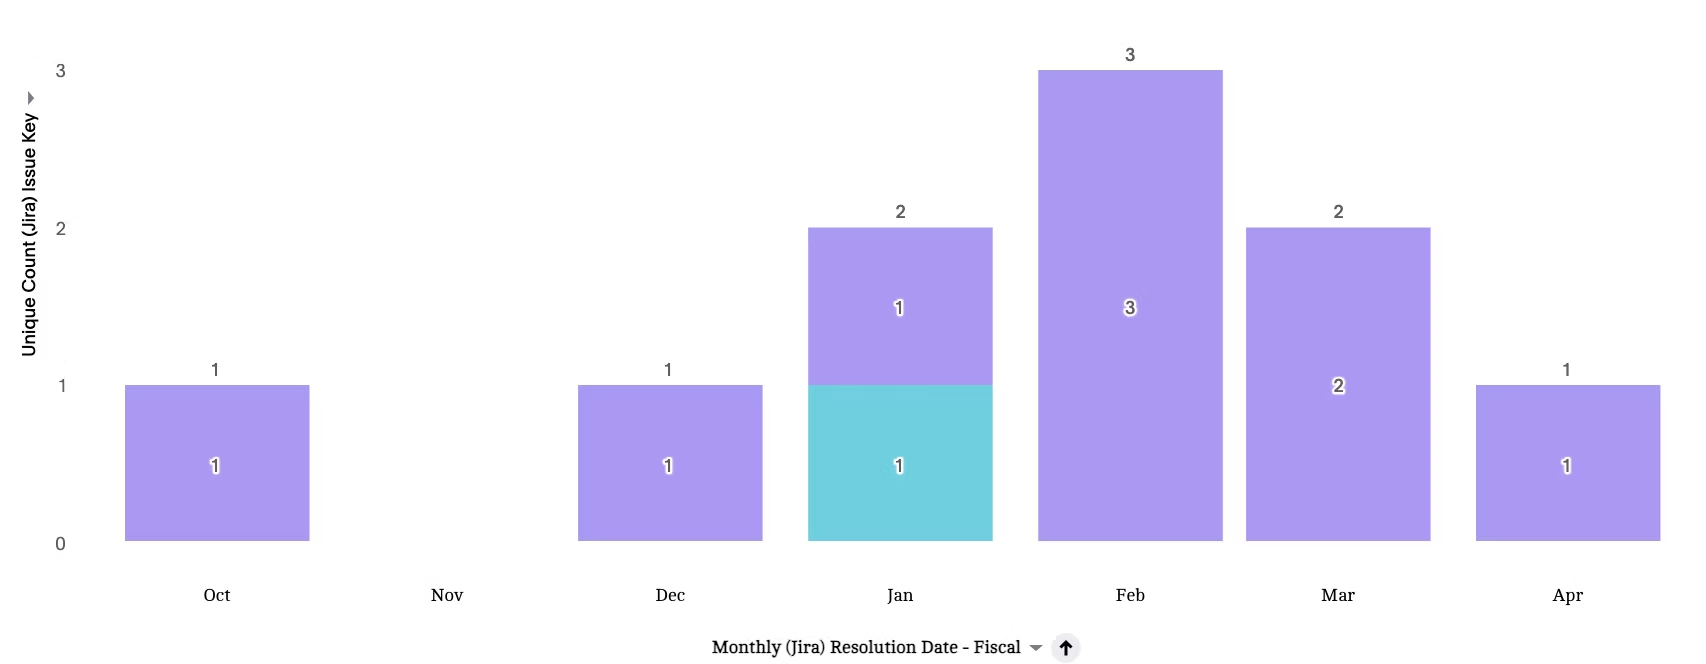
By leveraging ThoughtSpot's AI-powered search and live analytics, we can transform the defect data into a strategic asset—enabling smarter, faster, and more informed decision-making.
Examples
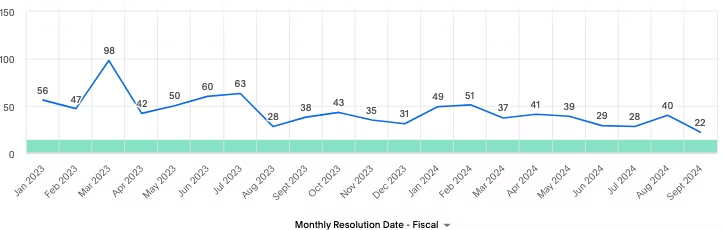
Let’s check some examples now. In ThoughtSpot, users can create detailed trend reports to check how the issue resolution time has changed over the months and use this data to guide future planning and resource allocation to projects. With features such as Change analysis and AI highlights users can compare any two data points in a visualization for change and identify key change drivers.
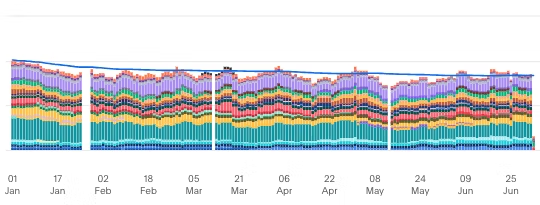
Here is another example that illustrates how the open issues trendline moves every week. Additionally, they can be color-coded according to priority such as P0, P1 etc.. Depending on your requirement, you can tune the visualization to show data for a specific periodicity such as daily, monthly, or yearly.
AI analytics
ThoughtSpot’s AI-powered platform extends the data analytics capabilities further with its advanced natural language processing (NLP) and AI/LLM features. With ThoughtSpot, users can ask complex questions in plain natural language format, eliminating the need for technical expertise in writing complex queries. This makes it easier for anyone, regardless of their technical background, to interact with the data, find insights, and make data-driven decisions quickly. The AI-driven interface not only understands and interprets natural language questions but also suggests relevant queries and visualizations, ensuring users can explore the data intuitively. This breakthrough empowers teams to leverage data more effectively and foster a deeper understanding of their business operations.
Holistic reports with visualizations
Along with custom visualizations for time-series analysis, ThoughtSpot supports data integration with other critical tools used by your organization, such as GitHub and Workday, Salesforce, and more.
This capability opens the door to a more comprehensive and holistic view of the effectiveness and efficiency of the R&D organization. By combining Jira data with GitHub’s code deployment metrics, you can not only track the number of reported bugs but also analyze how fast these bugs are being fixed, and identify the parts of the code that are prone to issues. Additionally, by bringing in data from Workday, you can correlate employee engagement or team composition with productivity metrics and bug resolution speed.
Thus, the AI-powered integrated data analysis enables leaders to gain a comprehensive view and big picture of the entire process, from the impact of human resources on project outcomes to the alignment of the development process with organizational goals. ThoughtSpot transforms Jira’s static reports into dynamic and multi-dimensional insights that foster better decision-making.
Conclusion
While the Jira reporting tools add value, they can be limiting for businesses that rely on custom reports and visualizations for trend and forecast analysis. ThoughtSpot provides a comprehensive package to build a wide range of reports and visualizations with Jira data for meaningful analyses. You can leverage its capabilities to integrate data from multiple data sources, key business functions, and processes. Integration with ThoughtSpot allows for a more accurate understanding of R&D performance and ensures that strategic decisions are driven with a comprehensive view of the organization’s operations.


