In today’s data-driven world, visualization goes beyond displaying numbers — it’s about empowering users to express meaningful stories from data. Visualization is key to quickly interpreting data, uncovering patterns and trends, and enabling faster, more trusted decisions.
At ThoughtSpot, we have always championed making data accessible and actionable for everyone. With our AI-powered analytics, any user can self-serve key business insights within seconds. Creating interactive visualizations in ThoughtSpot is simple, with a rich native library of 26 chart types to choose from.
We have heard from you that you wanted even greater flexibility for creative and diverse expression of data. Earlier this year, we launched Custom Charts, which enables customers and partners to bring any self-hosted chart type into ThoughtSpot. This has opened up countless possibilities for richer visuals and data narratives in ThoughtSpot.
Today, we’re thrilled to announce our partnership with VitaraCharts, bringing an advanced visualization library that extends ThoughtSpot’s capabilities to deliver an even richer, more dynamic visualization experience. Our partnership enables anyone to explore and communicate insights in innovative ways, unlocking new opportunities for data-driven decision-making. Please note that VitaraCharts requires a separate subscription and is not included in your ThoughtSpot subscription by default.
Unlock new visualizations with VitaraCharts
VitaraCharts has a well-earned reputation in the data visualization industry, serving customers across various BI tools for over a decade. With a presence in over 20 countries and expertise spanning industries including, but not limited to, retail, healthcare, finance, and manufacturing, VitaraCharts is trusted by businesses worldwide to reliably deliver impactful visualizations.
ThoughtSpot users can leverage VitaraCharts to communicate their data stories with a wide range of advanced, customizable charts These charts are available in a plug-and-play format — requiring zero coding — that you can deploy on your ThoughtSpot instance within seconds.
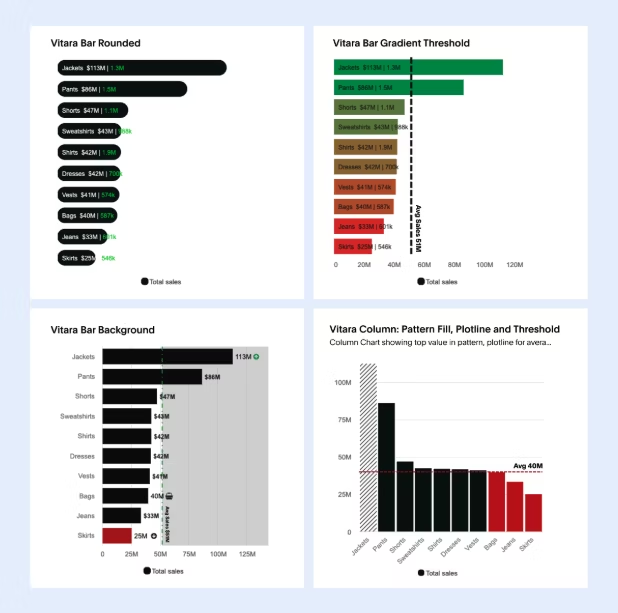
Here’s a sneak peek of the visualization capabilities that VitaraCharts brings to you in ThoughtSpot.
Access 20+ new chart types
With VitaraCharts on ThoughtSpot, you gain over 20 additional chart types. This unlocks endless possibilities for data storytelling — whether you want to efficiently track targets, compare performance metrics, visualize progress, analyze distributions, or highlight data relationships.
Achieve pixel-perfect control on VitaraCharts visuals
Pixel-perfect charts enable you to create Liveboards that are clear, trustworthy, and impactful for quick decision-making. You have control over every detail in a chart from VitaraCharts, ensuring your visualizations meet your exact needs.
Some of these capabilities include:
Customization of shapes, size, patterns for all mark types
Dynamic text in data labels and tooltips
Conditional formatting with color, backgrounds
Annotations and thresholds on charts
Custom background images and colors
Other key features that enhance chart interactivity include:
Small multiples
Animations on charts
Polar mode for charts
Custom markers and symbols that can be controlled via conditions

Supercharge your grids
Grids help you present detailed data in an easy-to-read format, making it easier and faster to scan large datasets. With performant and customizable grid charts from VitaraCharts, complex analyses, like portfolio performance tracking, expense monitoring, financial statements, and customer segmentation, become much easier to present. Standout capabilities include:
Deltas and variances within grid
Microcharts
Filtering and sorting
Row and column grouping
Tables within cells
Images, icons, and markers within cells
Why choose VitaraCharts?
Here’s why VitaraCharts is a game-changer for ThoughtSpot users:
Seamless integration with native ThoughtSpot features: You can pin charts from VitaraCharts on Liveboards, and use your favorite interactive features on these charts, including drill anywhere, filtering, explore, and more. ThoughtSpot makes it easy to go from high-level analytics to granular insights.
Advanced library of charts: Adding 20+ customizable chart types on top of ThoughtSpot’s existing set, VitaraCharts has something for everyone, from new visualizations to pixel-perfect control over popular chart types. In addition, VitaraCharts will continue to innovate by adding new features and new types of charts in the future.
Plug-and-play deployment: Install and deploy visualizations on your ThoughtSpot instance within seconds. Once installed, all users receive instant access to charts within your instance.
Enterprise-grade security: Your data never reaches VitaraCharts servers, and no data or configuration is written back to VitaraCharts servers. VitaraCharts servers are used by the ThoughtSpot platform only to fetch the charts developed by VitaraCharts.
Fully supported: Software maintenance, upgrades, and expert technical support are all included with the VitaraCharts subscription.
Elevate your analytics experience today
Discover how ThoughtSpot and VitaraCharts can transform your data into business-ready insights. Start your free 30-day trial, or schedule a demo with VitaraCharts today.
At ThoughtSpot, we’re dedicated to continuously improving the data experience for everyone and help your business achieve faster time to AI-powered insights and a better data experience for everyone.
New to ThoughtSpot? Sign up for free today.


