Do you ever debug concurrent programs and are left wondering what the threads were up to? Deadlocked? Stuck in a system call?
In this blog post we’ll share ThreadStacks, a library that we have developed at ThoughtSpot to inspect thread stack traces of live processes.
ThreadStacks is a staple debugging tool at ThoughtSpot and has helped us root-cause issues ranging from deadlocks to slow database queries to stuck HDFS reads.
Live debugging of a concurrent program running hundreds of threads is hard. Earlier this year, one of our customers complained about intermittent slow database queries. As soon as they fired a specific query, all other concurrently executing queries slowed down significantly. In a typical debugging session like this, we would spend hours trying to infer the state of query processing threads by groking code, logs, and looking at kernel stack traces of threads through the proc filesystem.
However, ThreadStacks allowed us to root-cause the issue in a few minutes - the stack traces made it obvious that one of the queries was taking an egregiously long time in optimization phase and was starving the rest of the queries, which were done executing but were stuck trying to acquire a lock to insert their results in the result cache. As our database typically spends only a few milliseconds optimizing queries, this implicit locking dependency between optimization phase and cache insertion went undetected, until ThreadStacks surfaced it.
Implementation
As we found ourselves spending non-trivial amounts of time debugging concurrent programs, it was clear that we wanted a jstack-like functionality for our backend services written in C++. The main goal was to have the ability to inspect stacktraces of a live process, without stopping or pausing its execution.
ThreadStacks collects stacktraces of threads in a live process by using POSIX realtime signals. Realtime signals have two advantages over vanilla POSIX signals - they are queued, and they can carry a payload. Both of these features are crucial to ThreadStacks’s implementation, as described below. Writing correct signal handlers is tricky because of the async-signal safety requirements, but this restriction is what makes writing signal handlers fun - one has to come up with innovative solutions and workarounds for the restrictive environment. For example, it is unsafe to allocate memory from a signal handler, as most malloc() implementations are non-reentrant and thus are not async-signal-safe. Infact, POSIX enumerates only a handful of system calls that are guaranteed to be async-signal-safe.

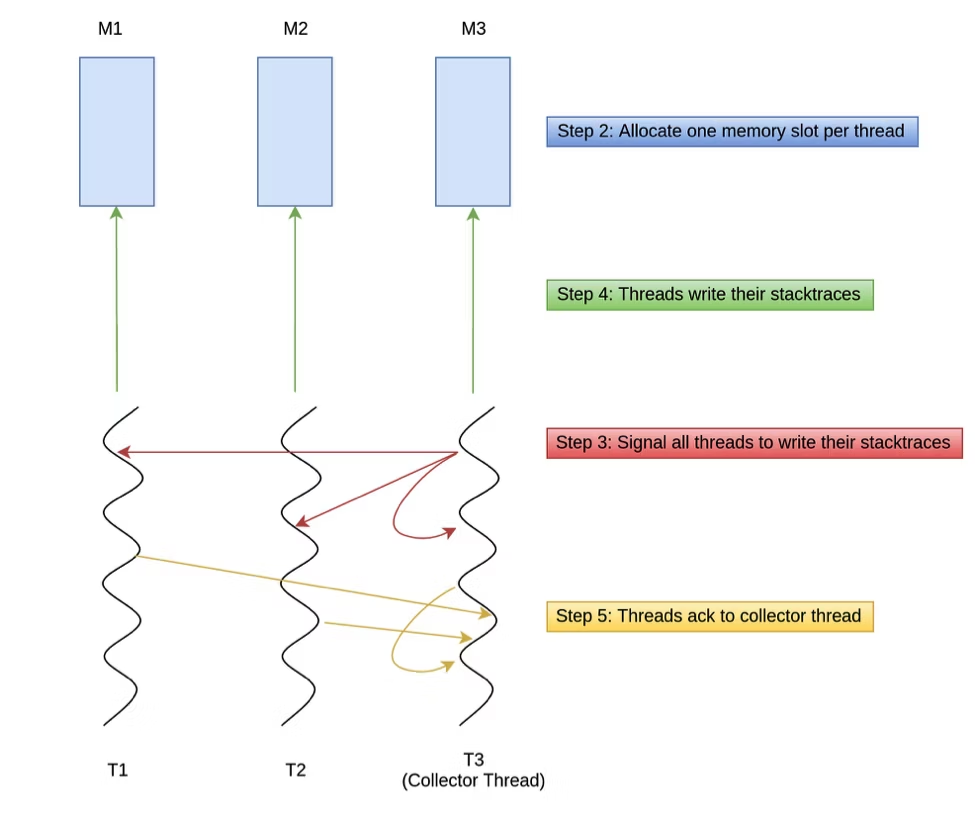
The following steps are executed to collect stacktraces of threads:
Find the list of threads running in the process (T1, T2, T3). This is done by getting children of ‘/proc/self/task’ directory.
Allocate a memory slot for each thread to write its stacktrace (M1, M2, M3). Note that allocating memory from signal handlers is not async-signal-safe, hence memory is allocated beforehand.
Send a realtime signal to each discovered thread and wait for their acks. The corresponding memory slot and an ack file descriptor is part of the payload of the realtime signal.
Threads’ signal handler uses libunwind to compute their stacktraces and write raw instruction pointer based stacktrace in their respective memory slots.
After writing its stack trace in the designated memory slot, each thread acks back to collector thread over a pipe.
On receiving all the acks (same as the number of threads detected in step #1), collector thread uniquifies and symbolizes the stacktraces.
At ThoughtSpot, we use ThreadStacks in three different ways:
Web UI: Our C++ services expose a rest endpoint, which can be accessed to get stacktraces of the process.
Kill command line: Our C++ services dump stacktraces to stderr on receiving signal 35.
Stacktraces on crash: Our C++ services use ThreadStacks to dump stacktraces of all the threads before crashing.
Today we are excited to open source ThreadStacks under MIT license. C/C++ developers can easily integrate ThreadStacks in their binaries by installing ThreadStacks’s signal handlers. ThreadStacks comes with a Bazel build setup, so it’s simple to build and integrate in your existing projects. You can download the source code at https://github.com/thoughtspot/threadstacks.
We hope ThreadStacks saves you tons of debugging time. Happy debugging!


