Managing your organization’s financial data can feel like trying to navigate a maze blindfolded. That’s why nearly ⅓ of data professionals in the finance industry report spending +40% of their budget on data management alone. With generative AI now intensifying the competitive and fast-paced nature of nearly every market, the financial industry, in particular, is focusing on data capabilities that will drive more informed decision-making and deliver better outcomes.
If you've found your way here, chances are your current analysis tool isn't quite cutting it. Or, you're on the hunt for a more modern, GenAI solution that can tap into new levels of efficiency and accuracy for financial planning. Allow this article to be your guide.
Table of contents:
We might be a bit biased, but we’re confident ThoughtSpot deserves a top spot among financial analysis software. Leading in AI-powered analytics, ThoughtSpot offers the ability to analyze vast datasets, providing a comprehensive 360-degree view of your organization's financial performance. You can leverage powerful AI-powered features that help you see trends in your data and access accurate, actionable insights across finance, procurement, sales, and inventory management.
With natural language, you can search and understand your financial data, helping you make informed finance decisions that translate to tangible value—all without compromising confidence and security.
Core features of ThoughtSpot
1. GenAI-powered self-service analytics
With Spotter, ThoughtSpot’s AI Analyst, exploring data becomes as engaging as chatting with an analyst colleague. You can simply ask a question (eg, what were our sales last month) and receive actionable insights within seconds. There’s also no limit to the number of questions you can ask—our intuitive search interface enables deeper exploration till you get your data story just the way you want it.
2. Interactive Liveboards
Liveboards give your finance team a real-time view of your company's financial health, providing instant access to key metrics and performance indicators. These interactive dashboards allow you to customize visualizations, drill down into particular data points, and leverage AI-powered insights to identify trends and opportunities. Once you have these actionable insights, you can share them seamlessly across your organization, fueling smarter, data-driven decisions.
3. Augmented analytics with SpotIQ
ThoughtSpot’s SpotIQ empowers business users to perform complex analytics and analyze key metrics—even on the go. It leverages machine learning models to go beyond surface-level observations and detects hidden trends and anomalies. This proactive approach gives you precise insights into the drivers behind your finance metrics, helping you identify areas for cost optimization and revenue growth. Additionally, SpotIQ allows you to analyze historical financial data, providing more accurate trend predictions to guide strategic planning.
4. Seamless collaboration and sharing
Making insights accessible to a wider audience within an organization is the key aim of financial data analysis and visualization. With ThoughtSpot, business users can analyze, interpret, and share their data across different departments, without the need for specialized training. You can even add Notes, detailing important directions for how to read or use a specific visualization.
QuickBooks is an accounting software developed and marketed by Intuit. Known for its user-friendly interface, QuickBooks is typically used by small to medium-sized businesses. Its accounting features include invoicing, expense tracking, and financial reporting. Some users report a lack of advanced features needed for complex financial analysis, making it difficult to scale as your business grows.
Core features of QuickBooks
Streamlined invoicing
Expense tracking and categorization
Standard financial reporting
Bank reconciliation
Tax preparation assistance

Oracle Essbase, formerly known as Hyperion Essbase, provides enterprise performance management and business intelligence solutions. It offers analytics capabilities, such as multidimensional data modeling and scenario analysis, enabling organizations to optimize planning, budgeting, and forecasting processes. That said, it’s widely used for reporting out findings, not necessarily self-service analysis for business users. Some users report challenges with its complex software interface, time to run calculations, and issues with formatting data from other tools.
Core features of Oracle Essbase
Multidimensional data modeling
Scenario analysis and forecasting
Advanced analytics capabilities
Data integration
Performance management tools

NetSuite is a cloud-based ERP solution designed to streamline financial management, CRM, and eCommerce operations. Its reporting features include real-time data management, customizable fields, and role-based dashboards, making it easier to support tasks like account reconciliation across departments. However, some users might find it challenging to pull financial data due to the complexity of the system's navigation and reporting features.
Core features of NetSuite
Cloud-based ERP functionality
Unified platform
Customizable workflows and dashboards
Scalability
Seamless integration

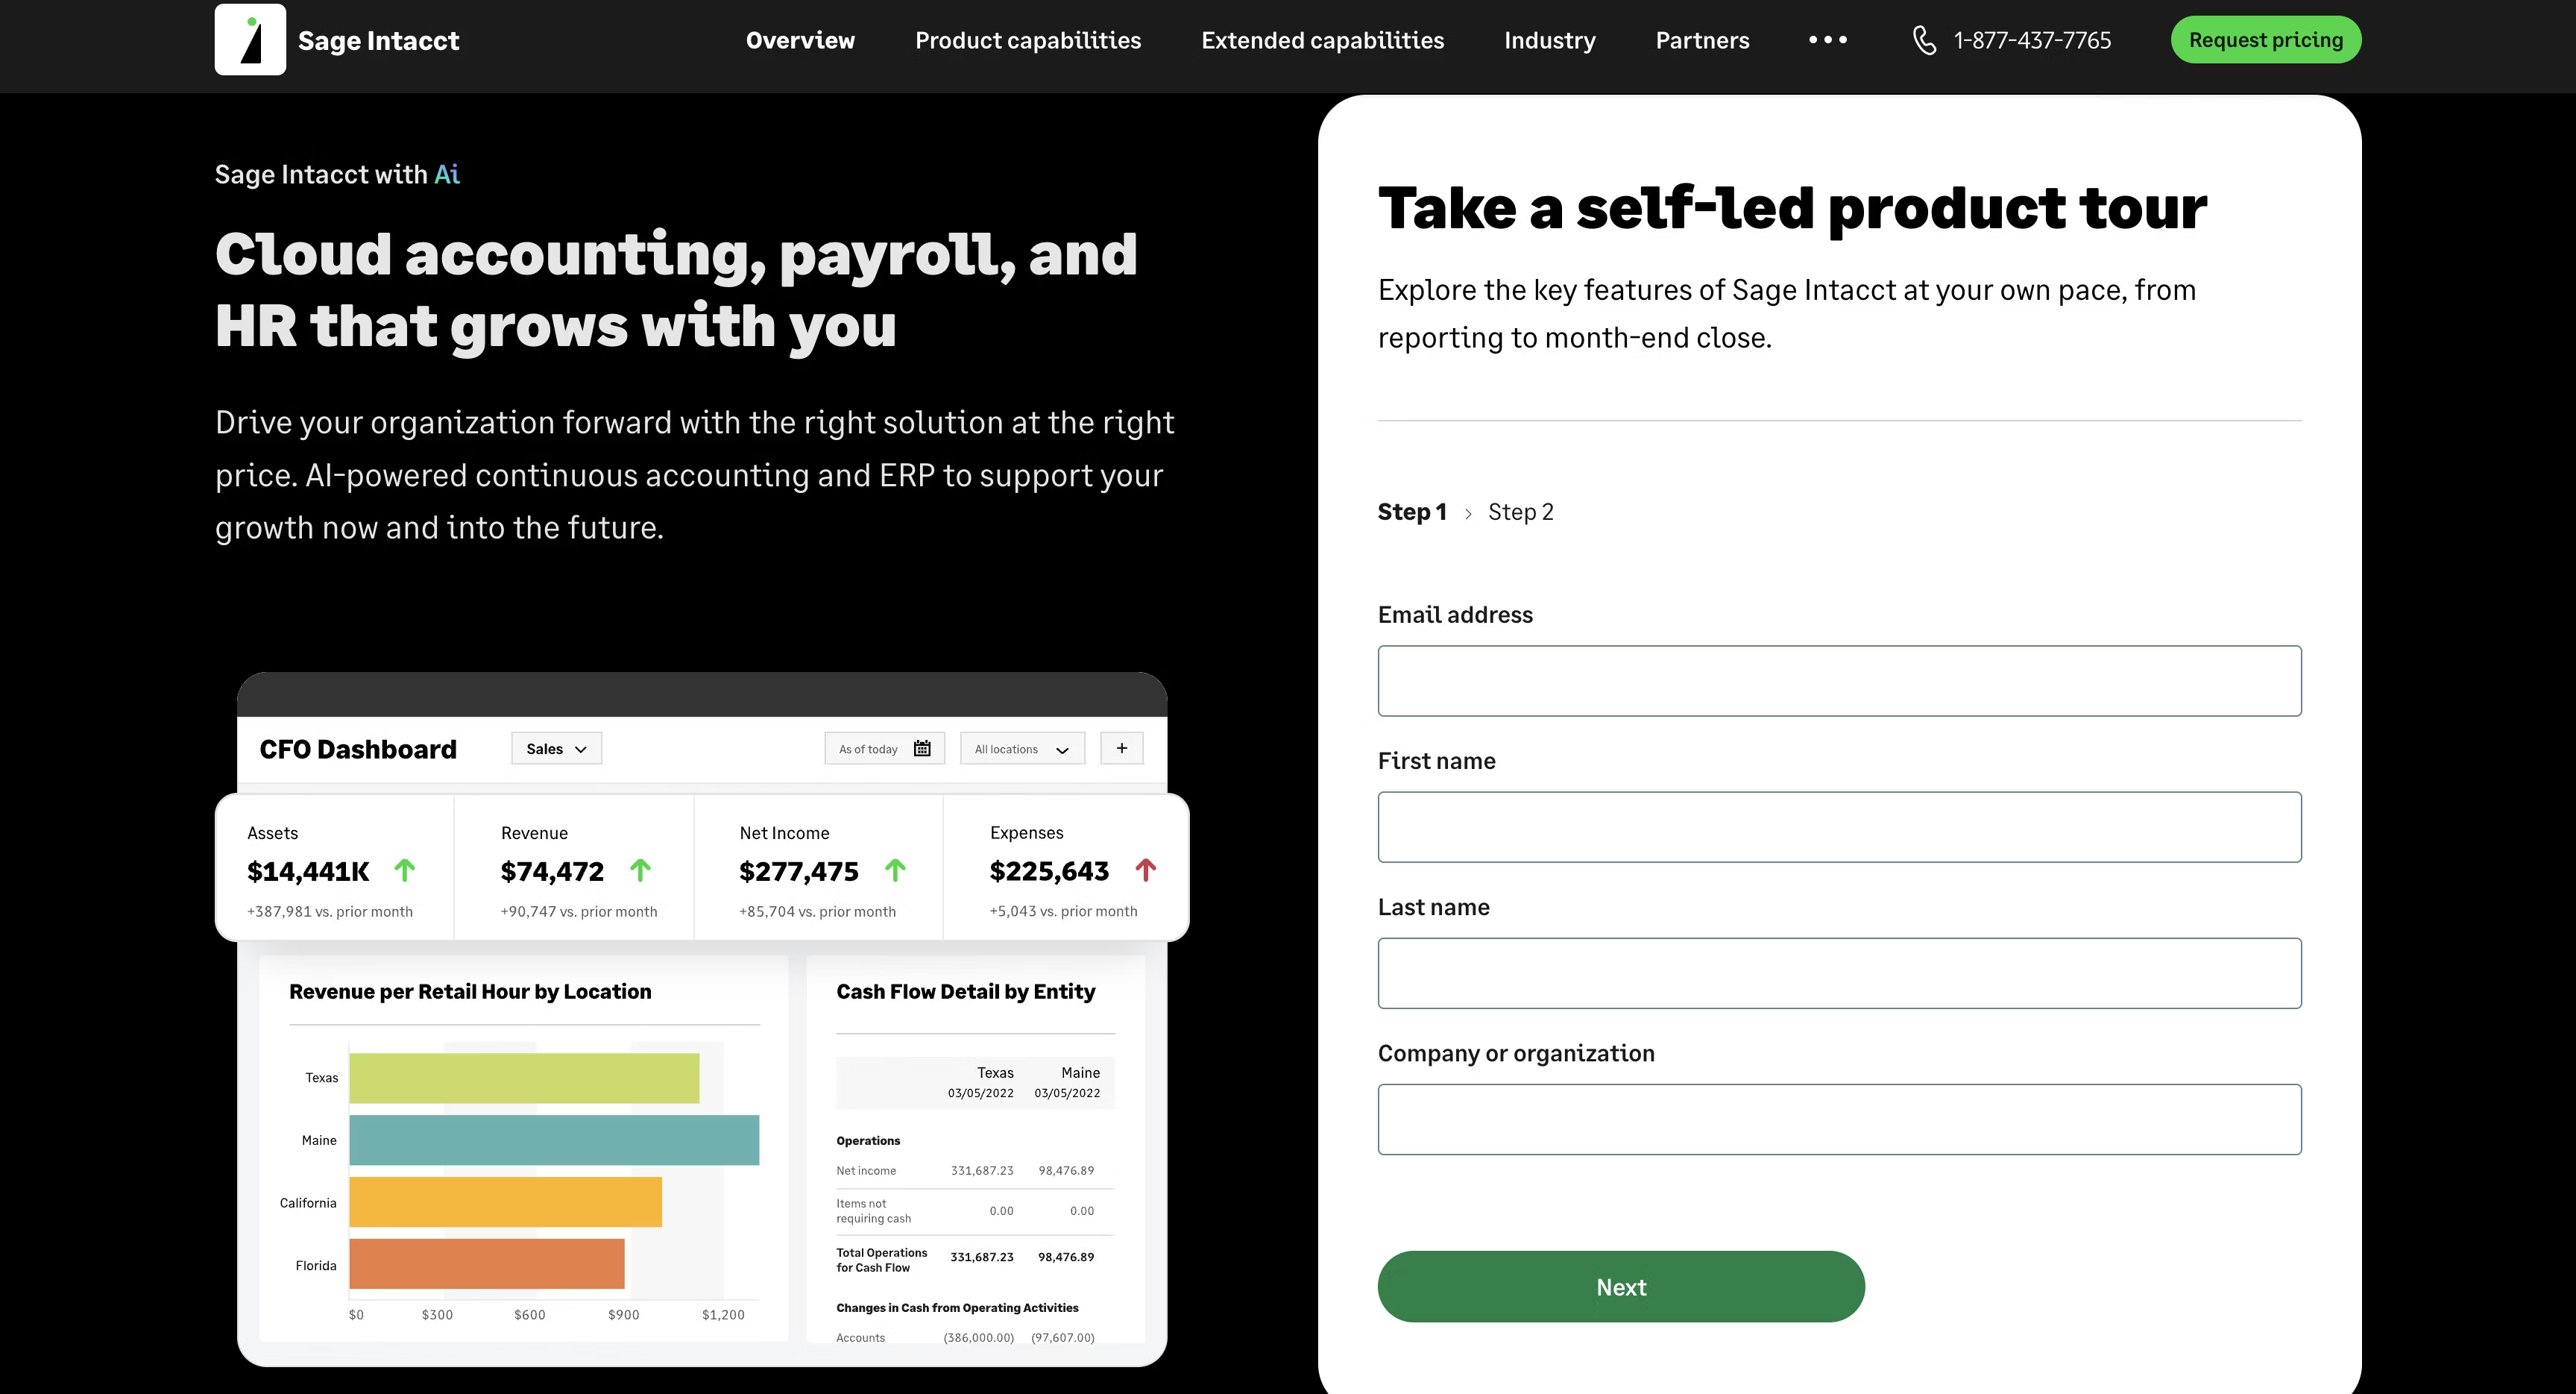
Sage Intacct is a cloud-based financial management solution utilized by medium- to large-sized businesses. It offers features for accounting, budgeting, and reporting such as multi-entity consolidation for financial statements, customizable dashboards, and others listed below. While the tool offers a number of features to help with financial management, some users take issue with the initial setup process, onboarding, and usability..
Core features of Sage Intacct
General ledger management
Budgeting and planning
Reporting and analytics
Multi-entity consolidation
Workflow automation

Refrens is a widely-used financial software, trusted by over 150,000 businesses globally. While its invoicing software is the most popular, it also provides comprehensive tools for accounting, inventory management, expense tracking, and sales CRM, making it a complete solution for all business needs. Though it offers a free trial, many users have expressed a desire for an unlimited free plan.
Core features of Refrens
Powerful Invoicing
Automated Accounting
Business Automation Tools
Inventory & Expense Management
Integrated Sales CRM
Multi-User & Multi-Business Support
When you're in the market for financial analysis software, it’s essential to know which features will deliver the most value for your specific needs. Here are some key aspects to consider:
Integrations and ability to import data: Data comes from multiple sources—think accounting software, spreadsheets, and databases. Make sure your selected financial analytics software integrates with other systems to ensure seamless data flow.
Financial modeling: Advanced financial analysis software often includes tools for building financial models. These models can simulate different scenarios, project future outcomes, and assess the impacts of various decisions. Be sure your selected tool is powerful enough to perform the models required for your work.
Ratio analysis: Automating the calculation of financial ratios is a game-changer. Ensure the software can handle liquidity ratios, profitability ratios, and efficiency ratios. These insights are fundamental to understanding your company’s financial health.
Trend analysis: Identifying trends over time is essential for understanding your company's performance. Your financial analysis software might include features for visualizing trends in key financial metrics such as revenue, expenses, and profitability.
Compatibility with AI technologies: It’s important to ensure the software is compatible with AI technologies. AI-driven features like predictive analytics and natural language search can significantly enhance your financial analysis capabilities. Plus, by improving the user experience, your team is more likely to actually engage with the selected product.
Forecasting and budgeting: Predicting future financial performance and creating budgets is essential for planning and decision-making. Financial analytics software tools can assist in forecasting future revenues, expenses, and cash flows, as well as creating and managing budgets.
Dashboard and visualization: Dashboard software and data visualization tools provide intuitive interfaces to explore financial data and analysis results. Interactive charts, graphs, and financial dashboards enhance understanding and facilitate more informed decision-making.
Collaboration and sharing: Collaboration features allow multiple users to work together on financial analysis projects, share insights, and collaborate in real-time. By ensuring your team is operating with the same information, you improve accuracy and comprehension across your org.
Improved accuracy: By automating calculations and data entry, financial analytics software significantly reduces the risk of errors. Of course, accurate financial data is crucial for making sound business decisions.
Time efficiency: Automation and real-time data analysis save valuable time. Finance professionals can focus on strategic planning and decision-making rather than manual data processing.
Enhanced decision-making: With access to real-time data and powerful financial analytical tools, you can make more informed and timely decisions. This leads to better financial management and increased profitability.
Scalability: As a business grows, its financial needs become more complex. Financial analysis software can scale with your business, offering more advanced features and capabilities as needed.
Regulatory compliance: Keeping up with changing financial regulations can be challenging. Many financial analysis tools include compliance features, helping you adhere to relevant laws and regulations.
Financial analytics software is your key to simplifying complex financial data and helping decision-makers navigate uncertainties with speed and confidence. While there are many financial analysis tools available, ThoughtSpot stands out by empowering you to interact with your financial data in a whole new way.
Consider Modern Restaurant Concepts. Former Finance Director Lisa Sauer traded in Excel spreadsheets for streamlined reporting with ThoughtSpot. Now, the finance team is looking closely into actual sales versus forecasts, budgeting more easily, correcting course quickly when necessary, and setting more transparent goals.
Leveraging ThoughtSpot’s natural language search and advanced data visualization, you can unlock actionable insights that drive smarter financial decisions. See for yourself—schedule a demo today.


