


Facing increasingly high customer expectations, new competitive pressures, and an uncertain economic outlook, business leaders need their data to deliver more value than ever before. So, how do you maximize value from data?
Here’s the good news: Big data analytics tools can empower everyone in your organization to gain meaningful insights from relentless waves of data. In fact, research by McKinsey shows that companies using a data-driven approach report above-market growth and an increase of 15-20% in profits. But with so many options, how do you choose a tool that aligns with your business needs? The answer lies below.
Table of contents:
ThoughtSpot is a leading intelligence platform that is changing the way businesses make data-driven decisions. The AI-powered, search-driven approach allows you to ask questions in natural language and get instant insights through interactive, drillable visualizations. Whether it’s business users accessing data independently or data teams driving deeper analysis, ThoughtSpot encourages everyone to find the power of their data.
With advanced capabilities designed for true self-service and enterprise-grade security, ThoughtSpot integrates insights easily into your everyday workflows. Your data teams can accelerate their analysis, while you can benefit from AI-powered solutions that deliver real business outcomes.
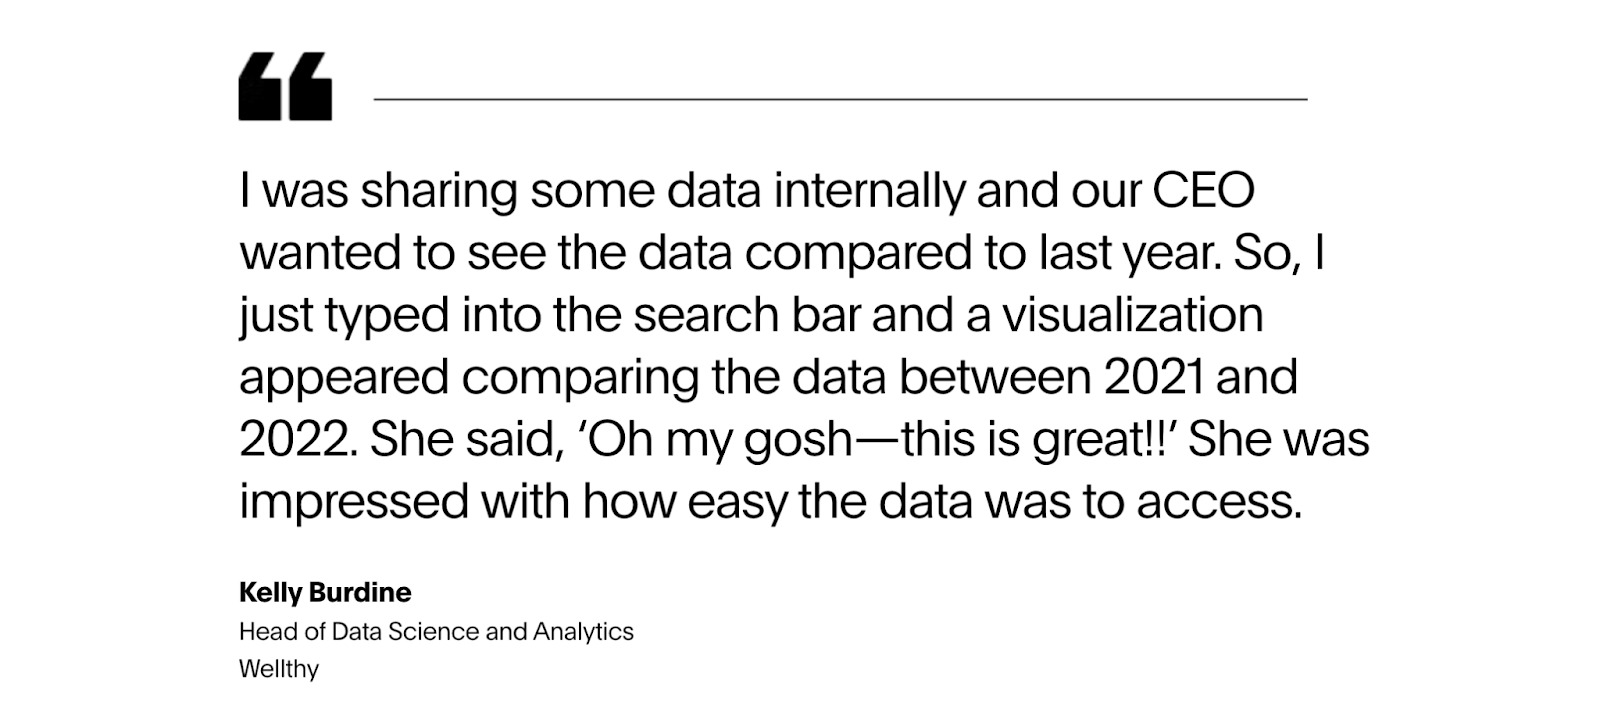
Take Wellthy, for example. By adopting ThoughtSpot, they saved over $200K by streamlining their analytics pipeline, freeing up their data team to focus on more strategic work. Partners, customers, and internal teams now access the insights they need with ease, through natural-language search and verified data visualizations
Here’s what Kelly Burdine, Head of Data Science and Analytics, at Wellthy, has to say:
Core features of ThoughtSpot:
1. Spotter, your AI analyst
Spotter acts as your AI analyst, providing actionable insights in an instant. Whether you ask simple questions like "What were our sales last month?" or dive into more complex queries, Spotter handles it all. Unlike traditional BI tools that need SQL skills, Spotter analyzes data on its own and creates accurate visualizations and reports, making data insights easy for anyone to access.
2. Dynamic dashboards and visualizations
Next-gen AI-augmented dashboards redefine how you interact with and understand your data. These advanced dashboards provide real-time, interactive insights, allowing you to explore your data as it evolves. Powered by AI, they deliver not just static reports, but dynamic visuals that update instantly as new data comes in.
3. Predictive analytics
You can forecast future trends and outcomes with this feature. With predictive analytics, you can look beyond historical data and gain a clearer view of what’s coming next. This allows you to proactively plan and make decisions based on data-driven projections, whether it's forecasting sales growth, market shifts, or customer behavior.
4. AI-driven data prep
You can speed up your data preparation with AI-powered tools that support SQL, Python, and R, making data cleaning and management quicker and more efficient. In Analyst Studio, you spend less time manually prepping data and more time analyzing it. The AI-powered tools streamline repetitive tasks, automate processes, and handle complex data sets, freeing you up to focus on deeper insights and strategic analysis.
Power BI is a big data analytics tool that integrates with Microsoft’s ecosystem, allowing businesses to analyze and visualize large datasets. The platform offers data analytics features, like data modeling, dashboards, and reporting. Despite its intuitive interface, leveraging Power BI’s advanced capabilities can be challenging, especially for business users who will likely require additional training.
Core features of Power BI:
Data visualization and reporting: Turns data into charts, graphs, and dashboards for easy analysis.
Connects with Microsoft ecosystem: Integrates with tools like Excel, Azure, and SQL Server for data access.
Data modeling: Organizes and structures data for easier analysis, especially when combining multiple sources.
Data transformation: Cleans and reshapes data to prepare it for analysis.
Sharing and collaboration: Allows sharing and collaborating on reports and dashboards with others.
Qlik Sense allows business users to run ad-hoc queries and apply advanced data analytics techniques to large datasets. Users can build visualizations, get recommendations, and monitor real-time data. Qlik Sense can be deployed either on-premise or in the cloud.
Core features of Qlik Sense:
Data visualization and reporting: Converts data into interactive visuals for easy insights.
Real-time monitoring: Tracks data as it changes, providing up-to-date information.
Data modeling: Organizes and connects data from different sources for better analysis.
Sharing and collaboration: Facilitates sharing reports and working together on data insights.
Embedded analytics: Integrates analytics directly into apps or workflows for easy use.
Tableau is Salesforce’s legacy big data analytics tool that lets users visualize and analyze data. With a drag-and-drop interface, users can create interactive dashboards to gain insights. The platform integrates with multiple data sources, allowing you a high-level view of critical KPIs. However, navigating Tableau can be difficult for business users as the platform requires an analytical background.
Core features of Tableau:
Data visualization: Turns data into easy-to-understand visuals.
Data connectivity: Connects to a wide range of data sources for easy access.
Available to view on different devices: Makes it simple to access dashboards on desktop, tablet, or mobile.
Report sharing and collaboration: Allows sharing of reports and collaboration with others.
App-level security: Ensures data is protected with security measures at the app level.
Apache Hadoop is an open-source framework based on Java that manages the storage and processing of large datasets. Hadoop uses distributed storage and parallel processing to break down enormous amounts of data into smaller workloads, allowing analysts to store and process data quickly.
Core features of Apache Hadoop:
Scalable data storage: Can store large amounts of data across multiple machines.
Data processing: Processes massive datasets using distributed systems.
Open-source framework: Free and open for anyone to use, with a large community for support.
Distributed computing model: Breaks down tasks across multiple machines for faster processing.
Apache Spark is another open-source data-processing big data analytics software that handles large amounts of semi-structured and structured datasets. In addition, the platform leverages in-memory computing to process data and includes several libraries to support SQL queries, stream processing, and AI/ML applications.
Core features of Apache Spark:
Stream data processing: Handles real-time data streams for immediate analysis.
Advanced data analytics: Offers tools for complex analytics, including machine learning.
Supports SQL queries: Allows running SQL queries on large datasets for easy analysis.
Open-source framework: Free to use, with a community for support and development.
1. Handles large volumes of data
As the name applies, the ability to handle large data volumes is a key requirement for big data analytics tools. That’s because you need a scalable big data analytics solution with real-time processing features to handle your organization’s current and future data volume. Moreover, the platform should support connectivity with multiple databases and cloud data platforms. This will help you analyze the dormant data in your data warehouses and identify hidden growth opportunities.
2. Supports interactive data visualization
Spreadsheets are boring and quite frankly hard to read. Turning complex datasets into data visualizations helps you present data in a digestible, contextual, and actionable way. As you qualify solutions, ensure that your big data analytics tool has a simple and intuitive user interface that allows users to customize their dashboards and create interactive data visualizations so everyone can understand data and make timely decisions.
3. Features innovative AI capabilities
Big data analytics tools aren’t limited to running ad-hoc queries and creating visualizations. AI-powered big data solutions offer capabilities like natural language search and machine learning to help business users and data teams get into the nitty-gritty of data and find valuable insights.
For instance, business users can use AI-powered solutions like ThoughtSpot to ask questions in natural language and get instant AI-assisted answers, visualizations, and recommendations. On the other hand, data teams can leverage conversation AI to dig deeper into their data—asking questions and follow-up questions just as easily as talking to a coworker on Slack. These features significantly reduce time-to-insight and promote timely decisions across the organization.
4. Has real-world use cases
How can you tell if a product is effective in the real world? You have to put it to the test. To establish a vendor’s credibility and demonstrate the solution’s ability to solve complex business problems, check out customer case studies and reviews for up-to-date information about the platform’s capabilities, performance, and customer support. We also recommend exploring the product beforehand through demos, as it will allow you to understand the platform’s capabilities.
5. Delivers self-service analytics
Instead of gatekeeping insights to a select few analysts and IT specialists, your big data analytics tool should deliver self-service analytics. By democratizing data and allowing every business user to find insights on their own, you empower every decision-maker to find the information they need when they need it. With self-service analytics, users can create detailed reports and live dashboards, and monitor business performance on the go, enabling data-driven decisions rather than relying on their gut feelings.
Data teams spend a lot of time and effort in modeling, transforming, and analyzing data. But if the data doesn’t help business users make timely decisions, you will never be able to drive meaningful growth at scale.
To become a data-driven organization, you need a true self-service data analytics tool that allows business users to ask questions in natural language and build interactive dashboards. That way, your data team isn’t stuck creating hundreds of reports and can focus on larger data initiatives.
ThoughtSpot’s AI-powered search experience empowers business users to visualize real-time data, drill into specific searches, and pin charts to custom Liveboards. With the business know-how and the right tools, your entire organization can make in-the-moment decisions when they count the most. See how ThoughtSpot reduces time-to-insight—book a free demo today.


