


At the end of the day, marketing is all about building valuable customer relationships. Yet, today’s customer journeys are hardly straightforward.
Research by Google shows that 60% of customers take six or more actions before deciding to buy a product. This makes it challenging for marketing leaders to gain a solid grasp of customer behavior across channels. Marketing analytics tools can help solve this mystery. Not only do these tools give you real-time insights into customer behavior, but you can also track the effectiveness of your campaigns, identify lead nurturing opportunities, and make strategic investments.
If you've found your way here, you're probably on the hunt for an analytics tool that delivers real, actionable insights into your marketing strategy. Great news—our team at ThoughtSpot has done the heavy lifting for you. After evaluating a wide range of marketing analytics platforms, we’ve handpicked the very best to help you make impactful decisions. Here are our top picks:
Table of contents:
- 8 best marketing analytics tools of 2026
- ThoughtSpot: Best for AI-powered analytics
- Improvado: Good for marketing analytics automation
- Whatagraph: Good for cross-channel marketing insights
- Zoho Analytics: Good for traditional dashboard
- AppsFlyer: Best for Mobile Marketing Analytics
- Social Champ: Good for social media insights
- Planable: Best for social media analytics
- Looker: Good for the semantic layer
- Power BI: Good for digital analytics
- Benefits of using marketing analytics software
- Things to consider while selecting an marketing analytics tool
- Reach the right customer at the right time
- FAQs
Let’s explore all of these options in detail:
We’ll kick off this list with a shameless plug of our own offering. To be fair, our entire marketing team and a growing list of world-class customers use ThoughtSpot to gain instant insights from their data. Recognized as a leader in the 2024 Gartner® Magic Quadrant™ for Analytics and BI, ThoughtSpot delivers a true self-service analytics experience that empowers every marketer to find insights on their own and dig deeper—without needing support from the data team.
With interactive Liveboards, augmented analytics features, and seamless sharing, you can easily track crucial marketing KPIs, identify trends, and get a 360° view of customer data, allowing you to deliver personalized experiences at every touch point.
Here’s how our demand-gen team uses ThoughtSpot internally to analyze tons of data and drive our marketing funnel:
Core features
1. GenAI-powered self-service analytics
With Spotter, as your dedicated AI analyst, you can interact with data on your own terms. With its intuitive chat interface, you can ask complex business questions in natural language and gain instant insights within seconds.
For instance, you can simply ask questions, such as ‘What are the daily conversations by channels?’ or ‘Which ads are driving the highest engagement this week?’ to unlock detailed insights and take immediate action.
2. Personalized Liveboards
ThoughtSpot consolidates data coming in from different channels into a single platform, empowering you to create AI-augmented Dashboards that provide instant, real-time insights into important KPIs. With real-time filtering, drill-anywhere capabilities, and customizable visualizations, you can swiftly evaluate which marketing strategies drive revenue and develop relevant, engaging messaging.
3. Augmented analytics
AI-powered capabilities allow marketers to perform complex analytics and analyze key metrics—even on the go. With augmented analytics, you can gain automated insights into how key marketing metrics have changed, why they have changed, and explore possible outcomes.
For instance, imagine you’re running an online retail operation and notice a sudden drop in conversion rates. Change Analysis automatically identifies key change drivers and detects additional insights so you can understand the reason behind this anomaly and take corrective action.
ThoughtSpot pros
Instead of gatekeeping insights to an elite few, ThoughtSpot promises self-service analytics that empowers your entire marketing team—business users welcome—to quickly uncover key patterns, root causes, trends, and anomalies.
Spotter is your AI-powered data analyst, allowing you to ask questions in natural language and instantly receive insightful answers and visualizations.
With ThoughtSpot, users can seamlessly connect to their cloud data platforms and run live queries across billions of rows of data—all without sacrificing speed or accuracy.
ThoughtSpot cons
ThoughtSpot implementation can take some time and effort to understand. That said, documentation, tutorials, and customer support can be extremely helpful.
Pricing
ThoughtSpot offers three flexible pricing models designed to meet the unique needs of every business, whether you're a startup or a global enterprise. Here’s a quick breakdown:
The Essential plan—starts at $1250 /month: Designed for small teams and businesses who want to share AI-powered insights across teams.
The Pro plan—custom pricing: Best for growing businesses that want to give everyone access to AI-powered insights.
The Enterprise plan—custom pricing: Ideal for large enterprises looking to scale AI-powered analytics across their organization.
Free trial: 14-day trial available
Improvado is an AI-driven marketing analytics and data automation platform designed specifically for enterprise marketing teams and digital agencies. This marketing analytics tool seamlessly aggregates data from over 500 marketing sources, automating the entire data processing pipeline—from extraction and transformation to visualization. By centralizing and harmonizing marketing data, Improvado enables marketers to generate actionable insights faster and improve overall decision-making.
Core features
Data aggregation and automation: Automatically connects, extracts, and harmonizes data from over 500 marketing channels and platforms, reducing manual reporting efforts.
AI-driven querying: Improvado’s AI Agents allow marketers to query their marketing data using natural language, providing instant insights without needing technical SQL expertise.
Comprehensive data visualization: Provides robust, customizable dashboards and reports that offer deep insights into campaign performance, ROI, and audience behavior across multiple channels.
Improvado pros
Extensive integration options with 500+ marketing platforms streamline data management and significantly reduce reporting time.
AI-enhanced analytics enable quick access to insights through natural language processing, supporting data-driven decisions without technical hurdles.
Designed specifically for marketers, offering user-friendly interfaces and intuitive dashboards tailored for non-technical users.
Improvado cons
Pricing may be relatively high for small businesses or startups, given its enterprise-focused feature set and scalability.
Some users might experience a learning curve due to extensive feature availability and customizable options.
Pricing
Improvado pricing is customized based on each organization's specific needs, data volumes, number of integrations, and the complexity of the analytics required.
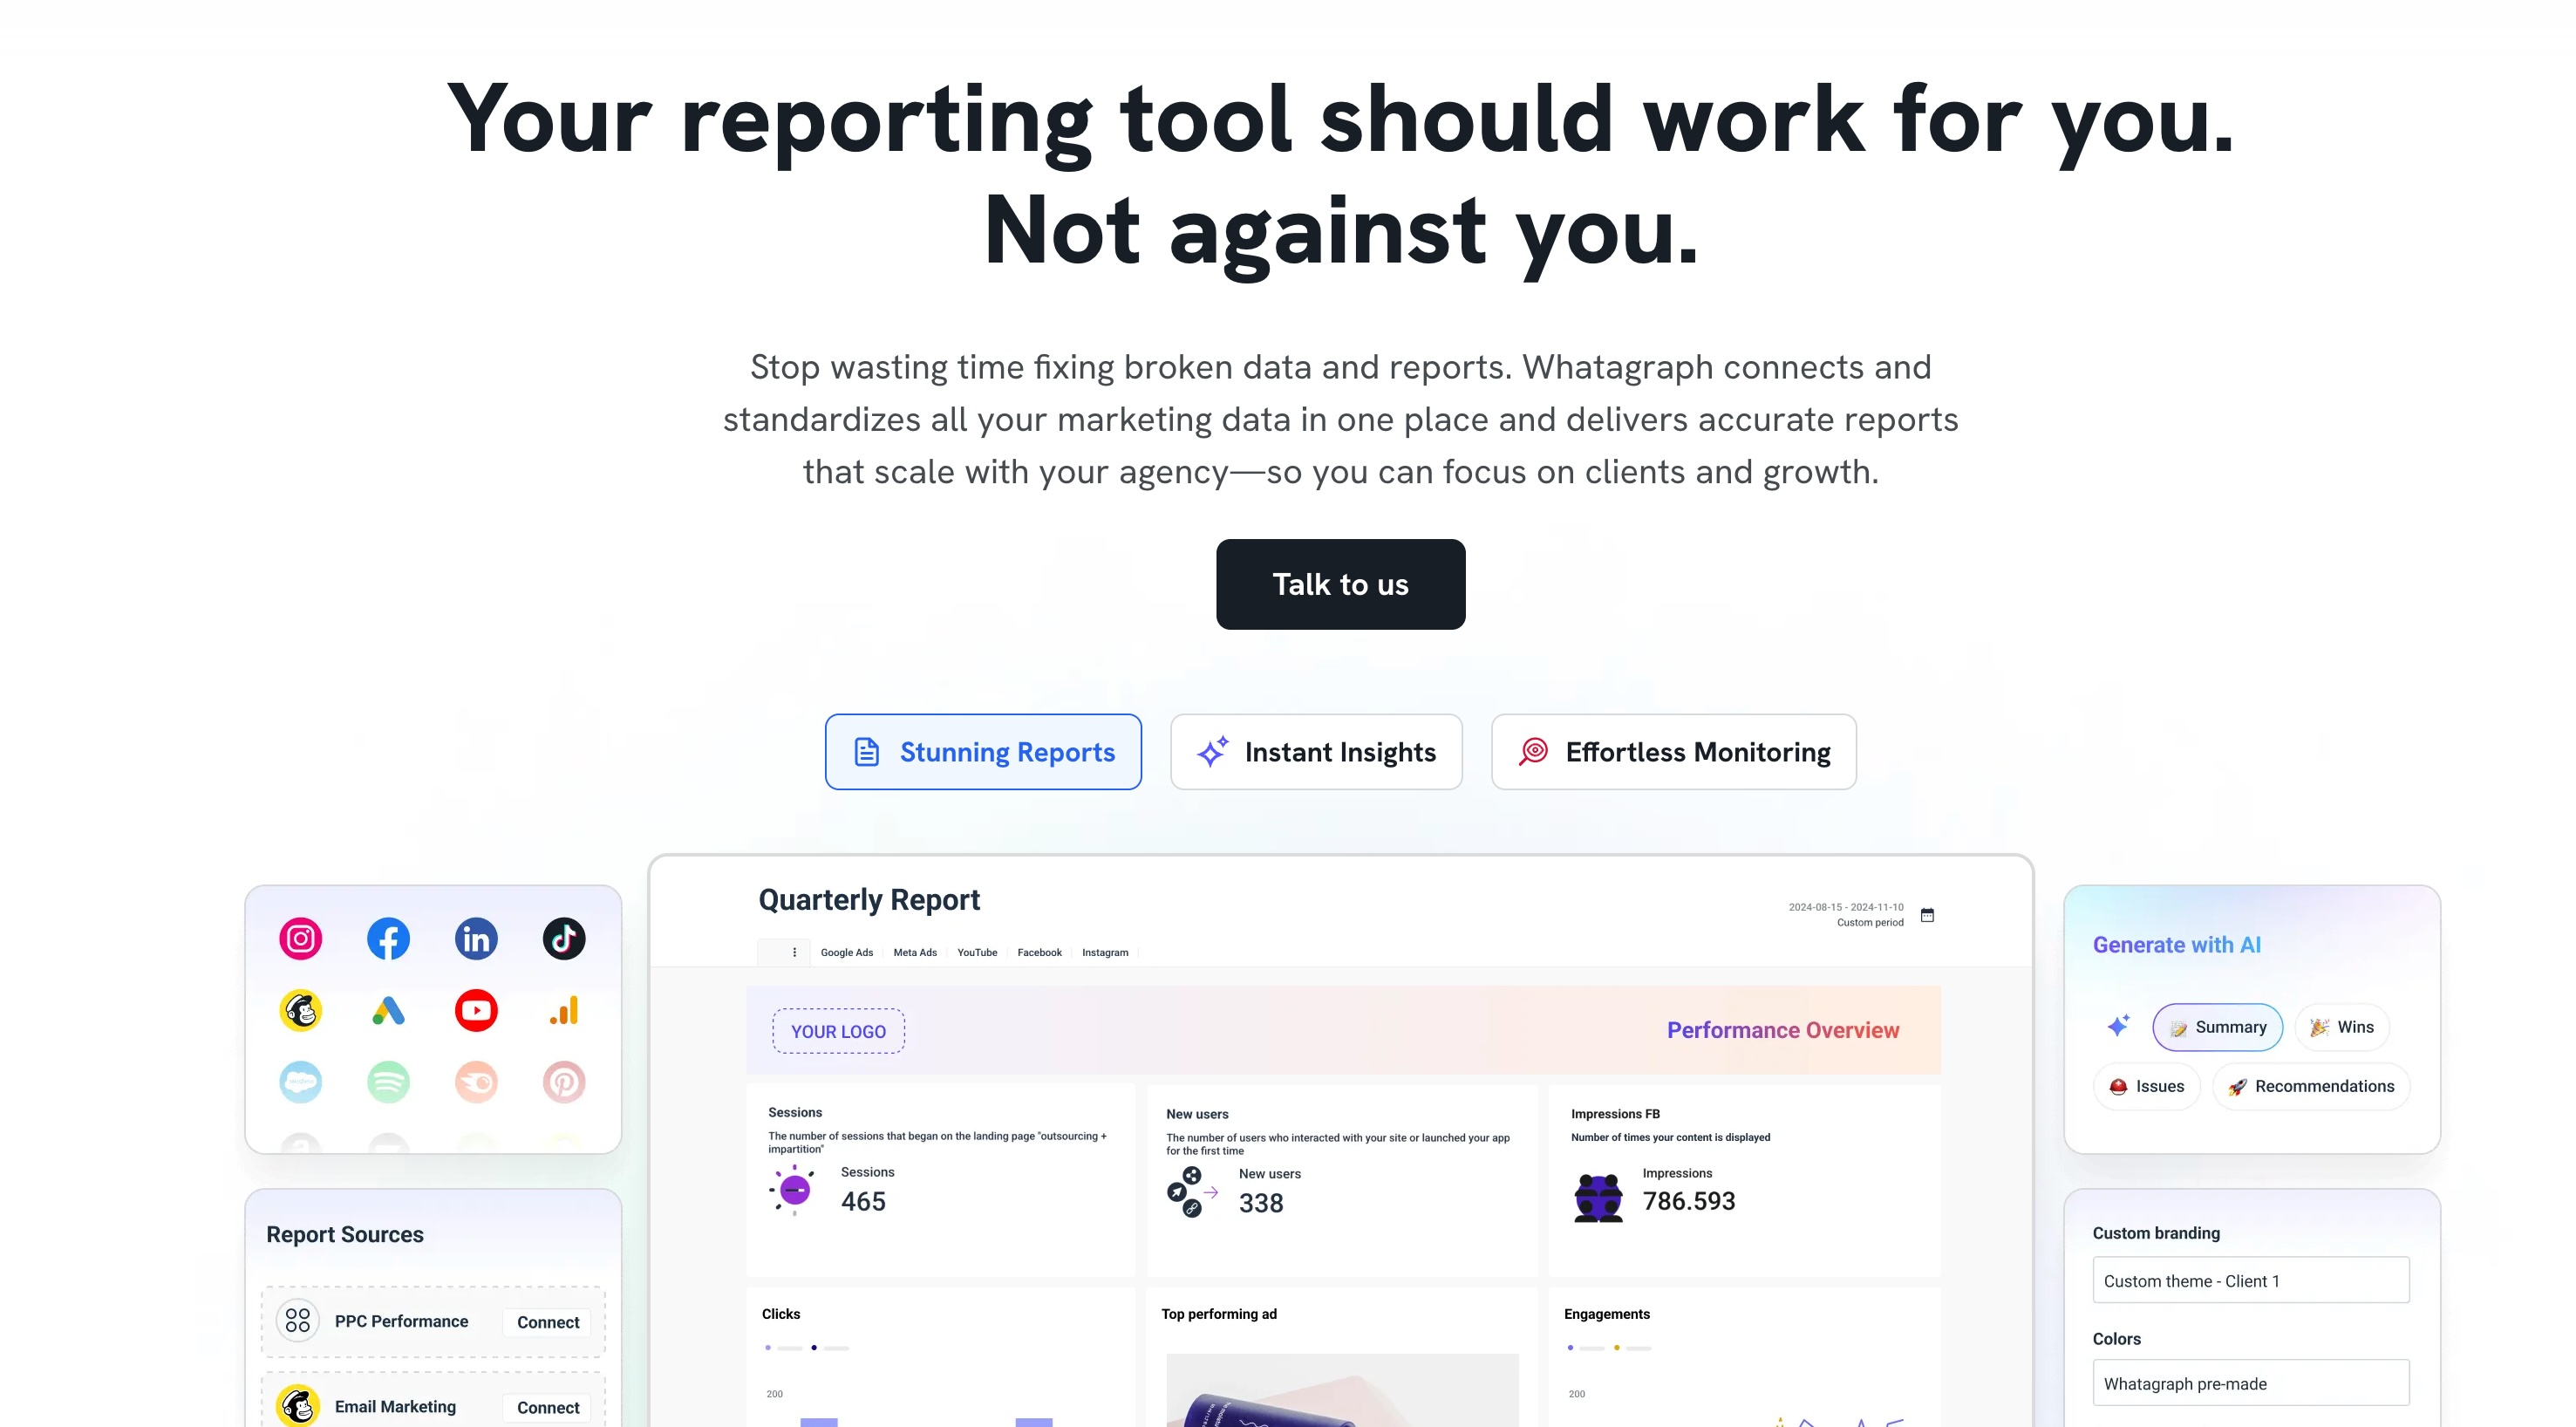
Whatagraph is an all-in-one marketing analytics platform that makes it refreshingly easy to connect, monitor, analyze, and report on your marketing data across multiple channels. Built to eliminate data silos and manual reporting, it enables marketers to connect 55+ data sources, unify metrics, and visualize KPIs in real time. You can then monitor and analyze these KPIs on a fully customizable dashboard. Whatagraph also comes with an AI chatbot that answers any questions about your marketing performance in seconds, making data analytics easy and seamless.
Core features
Cross-channel reporting: Whatagraph brings in data from 55+ marketing platforms into one place. You can then blend data from different channels and sources together and create custom metrics and dimensions without any coding.
Customizable reports: With 100+ pre-made templates, Whatagraph allows users to automate client reporting, add custom branding, and deliver reports via email, PDF, Excel, or live links.
AI-fueled insights: Whatagraph comes with two built-in AI tools. The AI Chatbot acts as a personal data analyst—you can ask it any questions about your marketing performance and get back instant answers. You can also generate editable performance summaries with AI and add them to your reports.
Whatagraph pros
Whatagraph is praised for its ease of use, thanks to drag-and-drop widgets, simple workflows for data blending, and excellent documentation in their Help Centre.
Reports are fully customizable, meaning you can not only white-label them but also adjust the page layout, add any rows and widgets anywhere you want, and even link reports together to edit them in bulk.
Customer support is highly rated—live chat answers within 1 minute and all plans include a dedicated Customer Success Manager.
Whatagraph cons
Whatagraph offers native integrations with 55+ marketing channels but this may not include the platforms you need. However, you can upload your own data via Google Sheets and BigQuery or use the custom APIs to build connections.
Whatagraph does not yet offer alerts when KPIs are trending up or down.
Data transfer destinations are currently limited to Google Sheets, BigQuery, and Looker Studio.
Pricing
Whatagraph uses a flexible, quote-based pricing model designed to adapt to the unique needs of each marketing team or agency. Its pricing is based on data sources, team size, and advanced features you need.
Please contact their team for a custom quote.
Free trial: Available upon request
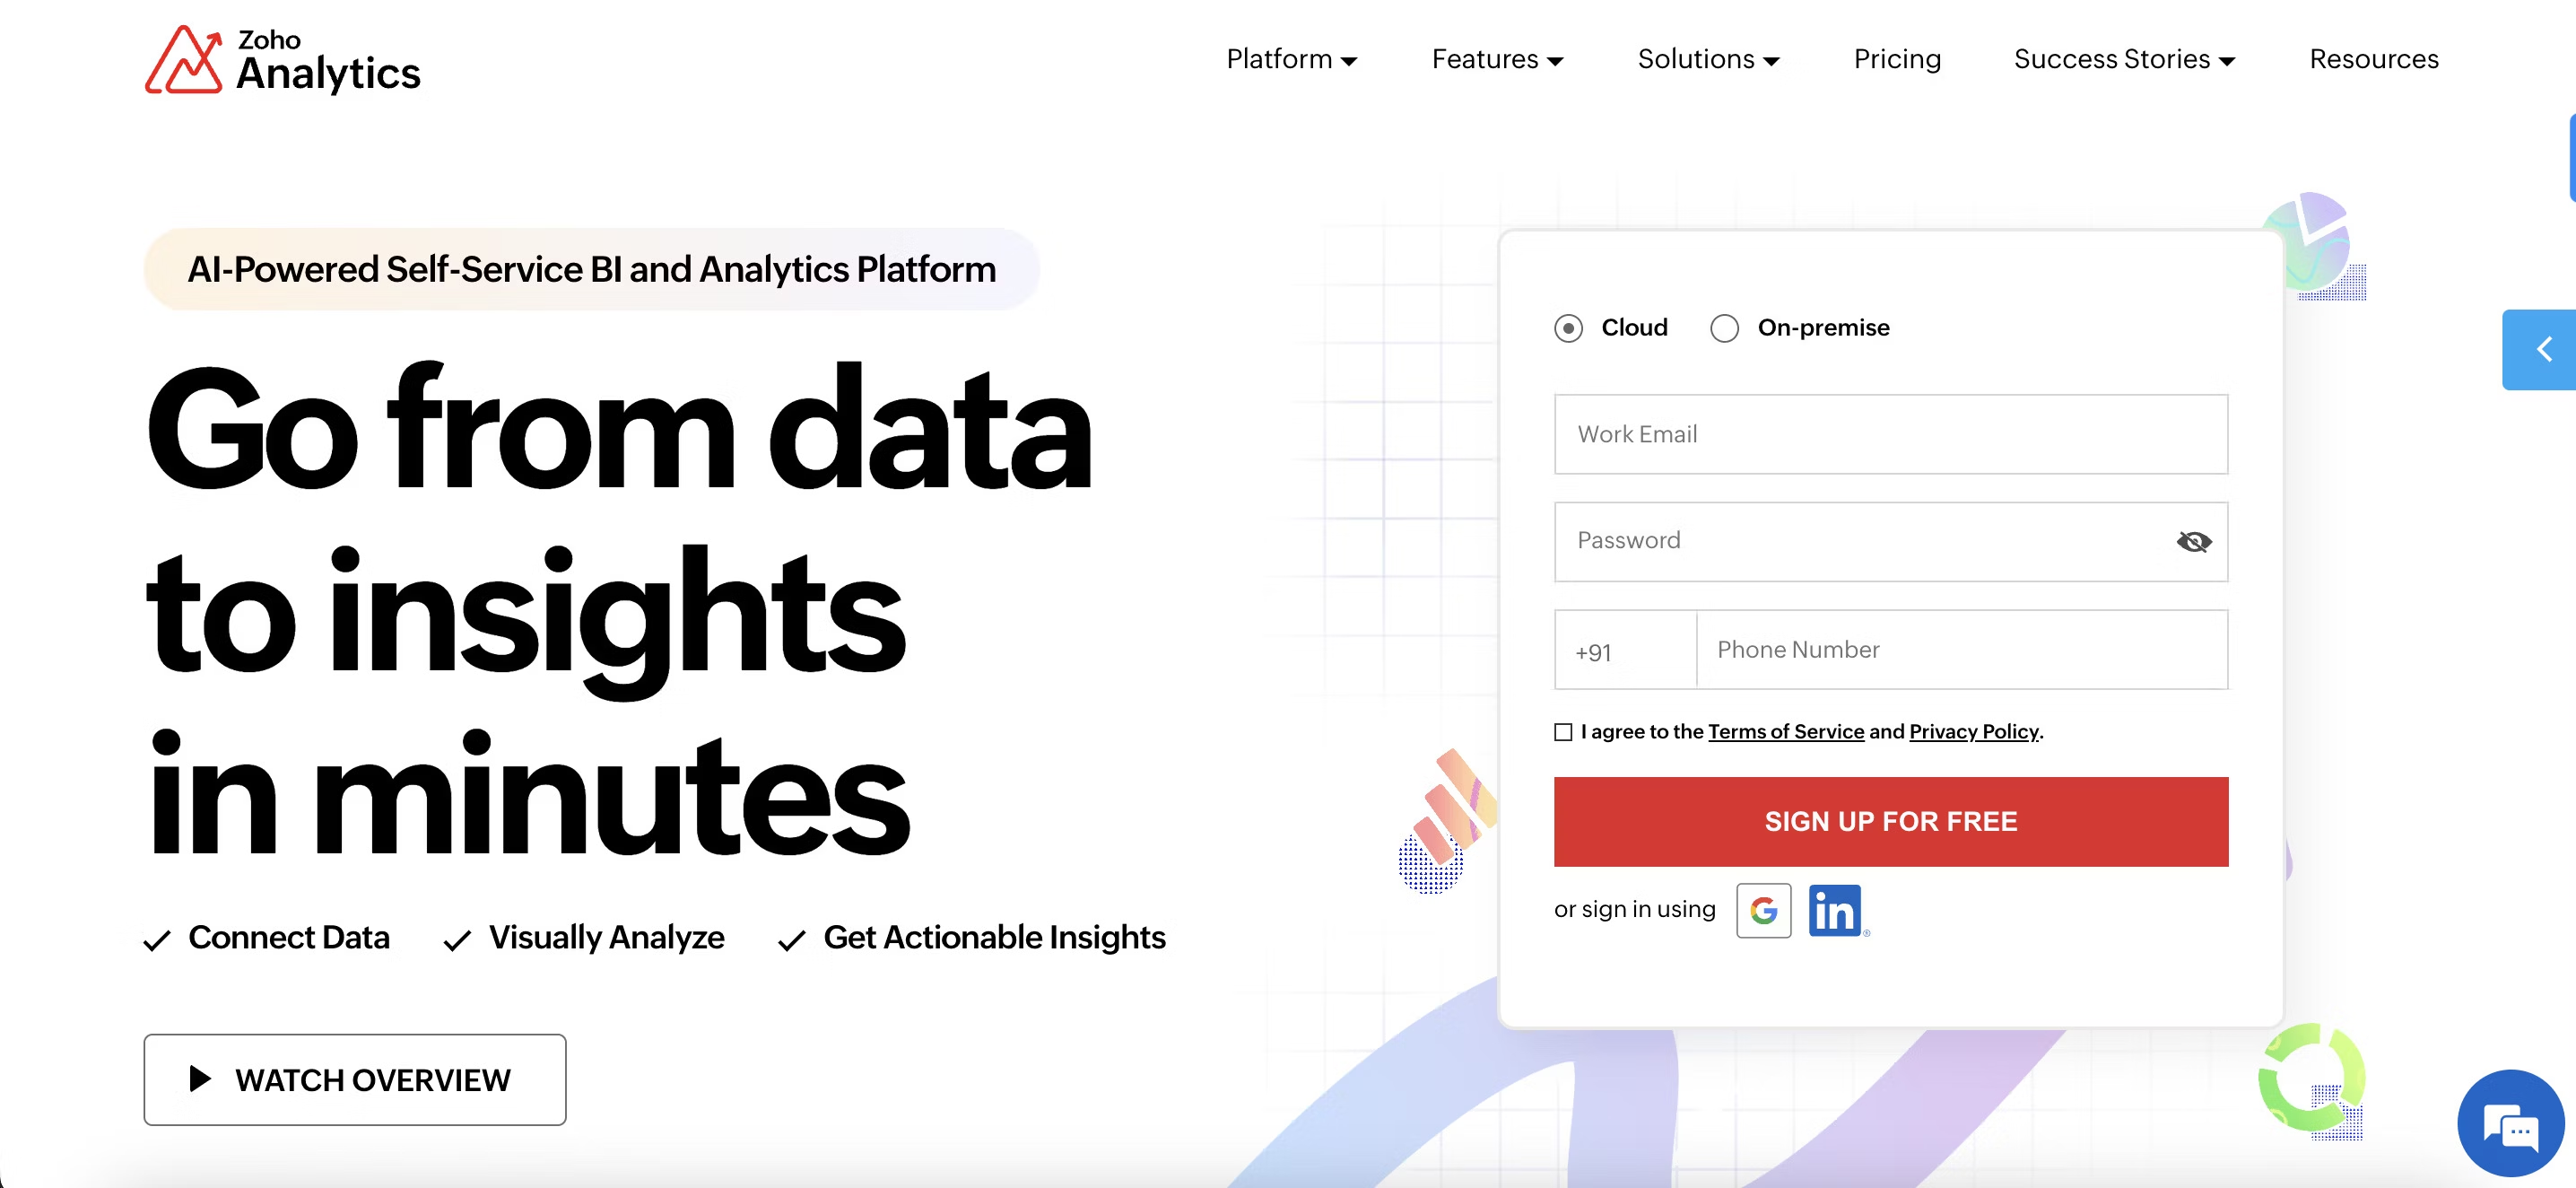
Zoho Analytics is a cloud-based BI platform that helps marketers visualize data using interactive dashboards. With this marketing analytics tool, users can extract insights about their marketing campaigns, forecast data, and create detailed reports. The platform also offers an AI-powered chatbot that lets users ask questions about their data and get answers in the form of KPI reports or visualizations. While Zoho is known for its custom dashboards, it does require a more technical setup which may be difficult for non-technical business users.
Core features
Data visualization: Zoho Analytics offers reporting and visualization capabilities, allowing users to build dynamic dashboards.
Real-time data monitoring: Users can monitor marketing KPIs in real time using different charts and dashboards.
Integration with the Zoho Workspace: Zoho Analytics combines data from multiple sources, including the Zoho Workspace for better analysis.
Zoho Analytics pros
The platform has strong data connectivity and manipulation capabilities enabling users to establish a single source of truth for all their marketing data.
Users can leverage drag-and-drop data elements to build interactive dashboards that display key metrics and insights.
Zoho Analytics offers AI capabilities that allow users to gain insights using natural language queries.
Zoho Analytics cons
While Zoho offers visualization capabilities, customization can be challenging due to the limited options.
From initial set-up to exploring the platform’s functionalities, non-technical users require extensive training to utilize core features and use cases.
Zoho’s scalability can be challenging because of high licensing costs. Plus, access to sophisticated capabilities can quickly add up.
Pricing
Zoho Analytics offers five pricing tiers based on the features you need and how you plan to utilize them. Here is a quick breakdown:
Basic plan—$30 per month: Ideal for individuals or small teams, this plan includes essential features like data analysis, dashboards, and reporting.
Standard plan—$60 per month: Suitable for growing teams that need more advanced functionalities.
Premium plan—$145 per month: Best for larger teams or businesses who want enhanced advanced analytics capabilities.
Enterprise plan—$575 per month: Being the most expensive option, the Enterprise Plan is designed for organizations with complex data requirements.
Custom plan: This flexible offering is for businesses with dedicated server needs or unique requirements.
Free trial: 15-day free trial available
AppsFlyer is a mobile marketing analytics platform that provides comprehensive measurement and insights for app-based businesses. As mobile continues to dominate customer engagement, AppsFlyer helps marketers understand the complete mobile customer journey and optimize mobile marketing investments.
Core features
Mobile attribution tracking: Connect user acquisition to specific marketing campaigns and channels
In-app analytics: Monitor user behavior, retention, and lifetime value within mobile applications
Campaign optimization: Real-time insights to optimize mobile ad spend and improve ROAS
Audience insights: Deep segmentation based on mobile user behavior and engagement patterns
AppsFlyer pros
Industry-leading mobile attribution accuracy
Real-time data processing for immediate optimization
Comprehensive fraud protection for mobile campaigns
Strong integration ecosystem with major ad networks
AppsFlyer cons
Limited to mobile/app marketing (no web analytics)
Can be complex for teams new to mobile attribution
Pricing scales with app volume
Pricing
Zero Plan: Free forever with core features and deep linking
Growth Plan: $0.07 per conversion after 12,000 free conversions
Enterprise Plan: Custom pricing for large-scale operations
Free trial: 12,000 free conversions plus 30-day access to premium features
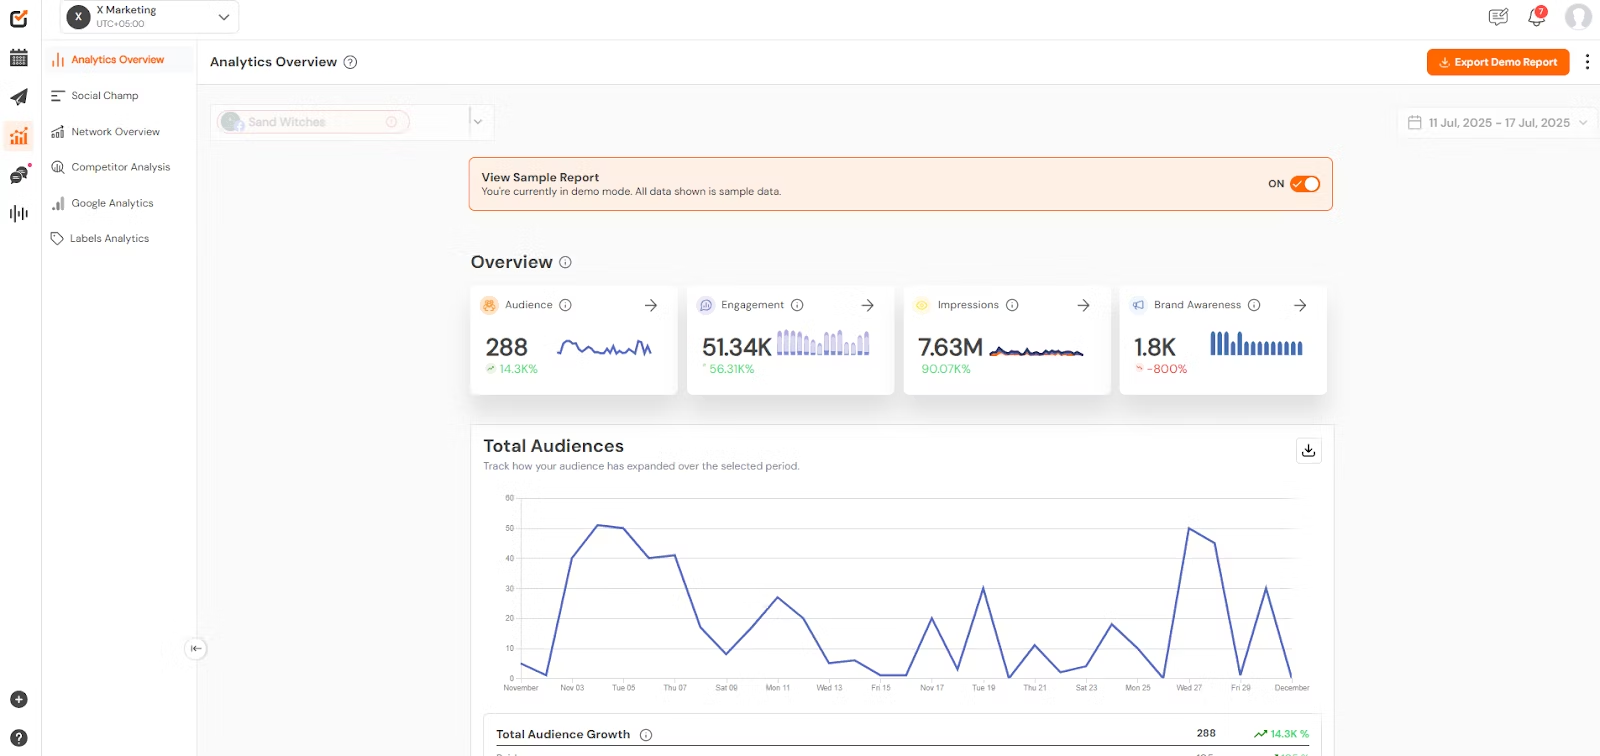
Social Champ is an all-in-one social media management tool that streamlines scheduling, publishing, monitoring, and reporting across platforms. Its analytics features are designed for teams and agencies who want clean, actionable insights without the complexity of enterprise software. With visual performance dashboards, post-level analytics, and export-ready reports, Social Champ helps marketers fine-tune campaigns and prove ROI, all at a highly affordable price.
Core features
Comprehensive social media analytics: Gain in-depth performance insights across all major platforms, including post-level metrics, account and network overviews, and analytics for boosted posts—all with exportable reports in PDF, CSV, or PPT formats for seamless sharing.
Competitor Analysis: Monitor and compare your brand’s performance against competitors on Facebook and Instagram. Available in higher-tier plans with options to track up to 10 or more competitors, depending on your plan.
GA4 integration: Connect directly to Google Analytics 4 to view website traffic and campaign impact alongside social metrics.
Social Champ pros
Clean, visual dashboards make performance tracking easy for non-technical users.
Affordable pricing makes it accessible for startups and small teams.
Long-term metrics storage (up to 2 years) is available in higher-tier plans.
Social Champ cons
Limited analytics for platforms like Twitter and Instagram personal profiles due to API restrictions.
Lacks integration with third-party BI tools like Looker or Tableau for advanced data modeling.
Competitor analysis is only included in premium plans, so users on lower tiers won’t have access to this feature.
Pricing
Social Champ’s analytics are included in its core plans, starting at $4/month, with advanced features like white-labeled reporting and extended metrics storage available in higher tiers.
Free trial: Available
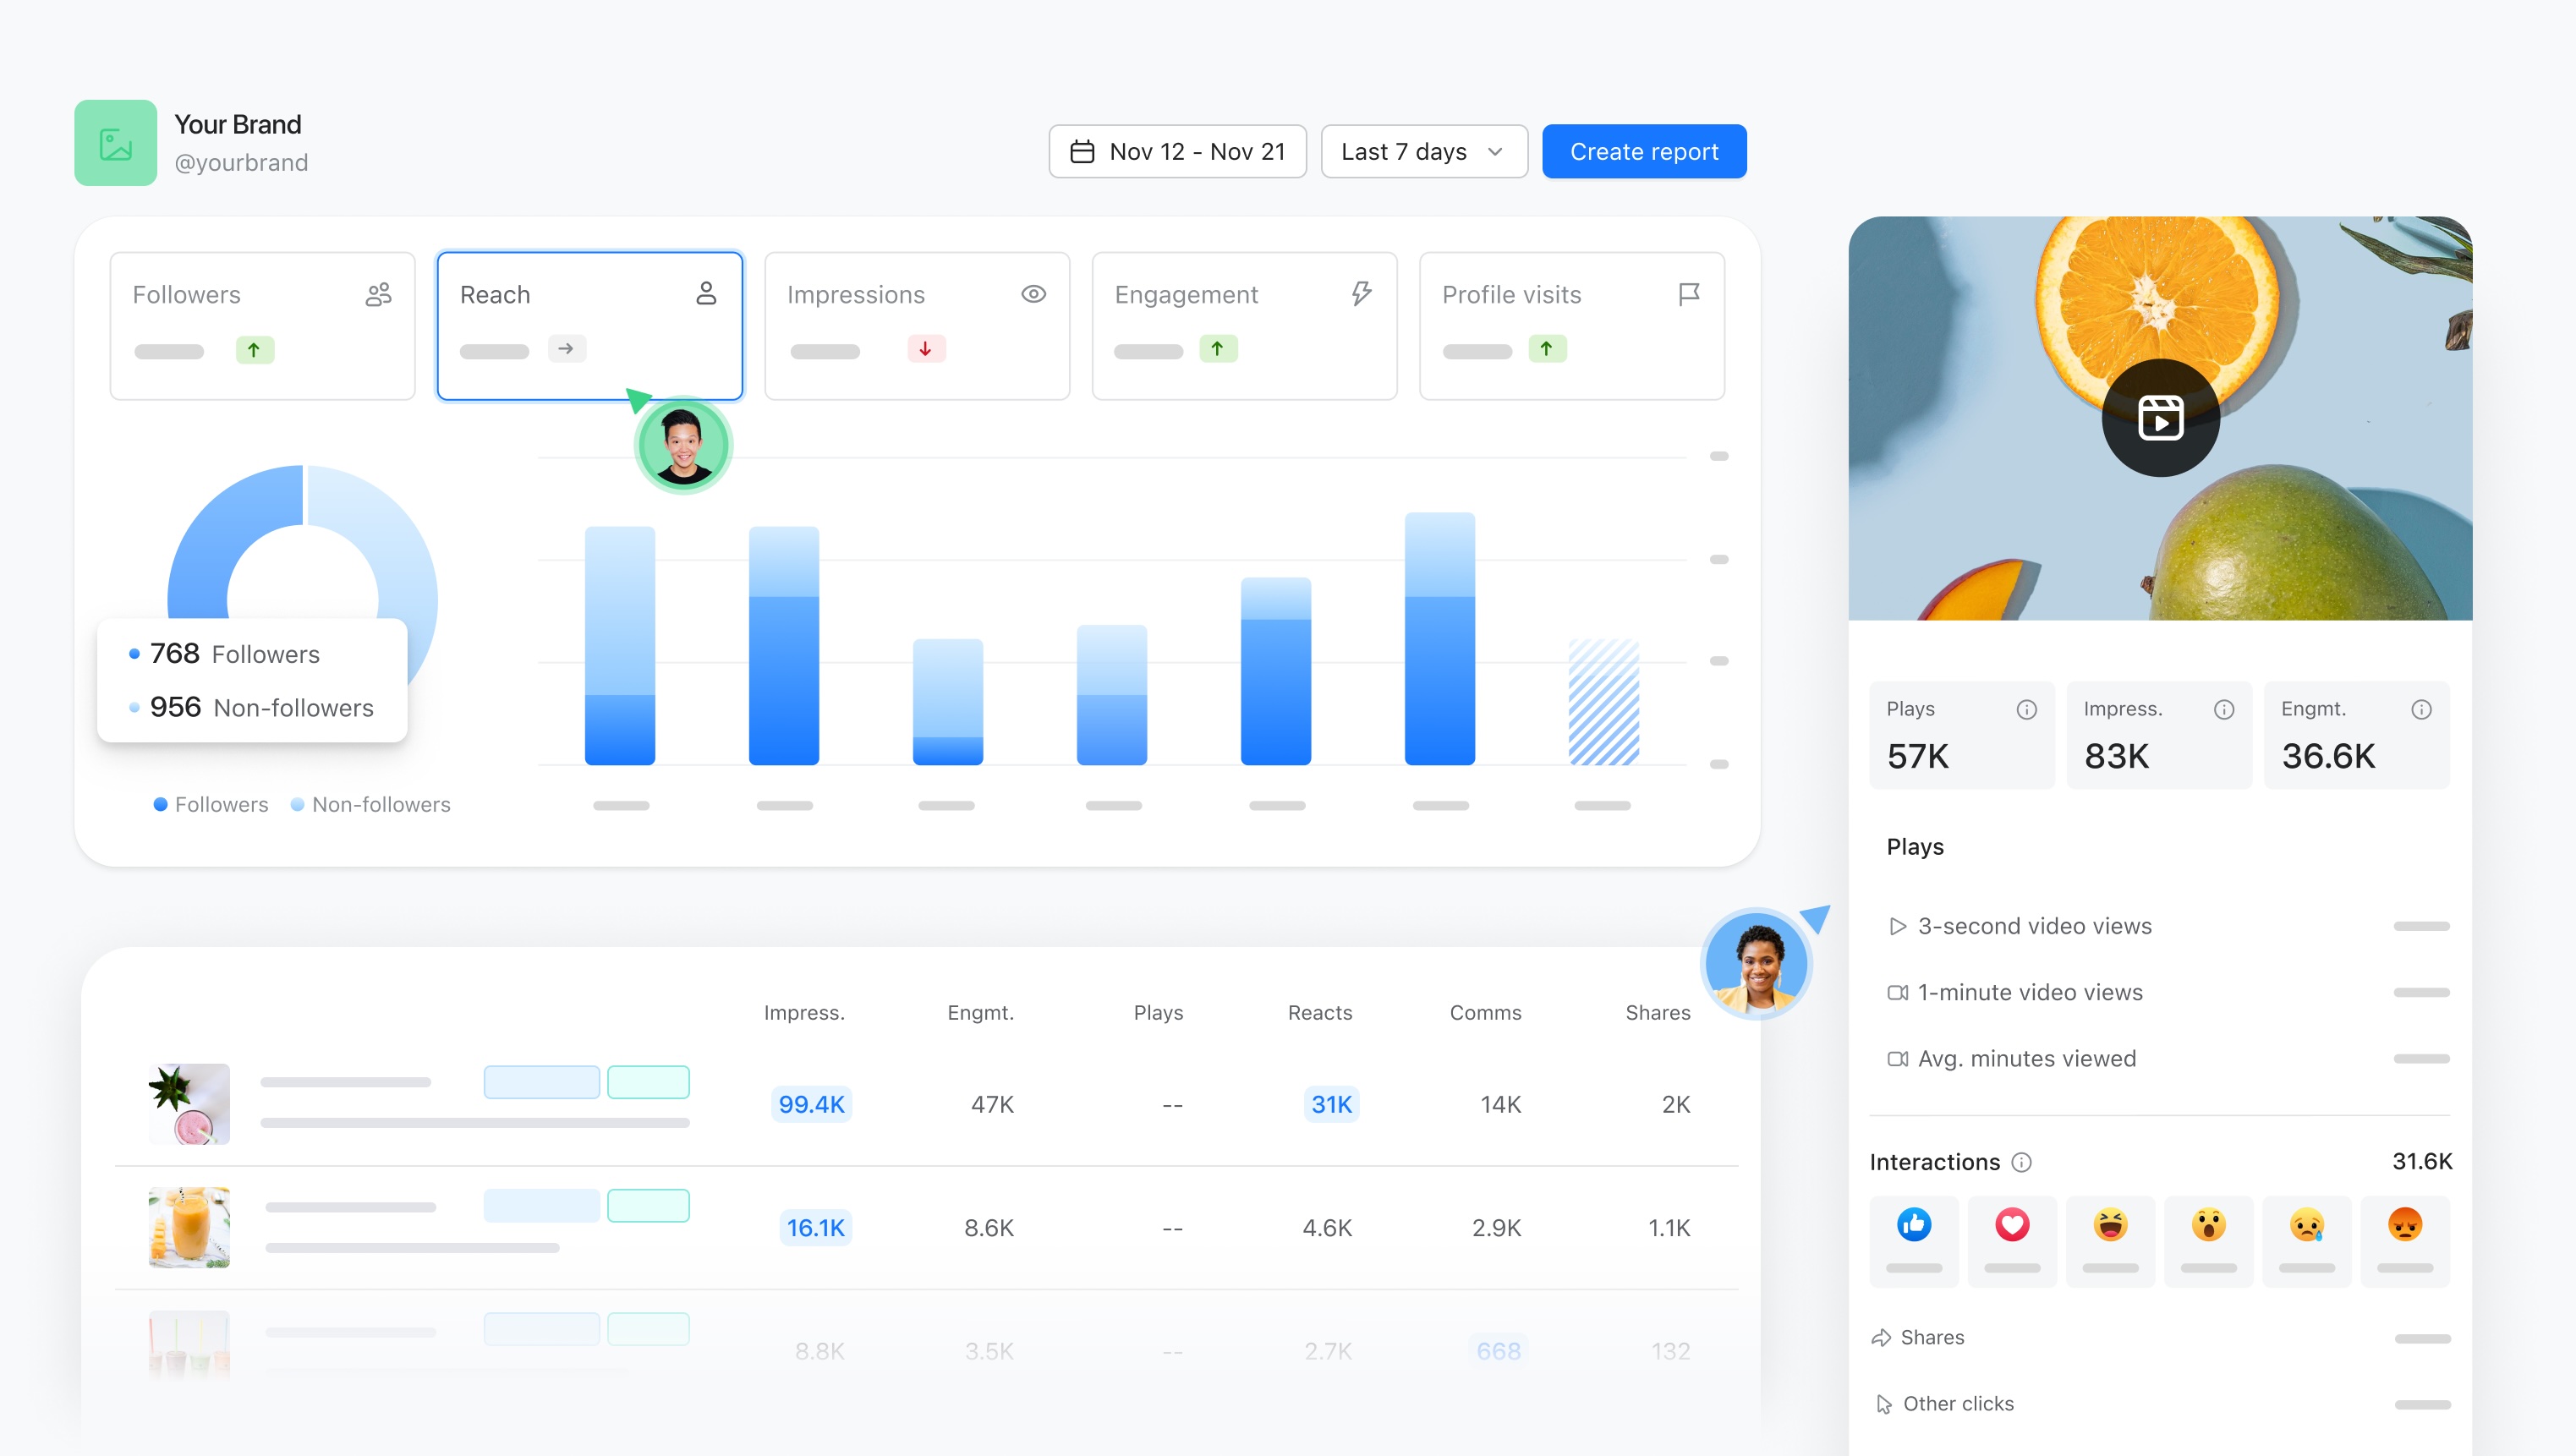
Planable is a social media management tool that allows marketers and social media professionals to collaborate and analyze their content. With its sleek interface and built-in reporting capabilities, Planable simplifies performance tracking across multiple platforms while helping teams refine their content strategy.
Core features
At-a-glance performance overview: Monitor key metrics like number of followers, posts, impressions, engagement, or page visits.
Content performance tracking: Easily identify high-performing content based on relevant engagement metrics, allowing marketers to double down on strategies that resonate.
Post-level insights: Access detailed analytics for individual posts without switching tabs, providing deeper insights in a single click.
Planable pros
The analytics feature offers a clean, user-friendly interface that simplifies social media performance monitoring and reporting
You can create dedicated workspaces for each brand or project to keep things clean and organized
Available for the major social media platforms like YouTube, TikTok, Facebook, Instagram, LinkedIn and Google My Business.
Planable cons
Planable’s analytics focus primarily on social media metrics and may not cover more advanced data modeling or predictive analytics features.
No monitoring features.
No social media listening
Pricing
Planable Analytics has a 7-day free trial and costs $9/month per workspace. It’s available as an add-on for all of Planable’s paid plans (that start at $11/month).
Free trial: Available
Although Looker cannot beat ThoughtSpot’s intuitive chat experience or keep up with Tableau’s data viz library, it does offer data teams a robust semantic layer. This semantic layer provides pre-built controls for managing data modeling and data sharing. This ability gives marketers more confidence in the quality and reliability of their insights. Looker allows integrations with open-source solutions through the Google Cloud Platform, helping data teams create a single source of truth.
Core features
Data modeling: Marketing analysts can model their data using an SQL interface. Looker users can also leverage its semantic layer, LookerML, to perform ad-hoc queries.
Drag-and-drop interface: Looker's intuitive interface makes it easy for users to create interactive dashboards and reports.
Integration with Google Cloud Platform: Being a part of the Google Cloud family, Looker integrates seamlessly with various Google products.
Looker pros
Looker allows enterprise-scale data handling with LookML-driven data governance. It automatically makes changes to the data model and extends it to related reports.
Looker offers a git-integrated version control system that enhances collaboration for technical users.
Looker’s dynamic dashboards allow marketers to visualize customer data and find real-time insights.
Looker cons
While the interface is user-friendly, Looker Studio does have a steep learning curve. Mastering advanced features requires additional training.
For smaller agencies or individual marketers, the free version of Looker Studio might have limitations in terms of data volume and user access.
Performance may suffer with large datasets, impacting user experience.
Pricing
Looker pricing has two important components:
Platform pricing: This cost covers the expenses to run a Looker instance and includes platform administration, integrations, and semantic modeling capabilities.
User pricing: This individual user licensing includes the cost to access the Looker platform. The overall cost will vary based on the type of user and their permissions within the Looker platform.
It’s recommended you contact Looker’s team directly for accurate pricing estimates.
Free trial: Available
💡Relevant read: Looker vs Power BI
Power BI is Microsoft’s data analytics platform that allows marketers to capture and analyze data related to various marketing activities. This marketing analytics software can compile data from sources like websites, mobile apps, and online campaigns to help users gauge the effectiveness of their campaigns and create strategies to optimize them. Power BI also includes features such as dashboard building, data modeling, and report sharing.
Core features
Custom visualizations: This marketing analytics platform features a variety of data visualization options, from basic charts to interactive maps. With drag-and-drop functionality, users can easily create custom visualizations and dashboard layouts.
Microsoft Copilot (AI feature): Copilot offers marketers AI-generated insights that help them identify trends, patterns, and anomalies, supporting the decision-making process.
Predictive analytics: Power BI users can analyze data and build predictive analytics models to anticipate future outcomes.
Power BI pros
Power BI seamlessly integrates with other Microsoft products such as Excel, Azure, and SharePoint.
Power BI users can share dashboards, reports, and insights with other licensed viewers through OneDrive and Microsoft Teams.
The drag-and-drop interface allows non-technical users to comb through complex customer information and generate interactive visualizations.
Power BI cons
Microsoft’s Power BI service runs only in Azure. This limitation makes it difficult to connect with external databases or third-party applications.
Power BI licensing costs can quickly escalate, especially when adding advanced functionalities to the mix.
Users have reported slower performance when dealing with large datasets or complex queries.
Pricing
Power BI offers four pricing models based on features users want:
Power BI free plan: This free individual plan allows you to access Power BI on your desktop and create dashboards and reports.
Power BI Pro—$10.00 user/month: For those who already hold Microsoft 365 E5 and Office 365 E5 accounts, this plan is available at no extra cost. The Pro plan is best suited for small organizations with dedicated data teams.
Power BI Premium Per User—$20.00 user/month: Mid-sized companies and enterprises opt for this plan. Although the Premium plan allows more frequent data refreshes, user access is still limited.
Power BI embedded—custom pricing: Organizations wanting to embed Power BI capabilities such as data visualization and analytics into their applications can opt for this plan.
Free trial available
💡Relevant read: Top Power BI alternatives and competitors to consider
Real-time data analysis: In today’s fast-paced business environment, data is only valuable when it can guide actionable decisions. AI-powered marketing analytics tools enable businesses to gather immediate insights into operations, customer behavior, and market trends, transforming raw data into actionable intelligence. The ability to access real-time insights empowers businesses to respond to emerging market conditions, optimize customer interactions, and fine-tune their marketing strategies on the fly.
Better understanding of customer behavior: Modern marketing analytics tools offer businesses a robust, 360-degree view of customer data. With real-time visualizations and advanced analytics, you can take a closer look at customer journeys and patterns, identifying opportunities to create personalized journeys that drive loyalty. For instance, take Northmill. By leveraging ThoughtSpot, the company was able to analyze its users' data and find insights that could have remained hidden. Such insights helped the company personalize its banking experience, boosting conversion rates by a staggering 30%.
Predicting future trends: Augmented marketing analytics solutions leverage advanced machine learning algorithms to analyze vast amounts of data and forecast outcomes. By utilizing predictive analytics, marketers can forecast future trends in customer behavior, anticipate shifts in competitive positioning, and identify new opportunities for campaign optimization. With these insights, you can tailor relevant content, create targeted ads, and even send personalized product recommendations to increase engagement.
Cost optimization: By analyzing customer data, you can target the right audience, identify underperforming campaigns, and pinpoint less efficient channels. This in-depth analysis helps you optimize your campaigns, ensuring marketing dollars are spent reaching the right people with the right messages.
Collaboration across teams: With easy-to-understand dashboards and detailed reporting, marketers can create engaging data stories that showcase their findings and build a strong marketing narrative. These contextual data stories foster cross-functional collaboration, ensuring that everyone from marketing to product development is on the same page, leading to more unified business decisions.
Driving impact, optimizing spend, and aligning marketing strategy with business goals are key priorities for marketing leaders. However, achieving these goals requires actionable insights. With so many vendors offering AI-powered tools, it’s crucial to evaluate which features can derive the most value for your business. Here are some key factors to consider:
Intuitive interface: The simpler and more intuitive the interface, the easier it is for users to interact with data. A well-designed user interface ensures that your marketing team can quickly create visualizations, access key metrics, identify trends, and share insights—without relying on data teams.
Scalability: As your business grows, your data needs will evolve. A scalable marketing analytics solution can handle increasing volumes of data, more users, and more complex reporting requirements without compromising performance. Whether you’re expanding your customer base or launching new campaigns, scalability ensures that your analytics capabilities can keep up with changing customer needs.
Compatibility with AI technologies: Marketing analytics tools aren’t limited to running ad-hoc queries and creating visualizations. AI-powered marketing analytics solutions offer capabilities like natural language search and machine learning to help marketers get into the nitty-gritty of customer data and find valuable insights. Choosing such a solution empowers your entire marketing team to highlight critical data points, spot anomalies, and forecast outcomes for faster decision-making.
Data governance and security: Protecting sensitive customer data and ensuring compliance with privacy regulations is a must. A robust data governance and security framework ensures that only authorized users have access to critical marketing insights and that all data is stored and handled securely. Look for features like role-based access control, encryption, and audit logs to safeguard your data and minimize the risk of breaches.
Marketing analytics gives you the insights you need to build a pipeline, maximize investments, and improve your bottom line. With ThoughtSpot, you are bringing together all your sales, marketing, and customer data into a single, actionable source of truth so every marketer can understand the past, inform the present, and plan for the future.
Unlock the value of your marketing data—schedule a demo today.
What are some use cases for marketing analytics software?
Marketing analytics platforms offer a wide range of use cases that empower marketers with the insights they need to drive better results. Here are some common ones:
Customer Segmentation: Marketing analytics software allows teams to segment their customer base into specific groups based on behavior, demographics, purchase history, and engagement patterns.
Forecasting trends: AI-powered marketing analytics tools can predict future customer behavior based on historical data, enabling demand-gen teams to anticipate trends, forecast sales, or identify high-value leads
Social media analytics: By leveraging the right analytics software, teams can track social media metrics (likes, shares, mentions) and perform sentiment analysis to measure brand awareness and reputation.
Campaign performance analysis: Marketing teams can help track and measure the success of various marketing campaigns, from email to social media and paid ads
Customer journey mapping: By consolidating data across multiple touchpoints including website visits, social media interactions, and Google ads, marketers can visualize their entire customer data landscape and map customer journeys.
What is the best tool for marketing analytics?
While there are many marketing analytics platforms available, as per Gartner’s 2024 MQ, ThoughtSpot stands out as a true leader in business intelligence (BI). With powerful augmented analytics features and an AI-driven search experience, ThoughtSpot stands out by enabling users to explore data on their own terms. Whether you want to visualize customer data or analyze campaign performance, ThoughtSpot’s AI-Powered Analytics uncovers insights that would’ve otherwise remained hidden.
How can mid-size to large enterprises find the right marketing analytics tools?
Finding the right marketing analytics solution starts by clearly defining your business objectives and understanding your team’s specific data needs. This process entails assessing your current analytics systems and evaluating potential solutions based on features, scalability, user experience, support, and compliance. See how leaders are adopting GenAI to make a real difference in their business.


