


At its core, every company is a collection of decisions—big and small. But too often, those decisions fall into one of two traps: relying on gut instincts or getting lost in a flood of overwhelming data. And to be honest, neither approach sets you up for success.
That’s why today’s most successful organizations use data to drive their decision-making. In my decade as a product marketer, one lesson stands out above all others: the true marker of a successful company isn’t just its product or market fit—it’s how well it fosters a data-driven culture. Without it, teams lack the foundation to make informed decisions, and over time, curiosity and competitive edge fade.
Data-driven decision-making isn’t just about knowing what’s happening in your business—it’s about uncovering the "why" behind it. By understanding the 'why,' data-driven decision-making helps you cut through the noise, focus on what matters most, and make decisions you can stand behind.
Table of contents:
Data-driven decision-making is the process of using facts, metrics, and insights gleaned from data to inform key business decisions. It involves leveraging different technologies and tools, such as data analytics platforms and business intelligence (BI) tools to collect, analyze and interpret data. This approach allows businesses to uncover patterns, trends, and correlations that provide a clearer understanding of performance, customer behavior, and market dynamics.
1. Objective decision-making
By relying on data and analysis, business leaders can make decisions rooted in facts, not influenced by personal biases or opinions. With this objective approach, you gain a holistic view of past and ongoing efforts, allowing you to refine strategies and reduce the risk of costly mistakes. Most importantly, with data as the foundation, you can foster a culture of transparency and accountability.
This was the case for Schneider Electric. By adopting ThoughtSpot, an AI-powered BI solution, the company was able to democratize data for all. With ThoughtSpot, anyone at Schneider Electric—whether they’re a quality manager or a customer experience executive—can explore data without jumping through any hoops. With every worker having instant insights at their fingertips, Schneider cultivated a data-driven culture that empowered all users to engage in analytics—fueling a competitive edge across 100 countries.
2. Enhanced customer experience
McKinsey research shows that 71% of customers expect brands to deliver personalized interactions. This is a powerful reminder that you need actionable insights into customer journeys—not just gut feelings or baseless assumptions. By putting data at the center of your decision-making, you can understand your entire customer funnel, from their behaviors to preferences. Doing so also allows you to identify cross-sell and up-sell opportunities, reduce churn, and even increase customer lifetime value.
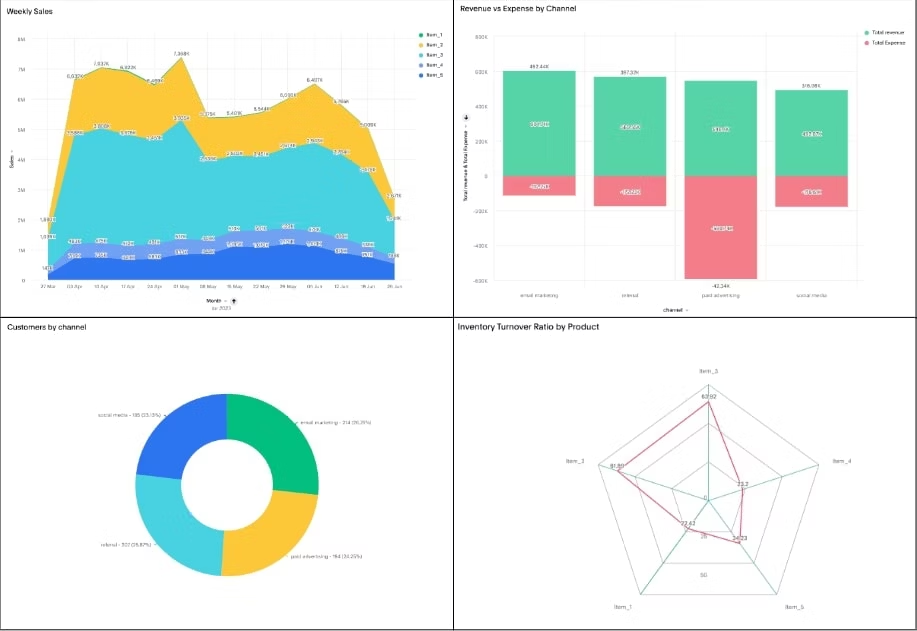
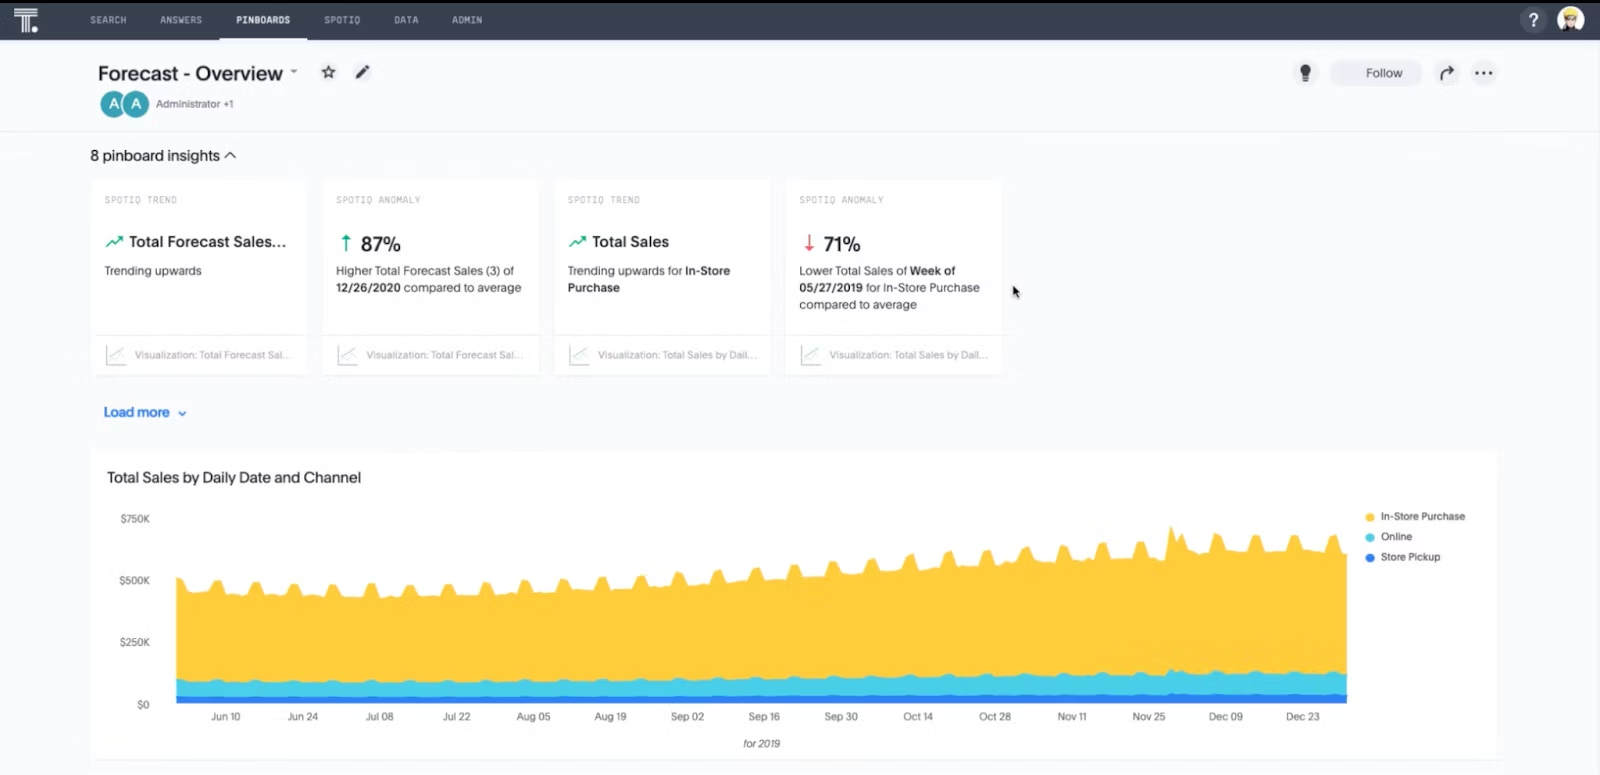
For example, consider this retail analytics dashboard. By analyzing metrics such as purchase patterns, sales performance, and customer feedback sentiment, you get timely insights into customer behavior, which in turn, helps you create positive interactions at every touchpoint.
3. Improved profitability
Research shows companies that embrace data-driven decision-making can see an impressive revenue boost of 10-30%. By turning complex data into intuitive visualizations like charts, bars, and graphs, you can gain real-time updates on end-to-end business performance. This clarity allows you to make smarter decisions about resource allocation and pinpoint areas for improvement, ultimately driving a better ROI and giving your business the edge it needs to thrive.
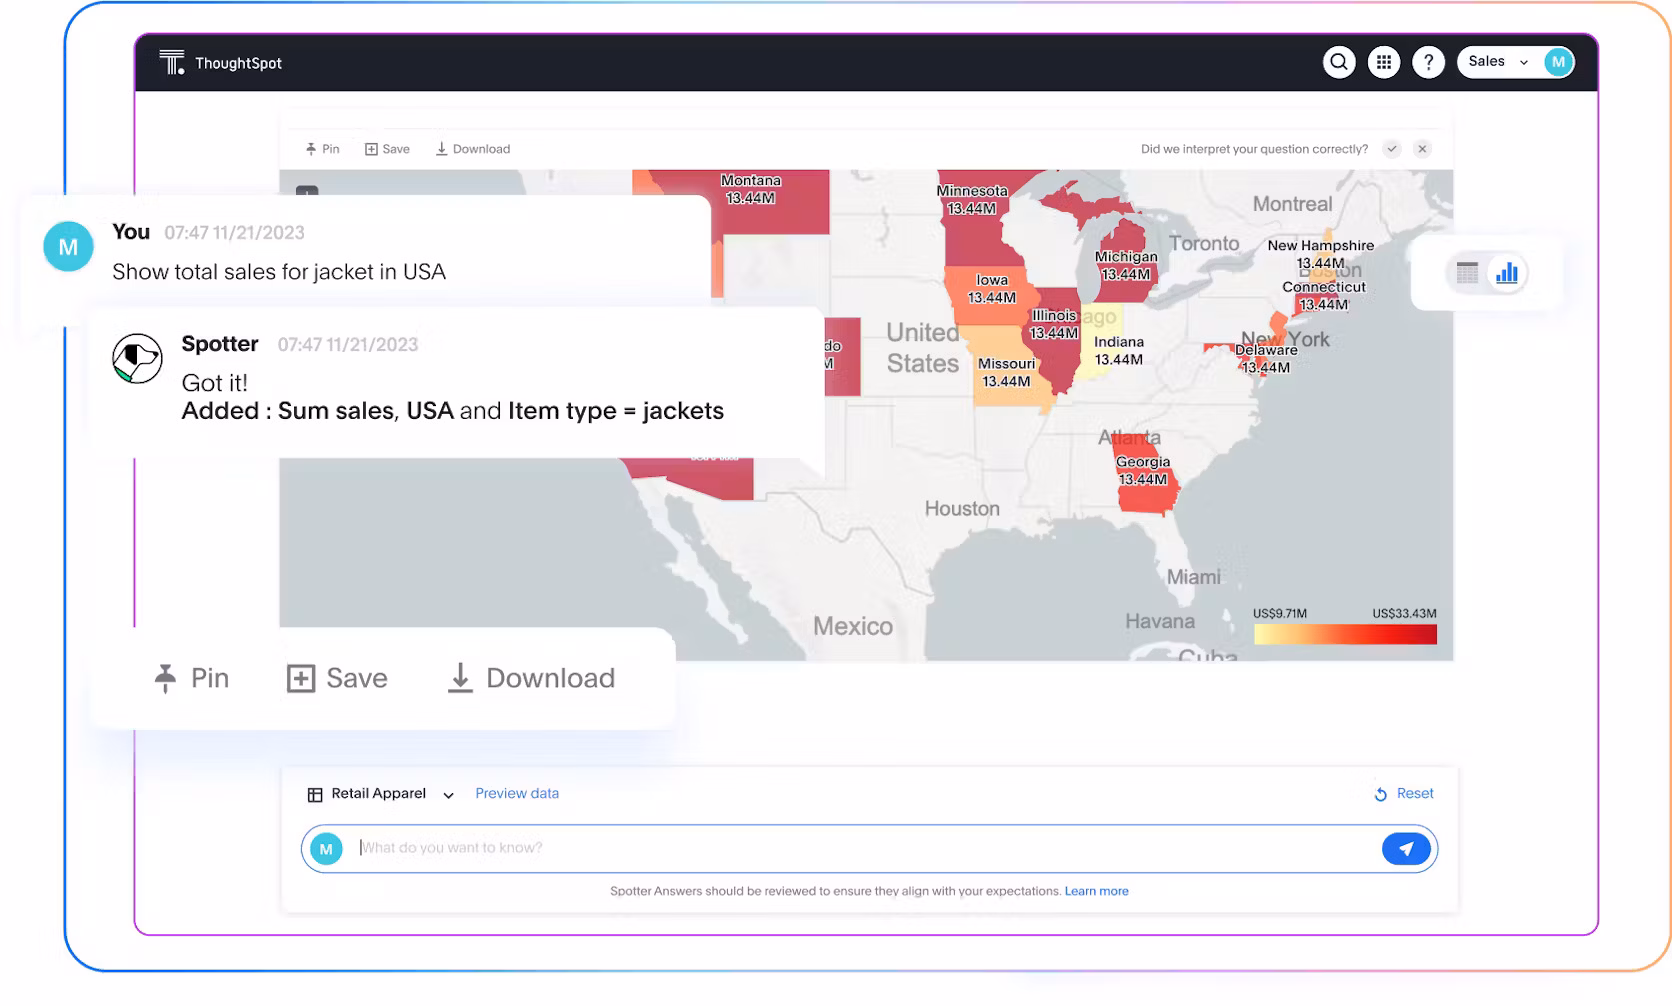
Take the Liveboard example below. Say you want to analyze which product drove the highest sales this quarter and understand which factors affect performance. With Spotter, ThoughtSpot’s AI Analyst, you can ask questions in natural language and receive insights within seconds. Once you have these actionable insights, you can share them seamlessly across your organization, fueling smarter, data-driven decisions.
4. Proactive business management
Data-driven decision-making can give you an edge over your competitors. By using data more proactively, you can better understand market conditions, respond to emerging trends, and identify opportunities their competitors may miss. With this agility, you can not only streamline operations but also boost customer satisfaction in a crowded marketplace.
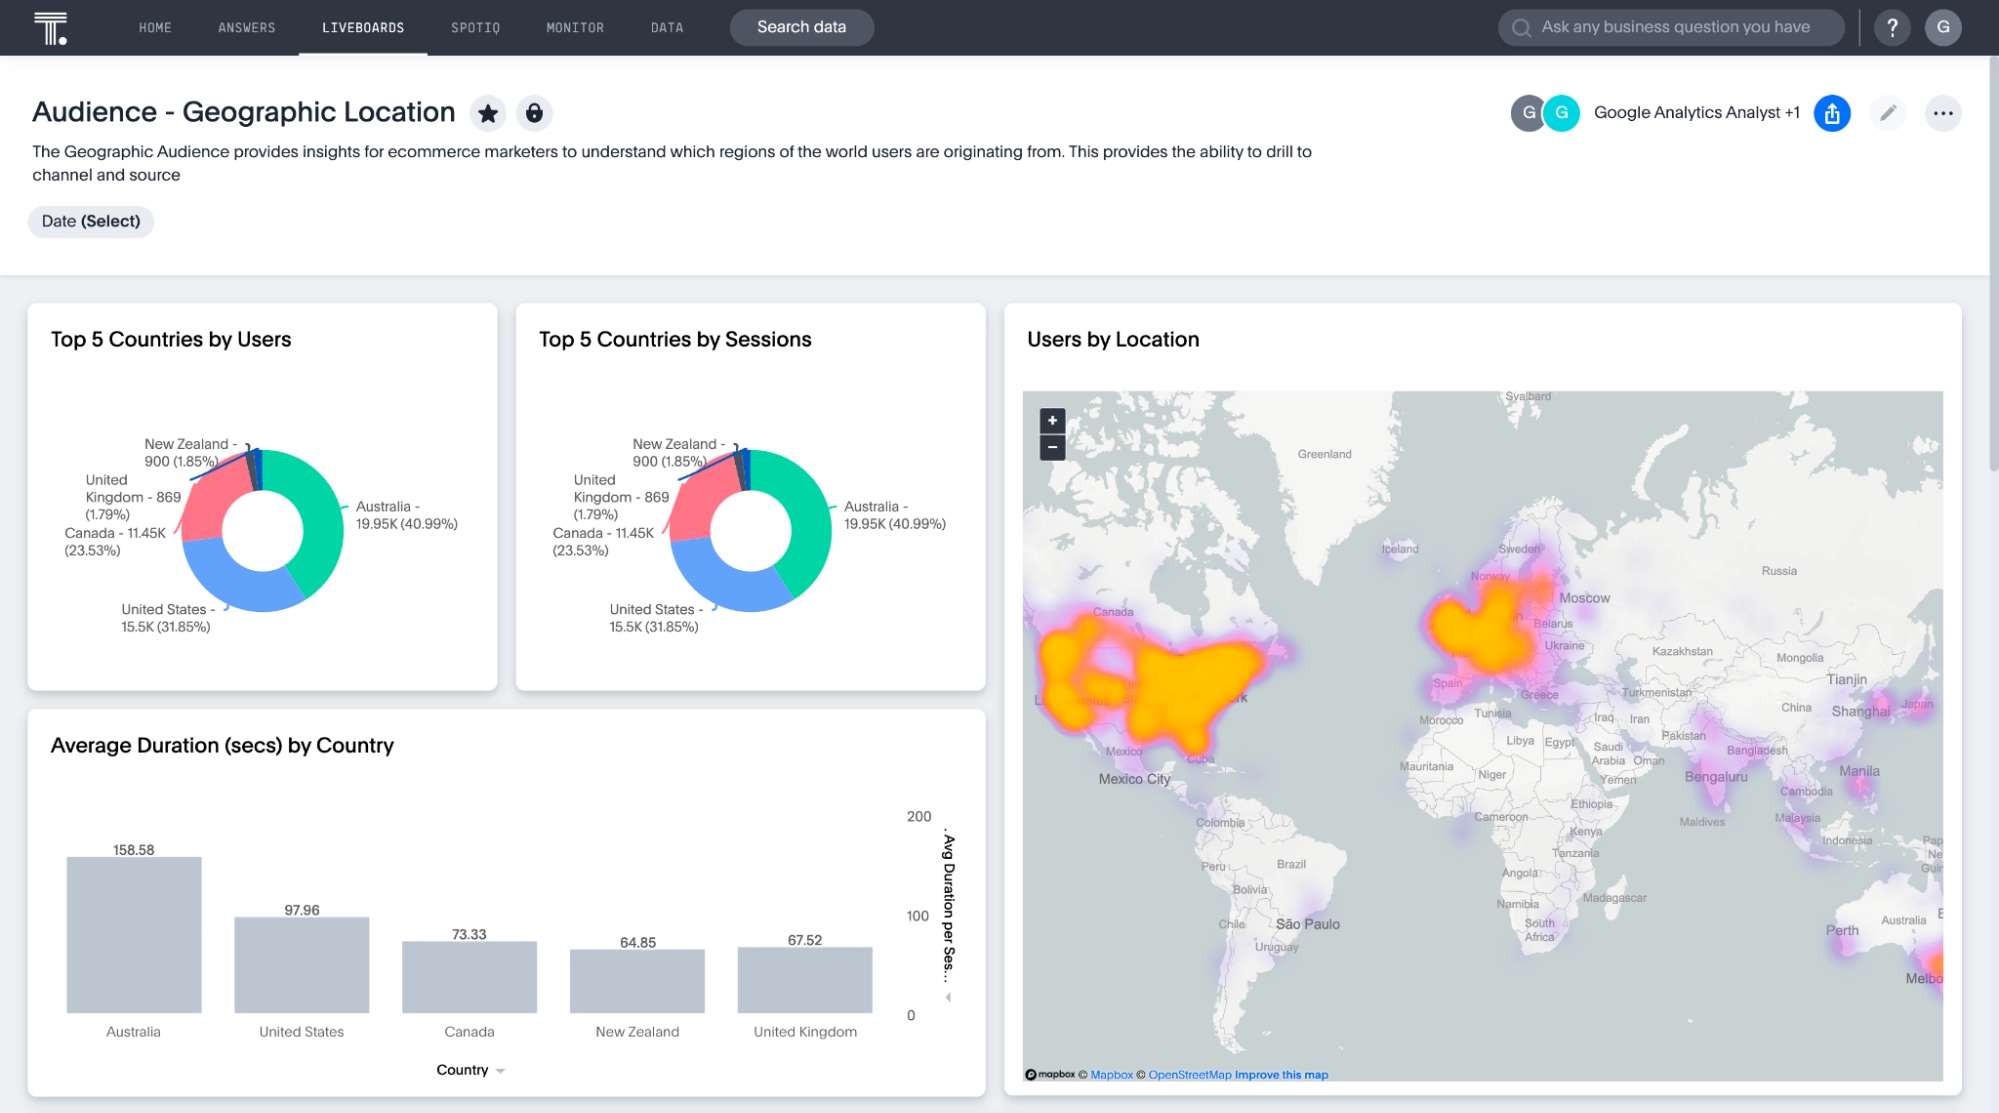
Picture this: you’re a retailer, using an e-commerce dashboard to forecast sales performance. Using this predictive capability, you can stock up on popular items before peak seasons, reduce excess inventory of less popular items, and ultimately enhance customer satisfaction by ensuring that products are available when customers want them.
Building an organization that can reap the rewards of data-driven decisions requires a mix of people, processes, technology, and often change management. The most successful companies implement self-service analytics as part of this change. In a nutshell, the process of data-driven decision-making consists of five steps:
Step 1: Define the problem
Every data project is really a business project. That’s why before you make any decisions, you need to truly comprehend the problem at hand. To do this, you need to define your goals and identify the context of the situation you’re looking to address. This step typically involves taking a close look at current challenges, gathering insights from key stakeholders, and pinpointing the specific outcomes you're hoping to achieve.
Step 2: Collect relevant data
Once you’ve defined your problem, the next step is to collect the relevant data and organize it. This involves gathering data from both internal and external sources like customer surveys, industry reports, market research, and historical trends. Your goal is to collect enough data, augment it, and organize it to identify patterns and trends that could help inform the decision.
Step 3: Analyze the data
Once you've collected the relevant data, the real work begins: analyzing it to find actionable insights that drive immediate, informed decisions. To do this effectively, you need to leverage a self-service BI solution like ThoughtSpot.
With ThoughtSpot, data exploration becomes as intuitive and engaging as talking to an analyst colleague. You can simply ask questions in natural language, drill into insights, and create your own visualizations to discover anomalies, trends, and hidden insights. This capability alone can change how your users interact and analyze their data, driving fruitful results for your business.
Step 4: Develop an action plan
Once the analysis is complete, you’re ready to create an action plan. This involves using your data analysis to create strategies for how to solve the problem, setting achievable goals and objectives, and establishing a timeline for when all activities should be completed.
For instance, say you’re a marketing manager and your analysis reveals your campaigns are underperforming because of misaligned targeting. Your plan might have steps that involve refining the messaging or even launching an entirely new campaign with more precise targeting. You can also set clear, achievable goals, like boosting the conversion rate by 15% in the next quarter. You could also create a detailed timeline with specific milestones—like conducting A/B testing on different ad creatives within the next two weeks, followed by a deeper analysis of audience response.
Step 5: Evaluate the results
Let’s continue with our above example: after implementing your action plan, you can evaluate the success of your marketing campaign by analyzing key metrics such as conversion rate, click-through rate, and customer engagement. By comparing these KPIs against your set goals, you can determine whether your action plan has delivered the desired impact.
By constantly evaluating and learning from your results, you’re not just improving your current project—you’re setting your team and organization up for smarter, more informed decision-making in the future.
As a product marketer, I’ve seen firsthand how using the right type of analytics can play a pivotal role in driving data-driven decisions. For instance, we rely on both descriptive and prescriptive analytics to analyze customer trends to decide the best course of action for optimizing ThoughtSpot’s pricing strategies. Each technique serves a unique purpose, ensuring that our decisions are well-informed and strategically sound. That said, here’s a brief overview to help you understand how each technique works:
Descriptive analytics: Descriptive analytics focuses on summarizing past data to understand what happened, It provides you with a clear picture of historical trends, offering insights that may help you evaluate past performance. Think of it as the foundation of data storytelling, giving you a solid grasp of how they got to where they are today.
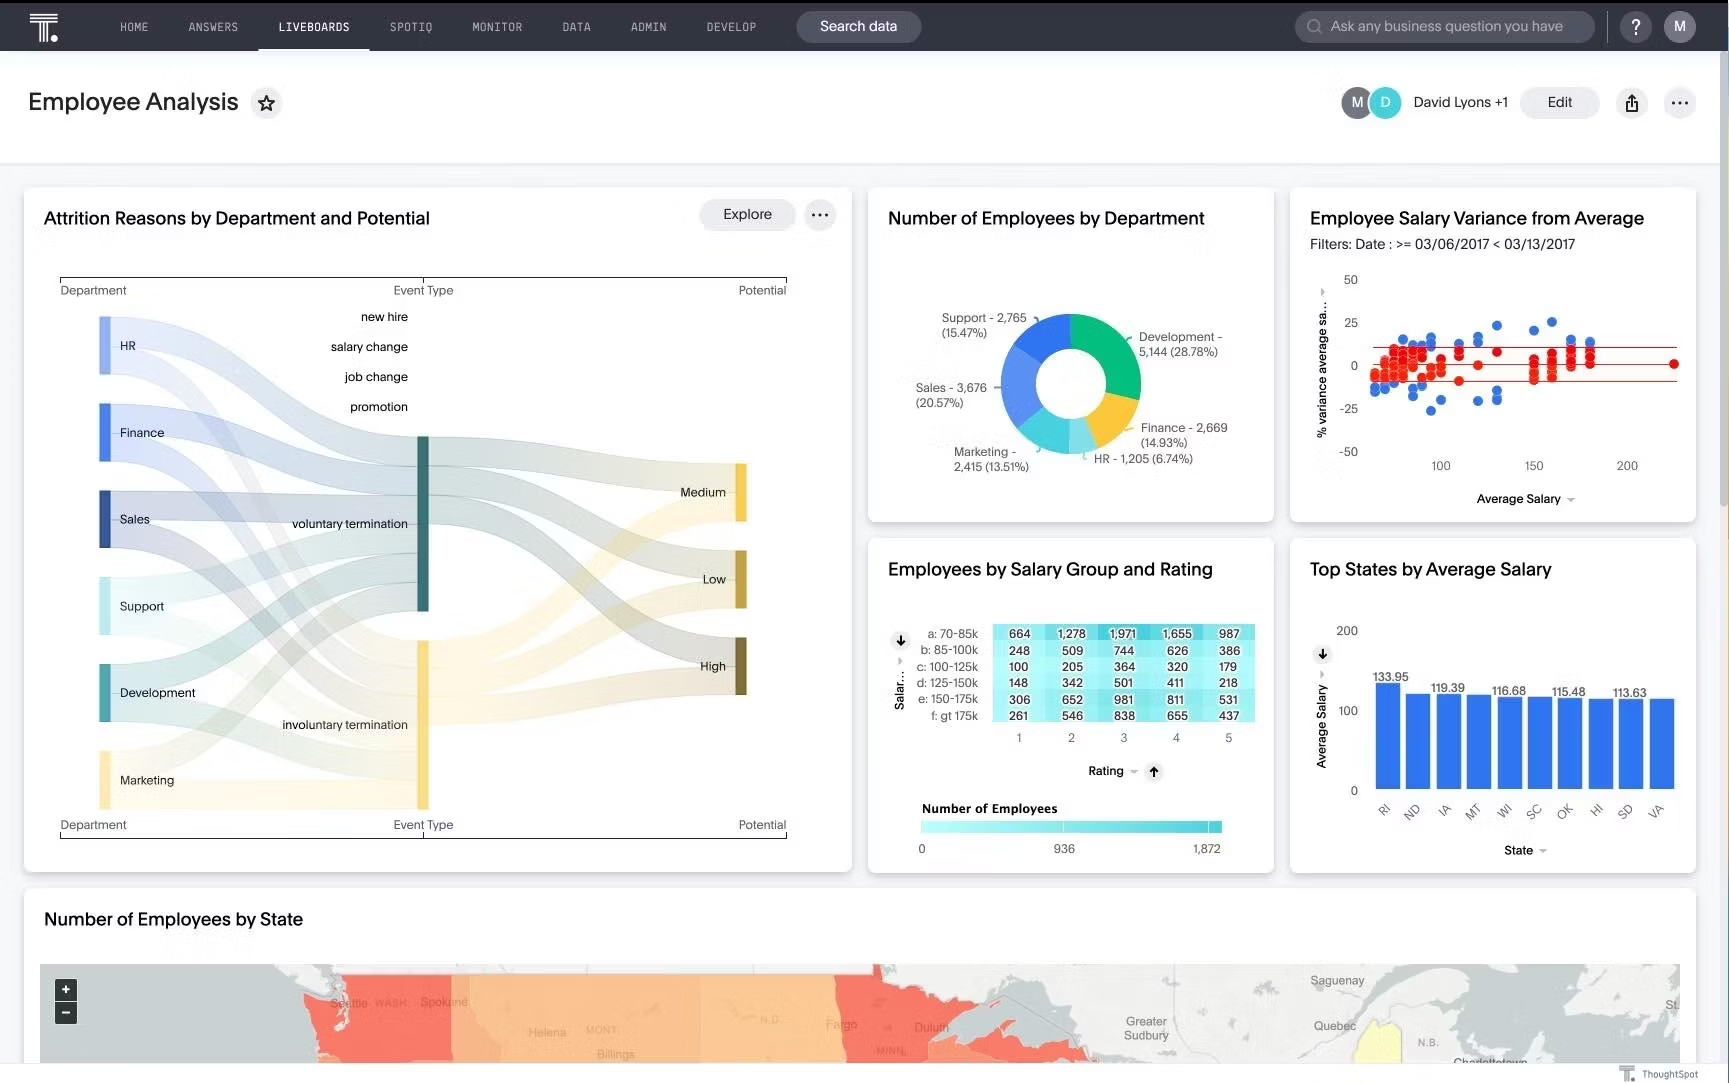
Diagnostic analytics: Diagnostic analytics takes it a step further by asking why something happened, allowing you to dig deeper into your data to uncover the root causes behind past trends. Whether it’s identifying why there is a greater attrition rate among employees or why a marketing campaign fell short, this analysis helps you identify key drivers and understand the underlying factors that influence outcomes.
Predictive analytics: Predictive analytics goes beyond understanding the past and aims to forecast future events based on historical data. This technique uses statistical models and machine learning algorithms to anticipate trends and predict potential risks, allowing you to plan better for what's to come.
Prescriptive analytics: Prescriptive analytics offers actionable recommendations on what steps to take next. This technique uses machine learning and advanced algorithms to analyze large volumes of data and identify hidden data patterns and potential outcomes. You can use this approach to explore different action plans and see how each of your decisions translates to action. Backed by real-time insights, it suggests different action plans, showing how the implications of each action can impact your decision.
1. Financial industry
With financial analytics, leaders can manage their entire revenue cycle, from customer onboarding to wealth management and investment strategies. This data empowers financial institutions to create targeted strategies for marketing, offering personalized financial products, optimizing service delivery, and efficiently allocating resources across departments.
Imagine you're a finance manager looking to improve your client’s portfolio. By analyzing historical data and market trends, you can identify high-performing assets tailored to your client’s goals. You might uncover opportunities to diversify their holdings or refine their investment strategy to align with their risk tolerance. This data-driven approach builds trust while delivering measurable value for your clients.
2. Healthcare industry
Every day, healthcare providers collect troves of sensitive information, but much of this valuable information remains trapped under siloed CRM systems. Healthcare analytics can unlock this wealth of insights for healthcare providers, helping them optimize patient care and boost operational efficiency. By analyzing patient data, providers can pinpoint recurring health patterns, predict disease symptoms, and personalize treatment plans based on individual needs—leading to better patient outcomes and more efficient use of resources.
Consider this example. Traditionally, patient information has been dispersed across various departments, making it difficult for providers to get a comprehensive view of a patient's health. However, with a modern BI solution, you can create a single source of truth to understand the patient count over the past few years. This information is crucial for pinpointing operational inefficiencies and creating preventive care programs for better patient care.
3. Telecom industry
Having a robust subscriber base is great, but providing quality customer service requires telecom providers to analyze customer usage at a granular level. With telecom business dashboards, you can visualize crucial customer data, including call drop data, signal strength, and network latency, to identify areas with poor coverage or network congestion. This data-driven approach enables you to schedule preventive maintenance activities, ensuring uninterrupted service for your customers.
4. Manufacturing industry
The manufacturing industry is characterized by complex processes and high-volume operations—be it production, sourcing, or inventory management. To streamline and optimize such processes, manufacturers need a bird’s-eye view of your manufacturing data. With interactive Liveboards and powerful AI analytics capabilities, manufacturers can gain real-time insights into every stage of the manufacturing cycle, from raw material procurement to finished goods delivery.
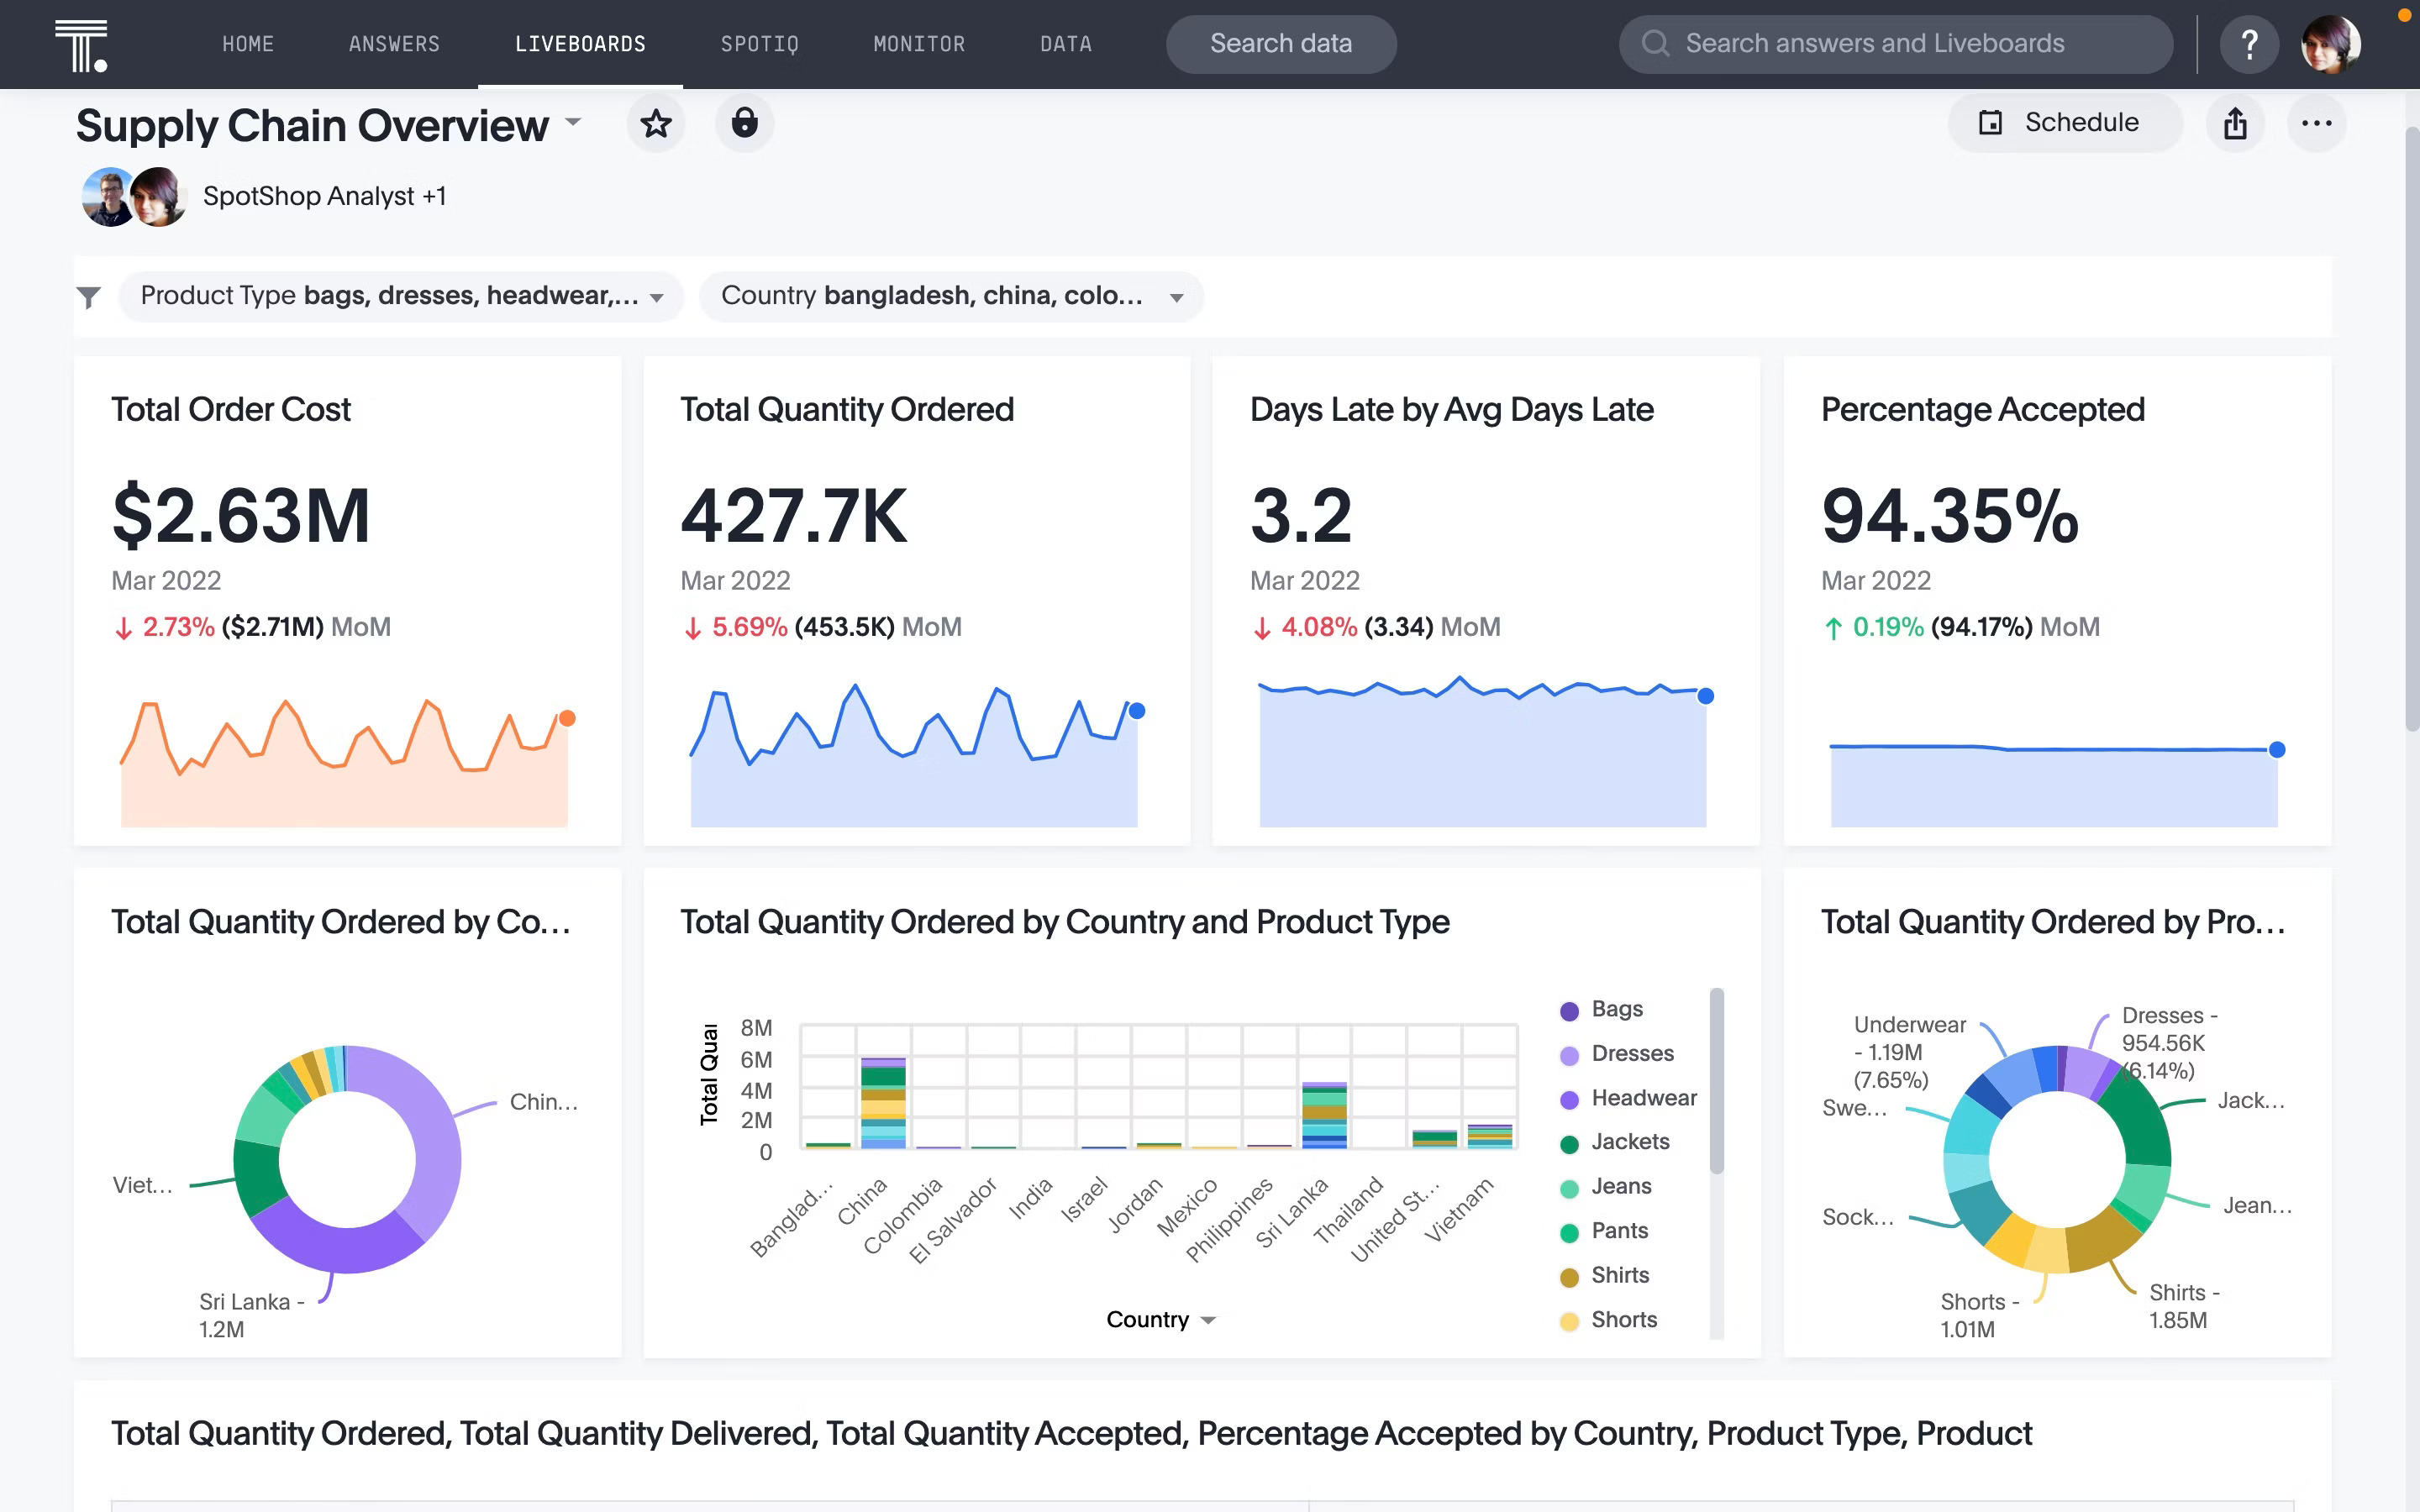
Consider a manufacturer trying to optimize their supply chain. Tracking important KPIs such as fulfillment rates, inventory turnover, lead times, and supplier performance can provide critical insights into the overall health of the supply chain.
To me, building a data-first culture is a long-term commitment. And with the new kid on the technology block—GenAI—the stakes are higher than ever. How you prepare your people to adapt to this shift makes all the difference.
To truly leverage AI for analytics, insight, and action, you need more than a bare-bones data experience. You need an AI partner that can keep up with the speed, complexity, and scale of your enterprise data while letting every user explore data in a way that feels natural—no query language required.
Want to take the next step? Schedule a ThoughtSpot demo today to see how our AI-Powered Analytics can foster a data-driven culture in your organization.


