


The honeymoon phase of big data and AI is almost over. As companies continue to grow, they’re quickly realizing that while collecting data might be easy, turning it into actionable insights is a whole different ball game. And for business leaders like you, this hurdle feels even more frqustrating. Still waiting on that report you requested weeks ago, right?
Luckily, it’s not all doom and gloom. , We’ve created a detailed guide on the many ways to turn your data into a goldmine of valuable insights—ready for you to capitalize on.
Table of contents:
Business intelligence (BI) is the use of specialized software and tools to analyze and transform data into actionable insights. Using BI, you can present complex information in more digestible formats like charts, heat maps, trendlines, and status reports. These data visualizations highlight real-time inefficiencies and opportunities, helping you gain a holistic picture of your company’s performance.
Consider you’re part of the GTM team preparing to launch marketing campaigns for a new product. Instead of jumping between multiple tools to piece together customer feedback, market trends, and sales data, you can leverage a BI solution to gain instant insights.
With real-time access to emerging customer preferences, competitor movements, and sales trends, you gain the clarity needed to position the product effectively and craft messaging that truly resonates. This data-driven approach helps you to fine-tune your launch strategy, boost campaign performance, and drive higher sales. Even better, it allows you to predict future trends or anticipate customer needs—the possibilities are truly endless.
If you’re a retailer, you’re constantly striving for more efficient ways to do what you do best. With valuable amounts of information at your disposal, you can now leverage retail analytics to discover new insights and create powerful in-store experiences for your customers. Here’s how you can use these business intelligence examples to operationalize data and act on insights:
1. Sales forecasting
Sales forecasting typically includes making predictions based on historical data, market analysis, and other relevant factors, so you can avoid missing targets and make sure there's always enough supply to meet demand.
For instance, with a modern BI solution like ThoughtSpot, you can analyze historical data to gain valuable insights into how your KPIs might behave. With these predictive analytics capabilities in hand, you can take proactive actions to stay ahead of the curve.
2. Supply chain analysis
By analyzing data from sources like historical sales trends, supplier performance, market fluctuations, and even external factors like weather patterns, you can gain valuable insights into your supply chain dynamics. With these insights, you can adjust inventory levels, optimize warehouse staffing, and streamline logistics to guarantee timely product delivery.

3. Customer relationship management
Companies can use data from surveys and other sources to get an idea of what customers want or need from their products or services, allowing them to adjust their offerings accordingly.
For example, ThoughtSpot’s AI-powered capabilities allow you to quickly uncover the "why" behind customer behavior. With Spotter as your AI Analyst, you can simply ask questions about your customer base, such as "Which segments are most likely to churn?" and get instant answers. With this intuitive approach, you can pinpoint important customer trends and patterns, helping you deliver an optimized customer experience that promises unmatched value.
4. Procurement management
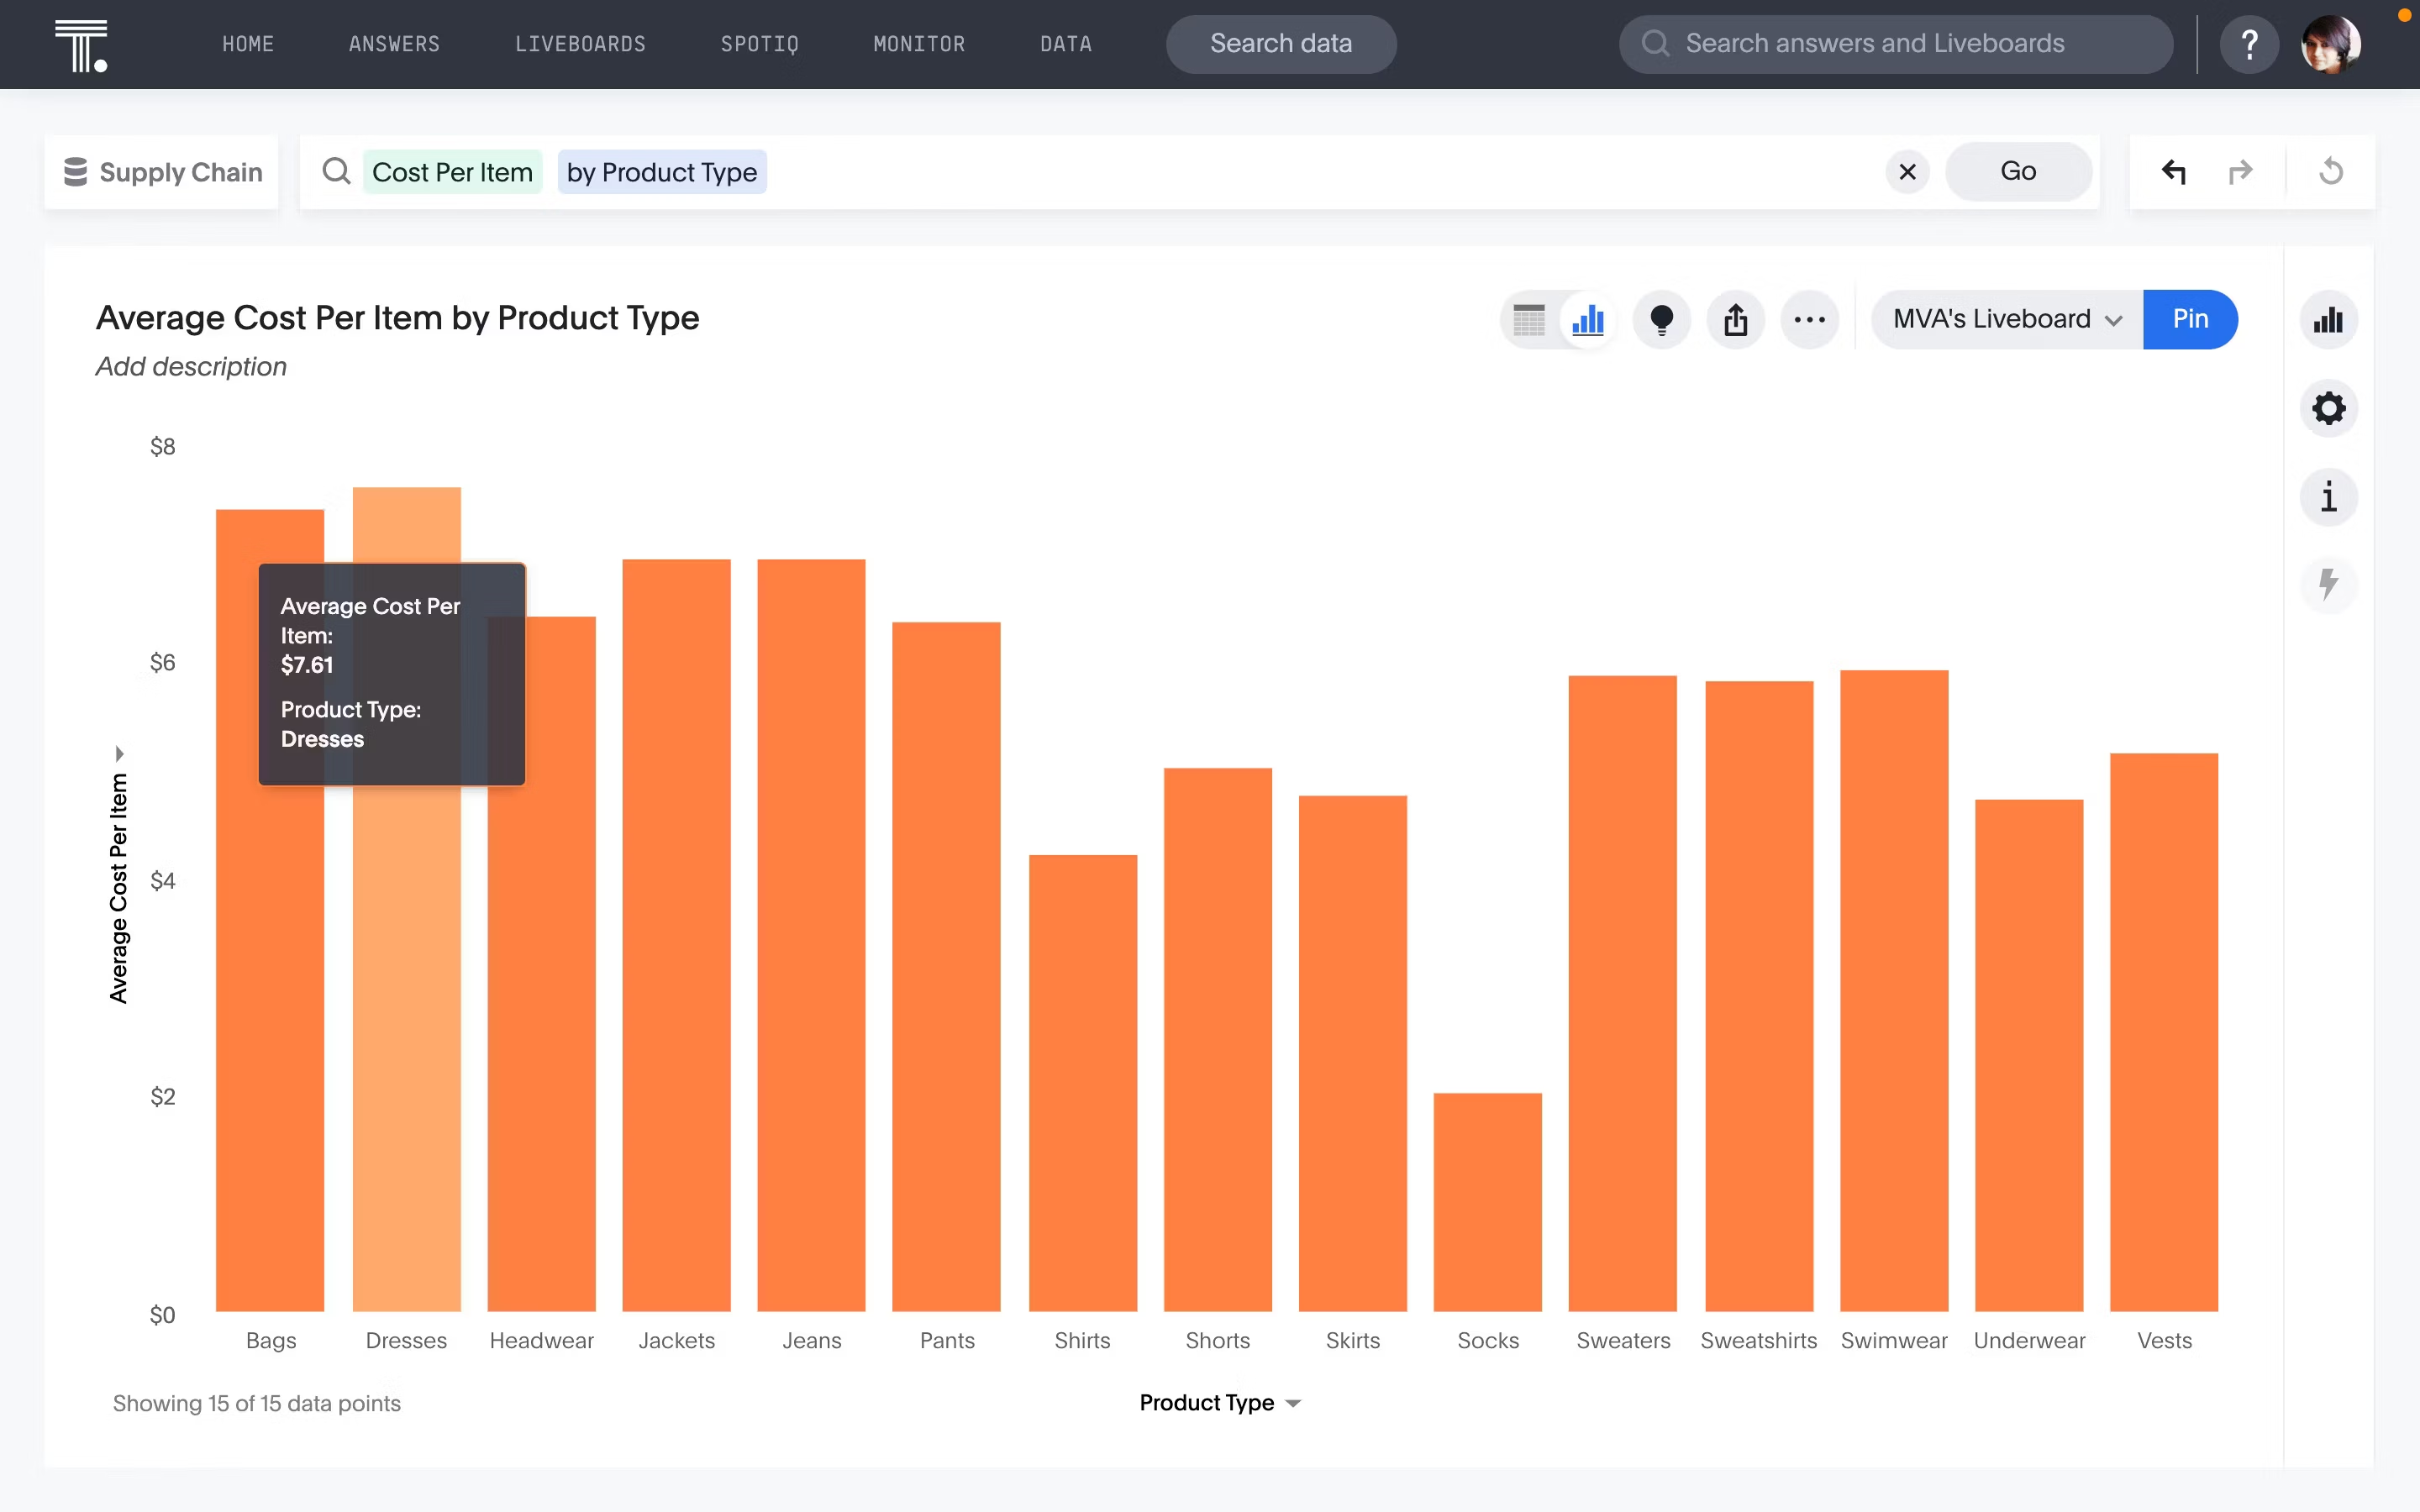
Retailers use BI solutions to analyze their sourcing efforts to determine when orders need to be placed, or goods need to be shipped. Keeping a pulse on important retail KPIs—such as purchase order cycle time, cost per item, and supplier lead times—can also help you identify cost savings opportunities and streamline the procure-to-pay processes.
5. Identifying cross-selling opportunities
Analyzing customer purchase patterns and behavior allows retailers to identify products or services that are frequently purchased together or are complementary to a customer's previous purchases. This lets you create targeted upselling and cross-selling strategies, increasing revenue per customer.
See how Canadian Tire was able to grow sales by 20% during the pandemic by forecasting demand with ThoughtSpot.
With data flowing in from all directions, finance leaders need more than just a visual snapshot—they need a dynamic, real-time view of their organization’s financial health. If you’re tired of relying on spreadsheets to make sense of your data, here’s how you can use dynamic BI tools to gain immediate insights into your company's current financial status - look at these BI examples
1. Risk management
A thorough analysis of data, including past incidents of fraud, security breaches, and operational failures can help you detect security vulnerabilities in your system and develop effective strategies to mitigate these risks in the future.
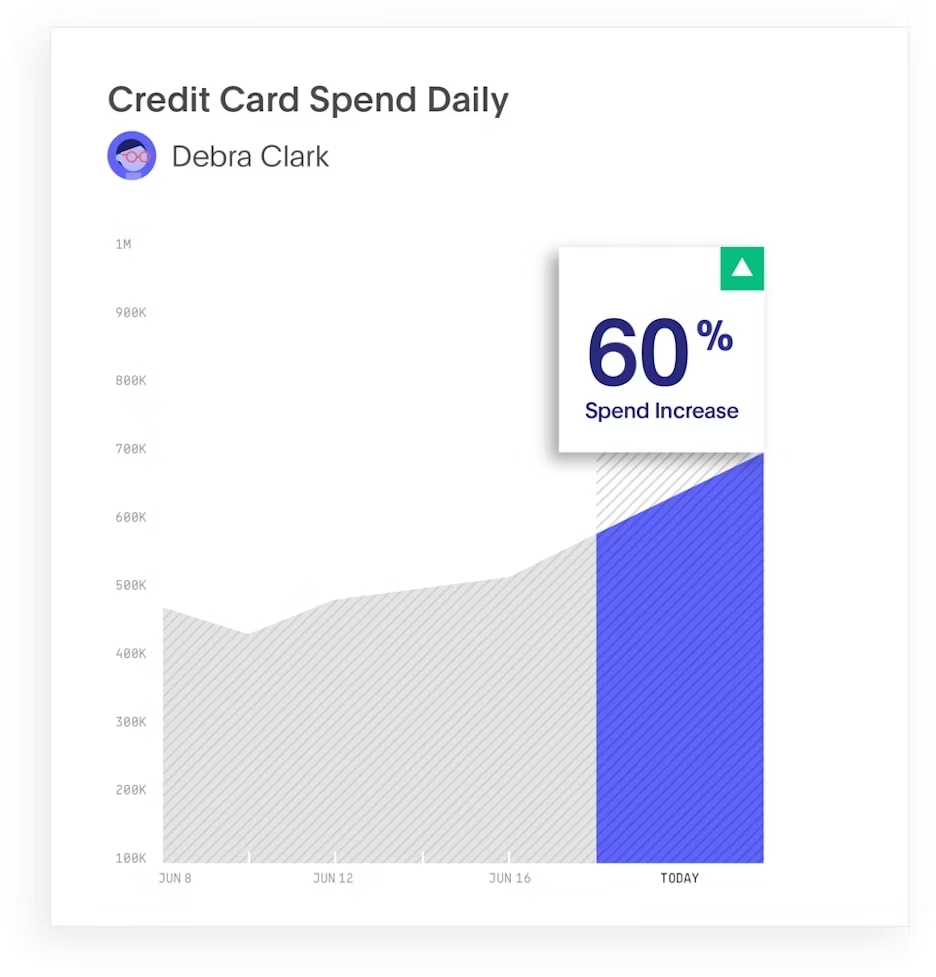
For instance, ThoughtSpot helps you set anomaly-based alerts, which gives you instant notifications when there are unusual changes in key performance indicators (KPIs). This immediate response allows you to address potential issues swiftly while minimizing operational disruptions.
2. Cash flow management
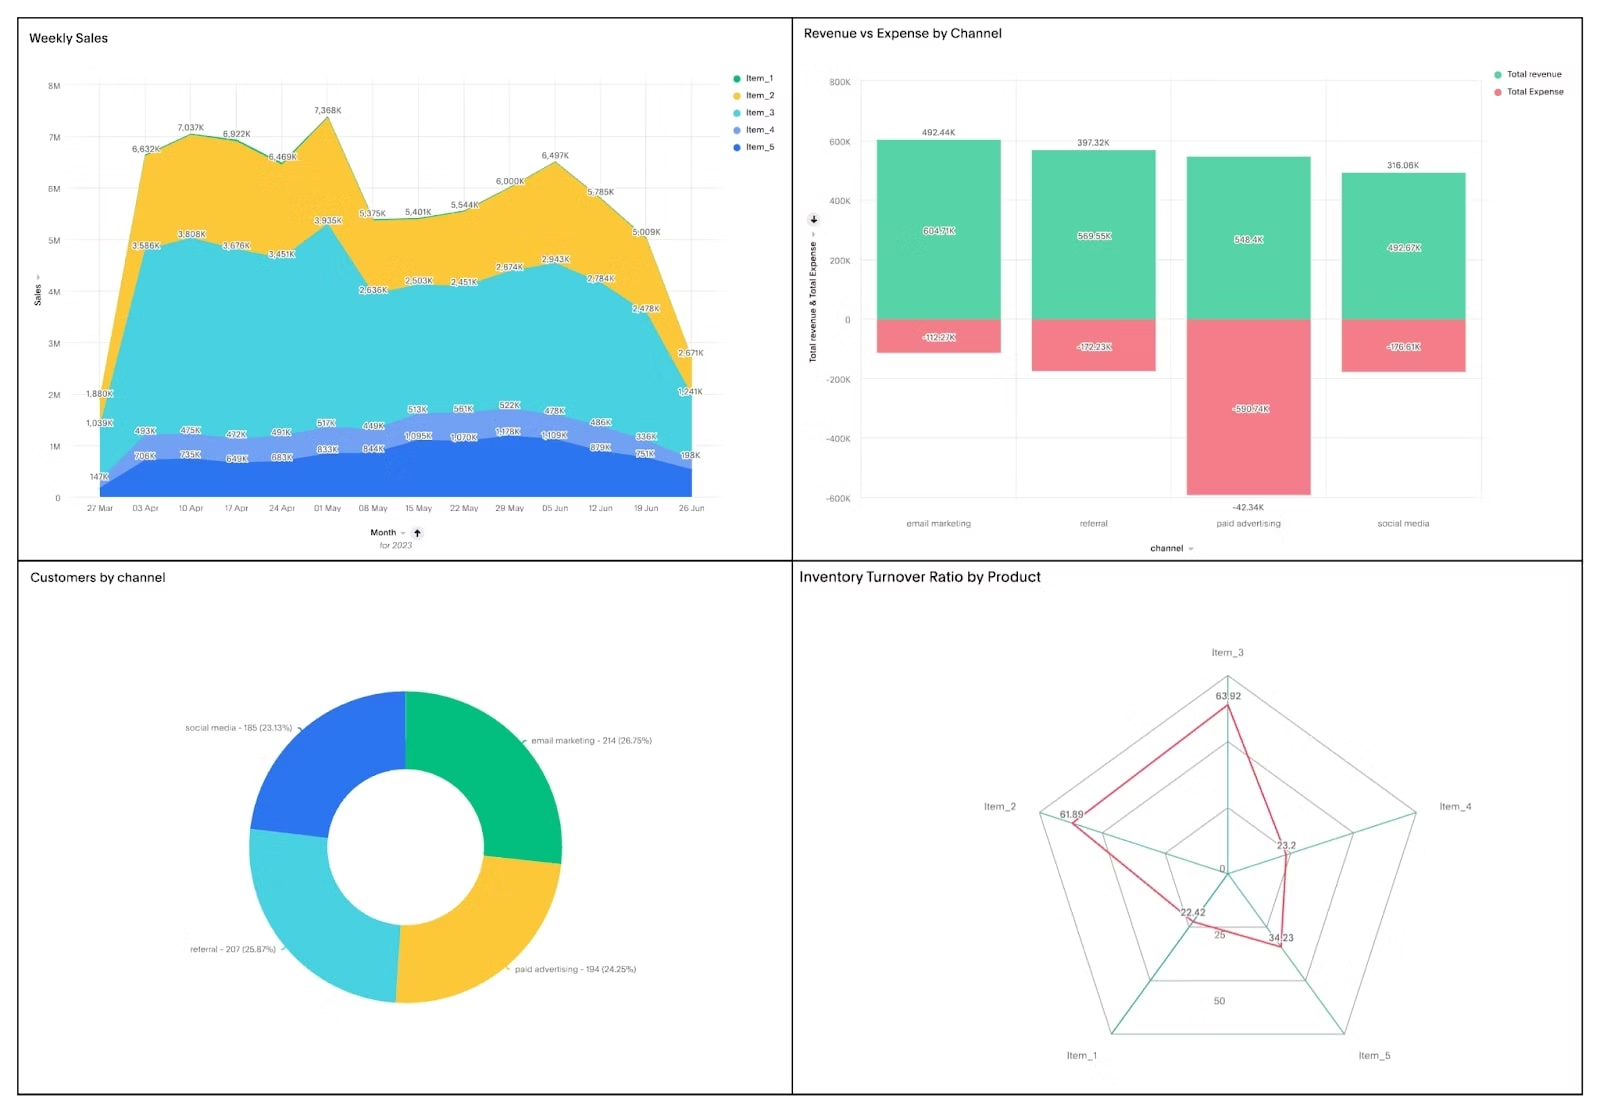
Using intuitive charts, bars, and graphs, you can easily assess your income streams, expenses, and liquidity for potential cash leaks.
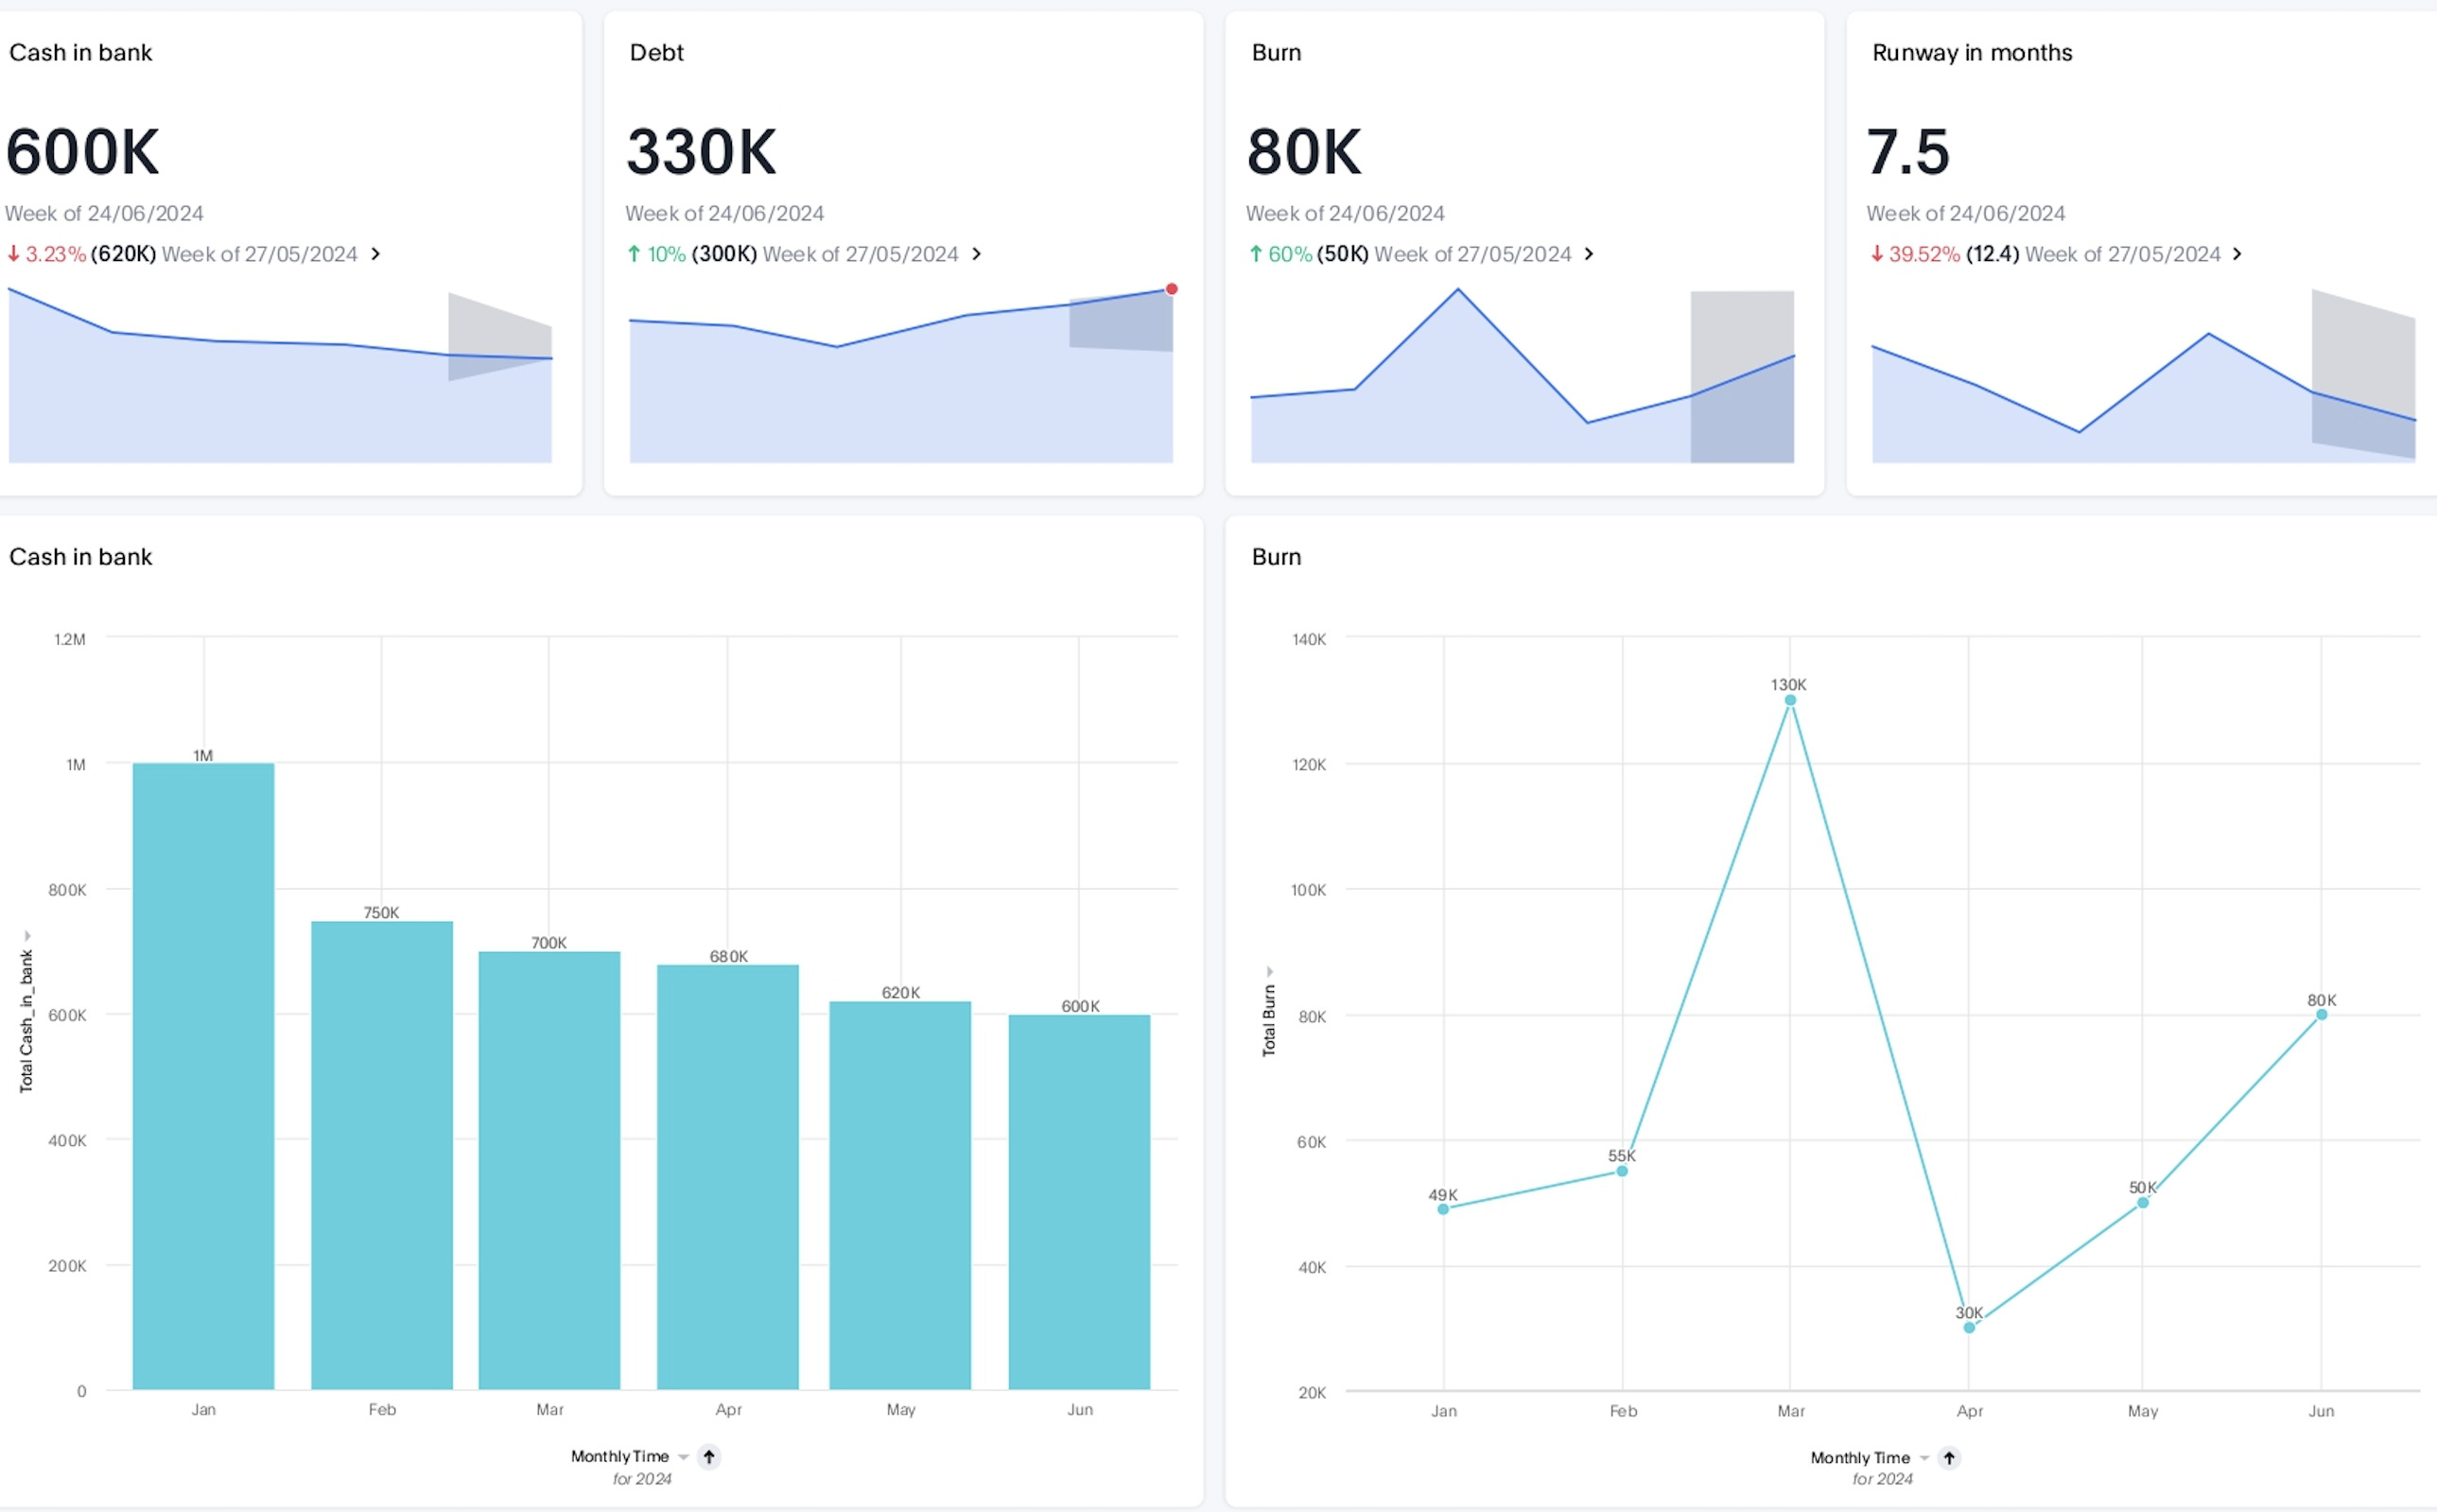
However, if you want more precise intelligence into the changes in your spending activities, you need a modern solution like ThoughtSpot to create interactive Liveboards. For instance, in the Liveboard example below, you can see real-time insights into cash flow KPIs, which quickly help you discover hidden causes, effects, and correlations.
3. Cost reduction
A key consideration in the financial sector is cost reduction. With features such as trend analysis, budget monitoring, and customizable reports, you can compare past performances to understand how your current expenses align with your budgetary projections. Additionally, it allows you to project future expenses so you can allocate resources more efficiently.
As the world embraces 5G and IoT, the telecommunications industry in particular is set to experience an unparalleled explosion of data. With BI, telecom companies can explore data without restrictions to better understand customer trends and pinpoint inefficiencies. Here are some business intelligence examples that help telecom providers put their data to use for growth:
1. Network performance
In telecommunications, BI can be a powerful tool for tracking real-time network performance, helping you maximize uptime and improve operational efficiency. By consolidating data from various network components, BI tools can quickly identify issues like bottlenecks, outages, or performance dips. With this in-depth analysis, you can put preventive measures in advance to avoid service disruptions.
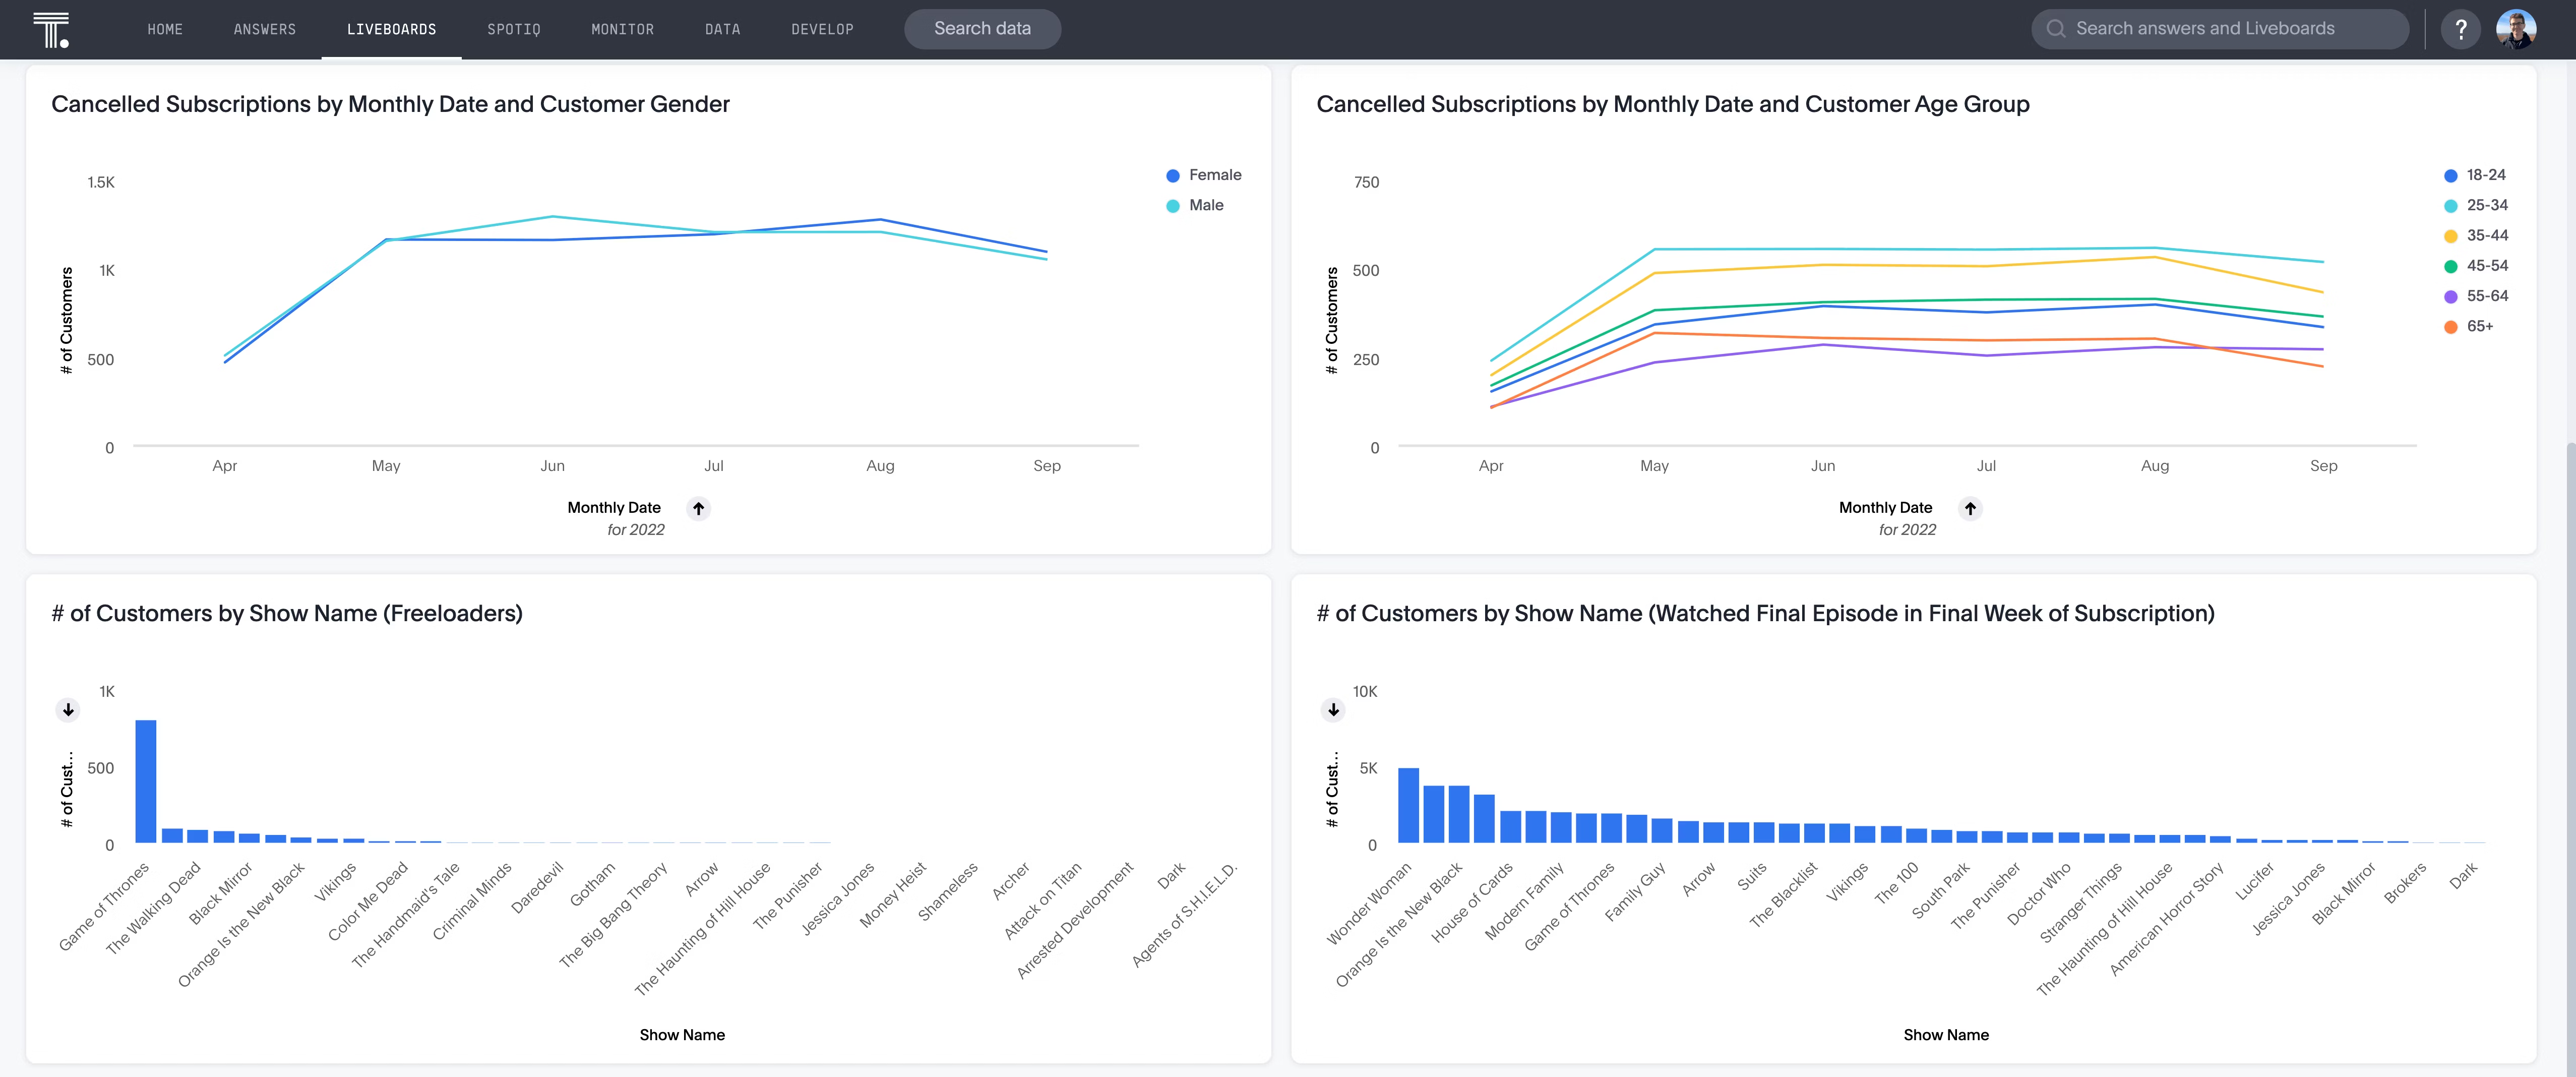
2. Customer retention
Tracking important customer experience KPIs such as customer satisfaction levels, churn rates, and customer effort Score, allows telecom providers to tailor their services to better meet evolving customer needs for better retention
For example, suppose your analysis reveals that most of your customers cancel their subscriptions because they frequently exceed their data limits and incur additional charges. In response, you could introduce an unlimited data plan option that appeals to these heavy data users.
3. Preventing data leakages
Advanced analytics and predictive algorithms are crucial for preventing data leakages in telecom operations. Analyzing patterns in network traffic, customer usage, and system access, can help telecom companies flag unusual activities that may indicate potential vulnerabilities or security threats. These predictive insights open the door to faster response times, helping you prevent costly data breaches, protect sensitive customer information, and maintain regulatory compliance.
The healthcare industry is changing rapidly. We’ve gone from paper-based prescriptions to a digital transformation that has fundamentally reshaped how we receive and experience care. The integration of AI, business intelligence, and electronic health records (EHRs) has further improved how healthcare providers streamline operations and improve decision-making. Let’s explore a few examples of healthcare analytics in action:
1. Personalized treatment plans
AI-powered BI is creating new avenues for healthcare providers to create personalized treatment plans. The powerful engine analyzes patient records, genetics, and historical outcomes, helping providers recommend treatment protocols that are tailored to each patient’s specific needs.
For instance, tracking the readmission rate of their patients can help healthcare providers can identify individuals at higher risk of readmission. Armed with these insights, clinicians can proactively adjust care plans, schedule follow-ups, and offer preventive treatments to reduce the risk of complications.
2. Accelerated drug discovery
Prescriptive analytics uses machine learning and AI to guide researchers and administrators make the most informed decisions about drug development. By analyzing massive datasets, it identifies promising drug compounds and recommends the most efficient testing pathways.
Whether you’re a manufacturer developing a new drug or want to identify growth opportunities for medication sales, leveraging BI can help you lower operational costs and drive greater profitability.
Navigating vast amounts of data and figuring out how to use it most effectively can feel overwhelming, but it doesn’t have to be. As you can see, business intelligence tools have the power to help you make better decisions and reduce costs. The only catch? You have to use the right software for your needs.
With ThoughtSpot’s AI-powered Analytics, it’s easy to search through all your data to find the answers you need—no matter how big or complex your data set may be. With features like Spotter, data exploration is as easy as chatting with a colleague.
Ready to take the next step? Schedule a demo today to experience how ThoughtSpot brings your data to life.


