Finding the perfect BI tool can feel like trying to fit a square peg into a round hole
Looker seems like a great BI tool at first—sleek interface, powerful analytics, and plenty of promise. But once you start using it, the cracks start to show. Maybe it’s the rigid customization, the technical learning curve, or the pricing that doesn’t quite work for your team.
If you’re here, it’s likely because you’re reevaluating whether Looker is the right fit for your organization. Maybe adoption has been a struggle, or the platform isn’t delivering what your team needs. Whatever the case, you’re searching for alternatives that fit better with your goals and workflow.
We’re here to help you navigate the BI landscape and explore options that make working with data easier, not harder. Let’s dive in.
What is Looker?
Looker is Google Cloud’s BI and analytics platform, built to help businesses explore, analyze, and visualize data in real time. Its standout feature? LookML - a proprietary modeling language that standardizes data definitions for consistency across teams.
For organizations deep in the Google ecosystem, Looker can be a natural fit. But for others, it comes with trade-offs—especially when it comes to usability and flexibility.
Where does Looker fall short?
Based on user feedback from the peer-to-peer review site G2, here are some frustrations you might experience with Looker:
Big data struggles – Slow queries and dashboards make large datasets a pain to analyze.
Steep learning curve – LookML adds complexity, making adoption difficult for non-technical teams.
Complicated pricing – Costs rise fast, especially for growing teams with expanding needs.
Limited customization – Advanced analytics and interactivity aren’t as robust as in other BI tools.
Google lock-in – Looker is great if you use Google tools, but integrating with non-Google platforms requires extra work (and cost).
If these challenges sound familiar, it’s time to find a BI platform that works for you—not against you.
Top 5 Looker alternatives to consider in 2025
Here’s a quick look at the top alternatives to Looker, based on performance, pricing, and usability:
- ThoughtSpot — Best for AI-powered search and intuitive self-service analytics
- Tableau — Best for advanced data visualization and interactive reporting
- Power BI — Best for Microsoft integration and affordability
- Qlik Sense — Best for associative data modeling and scalability
- Sisense — Best for embedding analytics directly into business workflows
ThoughtSpot is a leading analytics platform and one of the best Looker alternative that empowers business users with AI-powered insights and real-time data exploration. With an impressive G2 rating of 4.4, ThoughtSpot emerges as a robust alternative to Looker. Its search-based interface and generative AI capabilities make it easy for anyone to ask complex questions in natural language and get valuable insights without needing deep technical expertise.
ThoughtSpot’s intuitive, user-friendly interface reduces the need for specialized skills. Unlike Looker’s reliance on LookML, ThoughtSpot’s AI-driven search allows any user on your team to interact with the data directly, providing faster, more accessible insights.
To support a wide range of analytics needs, ThoughtSpot delivers two powerful core products.
ThoughtSpot Analytics: A self-service platform that allows anyone to create and share personalized insights using search and AI, making data accessible to all.
ThoughtSpot Embedded: A developer-friendly solution for embedding ThoughtSpot’s AI-powered analytics into custom applications, enabling seamless integration of data-driven insights into any product or workflow.
Key features of ThoughtSpot:
1. Generative AI with Spotter: Meet your built-in AI Analyst. Spotter combines LLMs with ThoughtSpot’s relational search engine to turn your questions into instant insights. Ask anything, follow up for deeper analysis, and get automated alerts—all in real-time, without complex queries.
2. AI-Augmented dashboards: Forget static reports. These interactive, dynamic dashboards update on the fly, making it easy to track KPIs, drill into data, and discover insights without needing to rebuild reports or wait for manual updates.
3. Data Modeling Studio: Model data your way. Connect to 20+ cloud platforms, maintain smooth data governance, and use ThoughtSpot Modeling Language (TML) for advanced, scriptable control.
4. Unified analytics: From cloud platforms to business apps, ThoughtSpot connects to it all. Get real-time AI-powered insights wherever you work, without data silos slowing you down.
5. AI-driven data prep: Get your data ready faster in Analyst Studio with AI-powered tools for SQL, Python, and R. Automate tedious tasks, clean data effortlessly, and spend more time on real analysis.
Pros of ThoughtSpot:
Natural language search and AI-driven insights for easy data exploration
Self-service analytics tools that reduce the dependency on data team
Seamless integration with cloud data platforms for cohesive analytics
Real-time data updates for informed decision-making
Cons of ThoughtSpot:
Advanced features, such as custom data modeling, might require additional training to maximize their potential.
With ThoughtSpot’s team continuously rolling out new updates, keeping up with the platform’s evolving features can be challenging.
Pricing
14-day free trial
Essentials: $1,250 /month (20 users)
Pro: Custom
Enterprise: Custom
Tableau is a BI tool built for interactive dashboards and deep customization. It’s powerful but comes with a learning curve—users get extensive control over visualizations, but complex datasets may require technical expertise.
If you need flexibility in how you present data, Tableau delivers. Just be prepared for the time investment to master it.

Key features of Tableau:
Visualization: Create pie charts, bar charts, line charts, scatterplots, histograms, treemaps, and more.
Data blending: Combine data from different sources into a single project to compare datasets and find insights.
Collaboration: Allow users to collaborate on shared data projects using Tableau Server, Tableau Cloud, and Tableau Public.
Augmented analytics: Use AI and natural language queries to analyze data and get contextual insights.
Pros of Tableau:
Large dataset handling allows you to process millions of data rows.
Extensive online communities can help you with plenty of online resources, training, and forums.
Cons of Tableau:
Limited parameter selection forces you to manually update your data.
Creating complex datasets often requires SQL skills, though you can work with data once it’s prepared.
Performance can slow down significantly when handling large datasets, especially when your visualizations are more complex.
Pricing
14-day free trial
Tableau Creator - $75.00/user/month
Tableau Explorer - $42.00/user/month
Tableau Viewer - $15.00/user/month
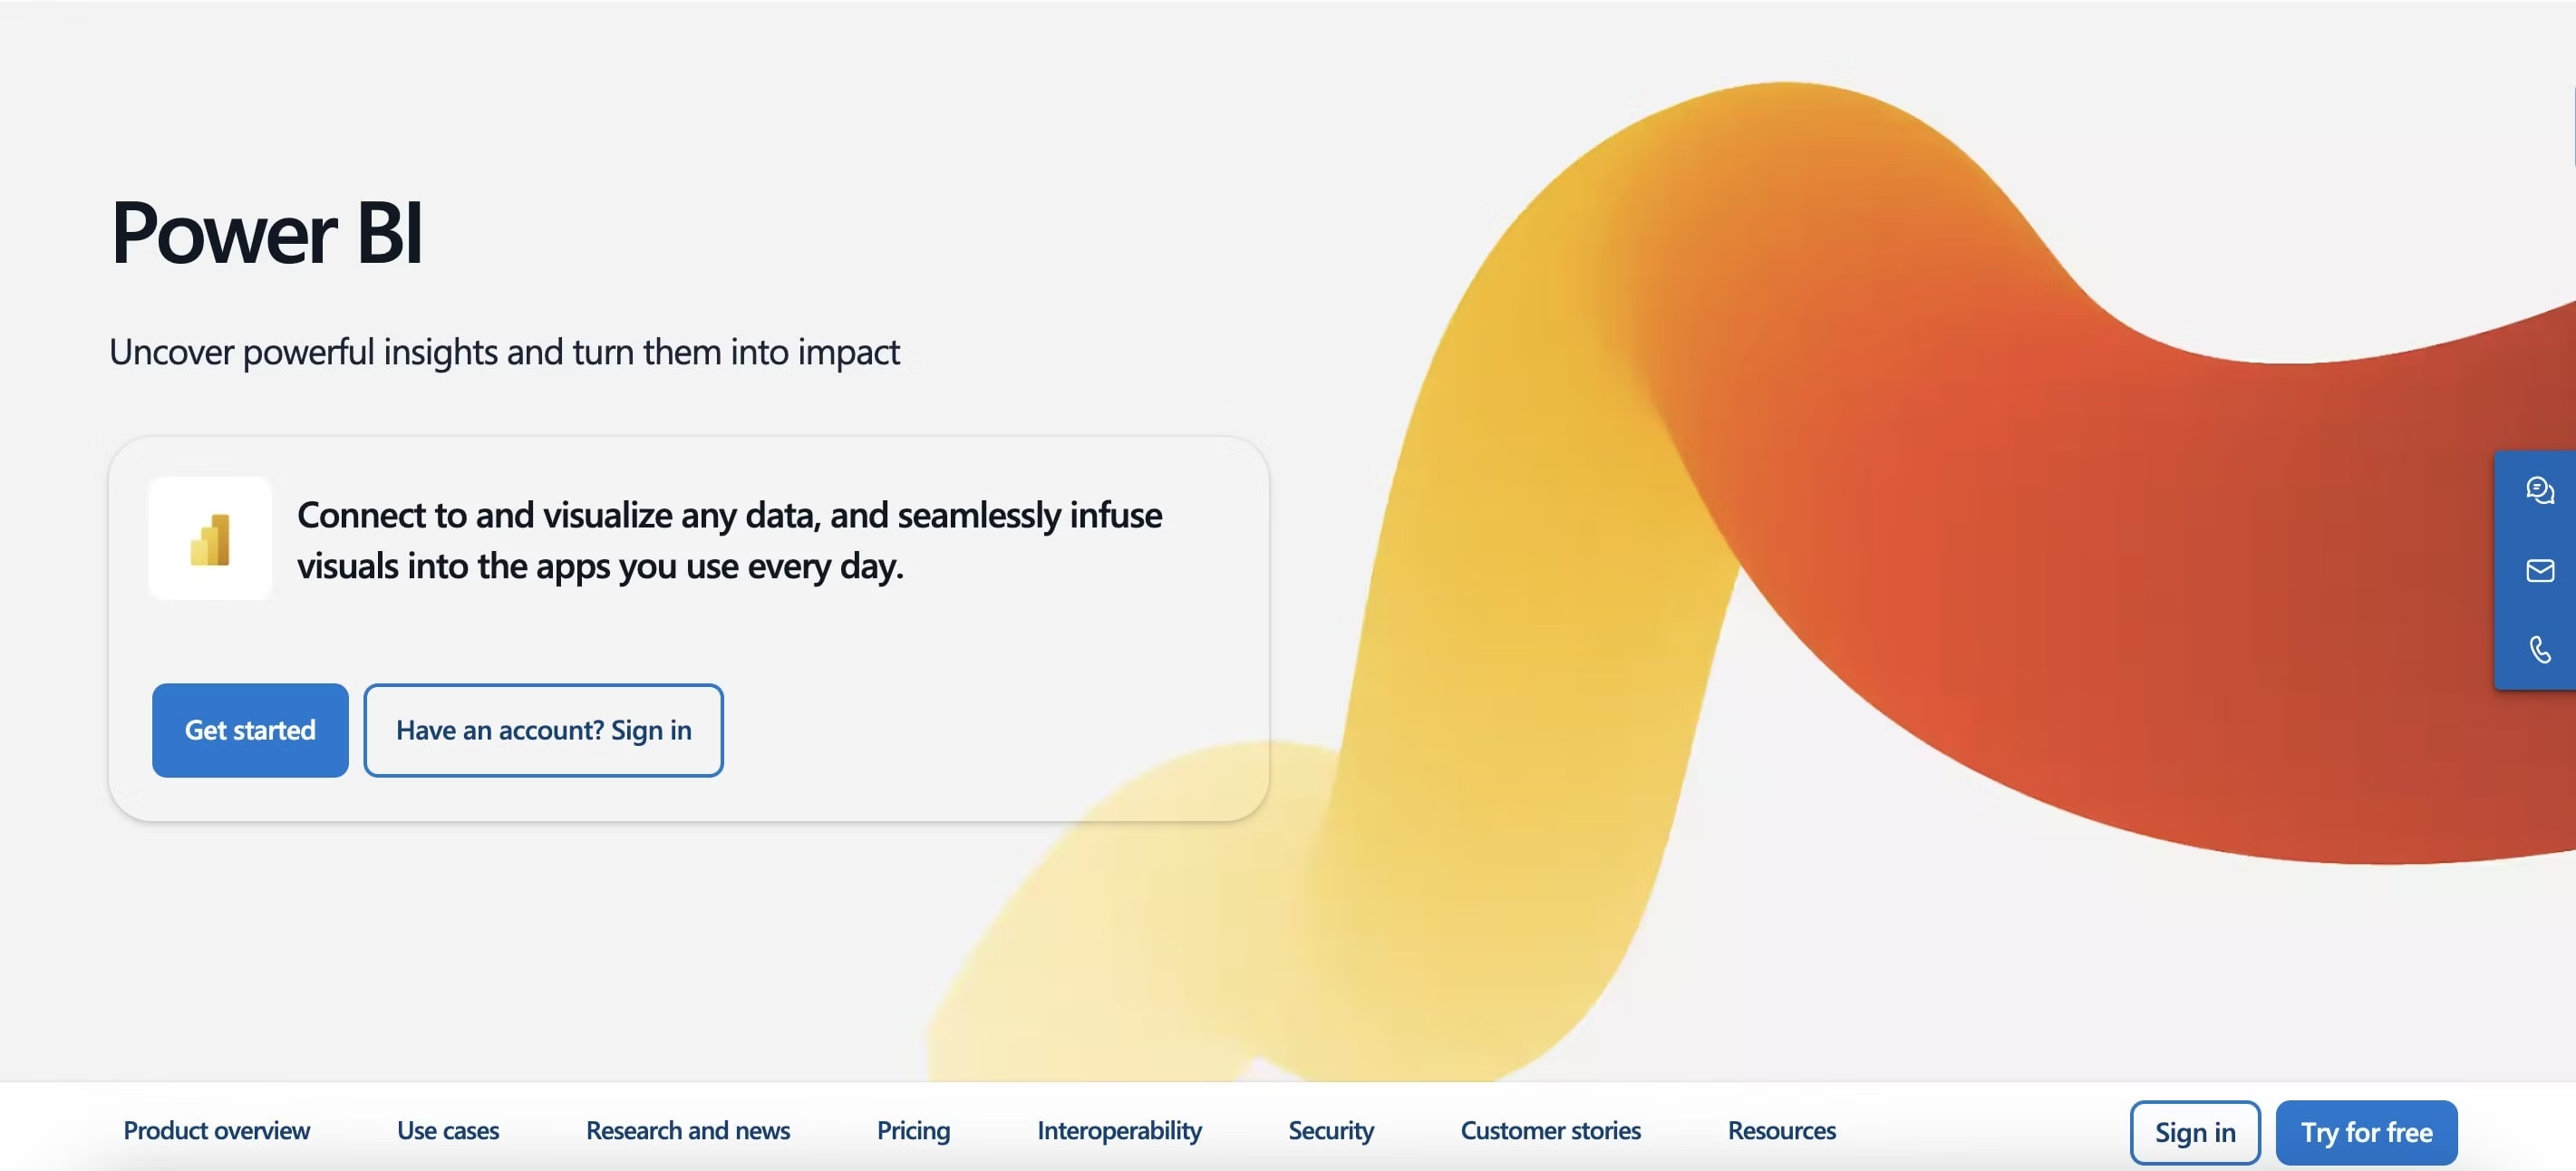
Power BI is Microsoft’s go-to BI tool for data visualization, reporting, and dashboard creation. Its drag-and-drop interface makes it easy to create reports, but you might find its customization and scalability options limited compared to the other platforms on this list.
If you’re already using Microsoft products, Power BI integrates seamlessly. Just keep in mind that complex reports may require more advanced data skills.
Key features of Power BI:
Data integration: Connect multiple data sources, including Excel, SQL Server, Azure, and other third-party applications.
Customizable dashboards: Build dashboards and reports to analyze data with real-time updates for faster decision-making.
Data modeling: Use Power Query and Power Pivot to structure data and create complex data models.
Natural Language Queries: The Q&A feature allows you to ask data-related questions in natural language for easier data analysis.
Pros of Power BI:
Seamless integration with other Microsoft tools makes it a good option if you’re already using the Microsoft ecosystem.
A range of visualization options lets you choose how you want to present data.
Cons of Power BI:
Customization for complex visualizations may be limited compared to some other BI tools.
Large datasets can cause slower performance, so additional tools might be needed for data processing.
Power BI’s full functionality depends on cloud services, which might not work well if you have strict data privacy or compliance requirements.
Pricing
30-day free trial
Free account
Power BI Pro - $10/user/month
Power BI Premium - $20/user/month
Power BI Embedded - Variable
💡 Read a detailed comparison here: Looker vs Power BI: Which is Better for BI Analytics?
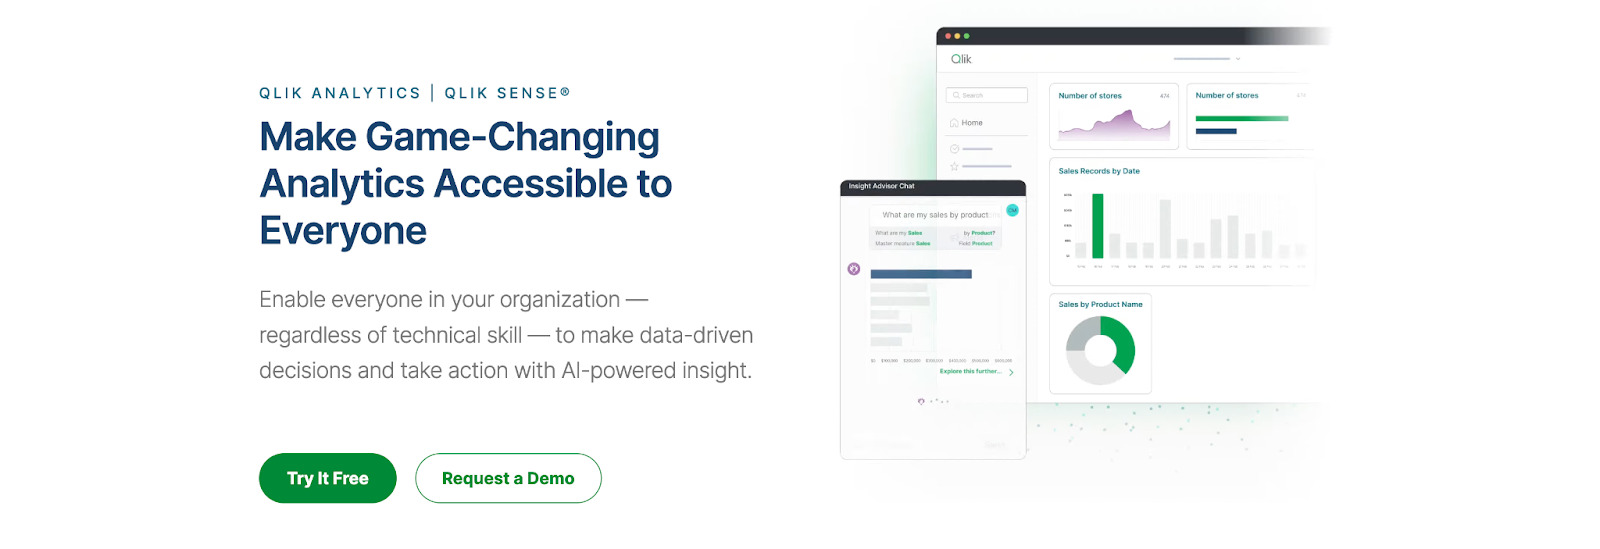
Qlik Sense is a self-service BI platform designed for intuitive data exploration and visualization. Its associative data model connects datasets in a flexible way, but the platform has a learning curve—especially for users without prior experience in data analytics.
If you need a tool that helps you explore relationships between data points, Qlik Sense is a solid choice. Just be prepared for the adjustment period.
Key features of Qlik Sense:
Self-service visualization: Load, visualize, and explore data sets with real-time visualization updates.
Conversational search: Use search-based tools and natural language processing to generate insights.
Automated alerts: Get notified of data changes with automated workflow alerts.
Embedded analytics: Customize analytics solutions and integrate them into other applications using open APIs.
Pros of Qlik Sense:
Cross-device accessibility lets you work from desktops, laptops, tablets, and smartphones.
Custom app creation allows you to build personalized visualizations without advanced technical skills.
Cons of Qlik Sense:
The platform might slow down when processing large datasets, affecting efficiency.
While affordable for smaller teams, the per-user cost can be high for larger teams.
Users report issues with exporting data to Excel, particularly with losing formatting like colors and fonts.
Pricing
30-day free trial
Qlik Sense Business - $30/user/month
Qlik Sense Enterprise SaaS - Custom
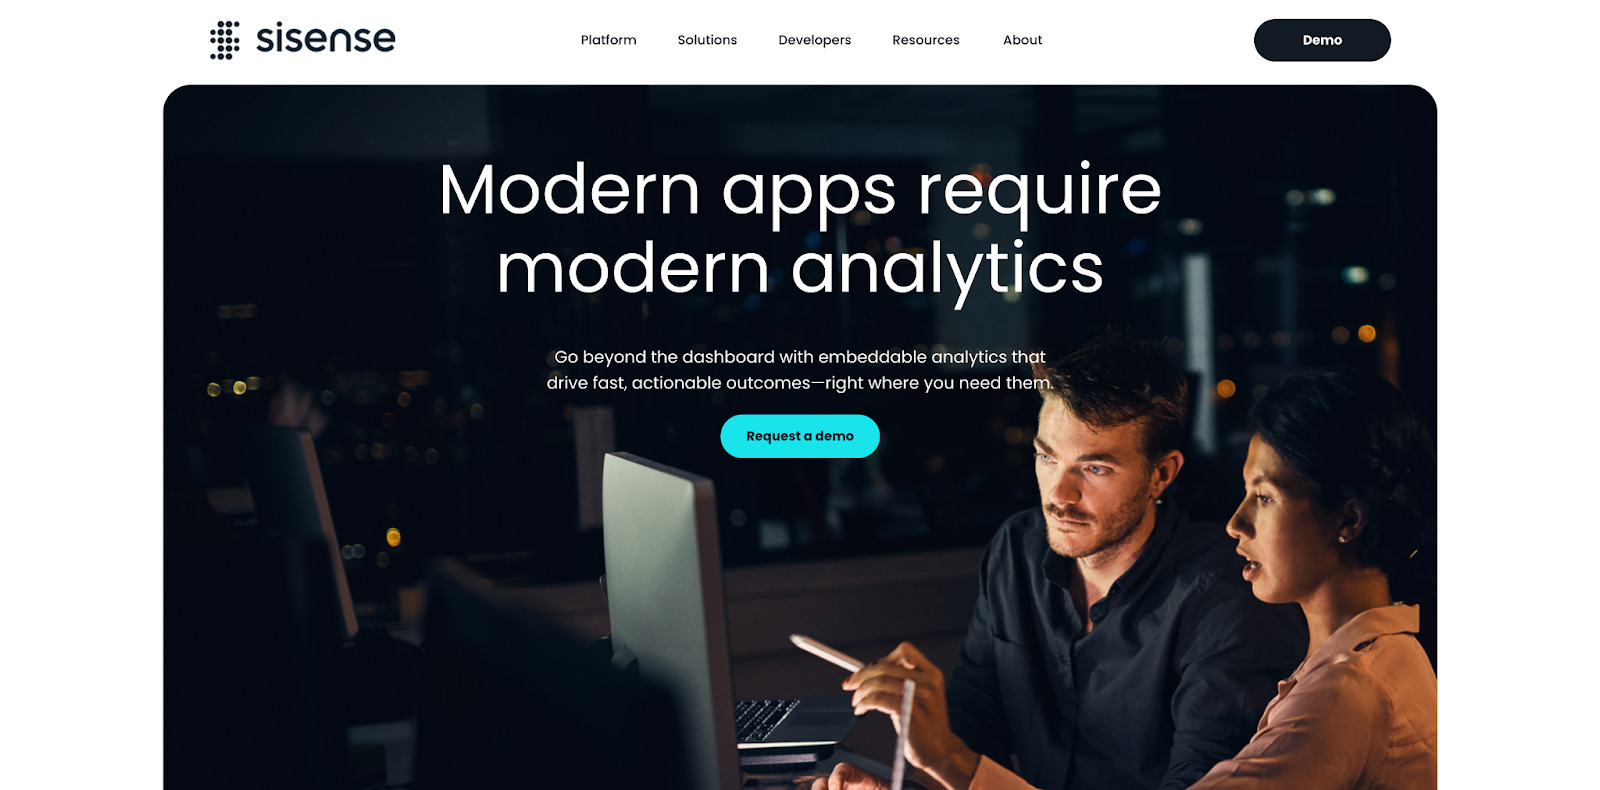
Sisense keeps things simple for users with natural language querying (NLQ) features, although it primarily relies on traditional dashboard-based reporting. Users can store data in Sisense’s ElastiCube or connect it to cloud warehouses to consolidate data for preparation, visualization, and exploration—all without needing heavy IT involvement.
It’s easy to use, but don’t expect deep data modeling. While Sisense simplifies reporting, it lacks the advanced modeling tools that Looker provides.
Key features of Sisense:
Git integration: Manage and version control custom code and workflows used in analytics.
Low-code interface: Create dashboards, widgets, and reports with limited technical expertise.
APIs and SDKs: Extend functionality, enabling custom integrations and workflows.
Data connectivity: Sisense supports cloud data warehouses, on-premise databases, and third-party apps.
Pros of Sisense:
AI-driven exploration paths and automatic explanations help you discover insights and trends.
Embedded analytics allow you to integrate dashboards into your applications or websites.
Cons of Sisense:
Advanced analytics tasks may still require technical expertise.
Performance can lag with large datasets or complex queries.
The learning curve may be steep for more advanced features.
The pricing might be high, particularly for small to mid-sized businesses.
Pricing
Free demo available
Platform pricing - Custom
Smarter BI starts with the right platform
While Looker is a powerful business intelligence tool, its complexity and pricing may not suit your needs. If you want more affordable options, user-friendly interfaces, or advanced integration capabilities, ThoughtSpot provides flexible and scalable solutions that could better align with your business’s unique requirements.
Take your analytics to the next level with ThoughtSpot—get started with a live demo!


