Choosing a BI tool isn’t just about analytics; it’s about finding a solution that grows with your business. Power BI’s strong reputation comes from its analytics capabilities and Microsoft ecosystem integration. But for organizations with unique needs, challenges like scalability, licensing complexity, or limited flexibility can push them to explore other options.
If you’re reevaluating Power BI or simply seeking a tool better suited to your team’s workflows, you’re in the right place. We’ve rounded up the most compelling alternatives to help you drive smarter, data-powered decisions.
Let’s get started.
What is Power BI?
Power BI is a data analytics and visualization tool developed by Microsoft that allows you to turn raw data into actionable insights. Through interactive dashboards, reports, and robust data modeling capabilities, Power BI has become a popular choice for organizations seeking to become more data-driven.
Businesses use Power BI to analyze performance metrics, monitor KPIs, and make informed decisions based on live data. With its integration into the Microsoft ecosystem, Power BI simplifies data visualization and enhances collaboration through tools like Teams and SharePoint.
One major advantage of Power BI is its accessibility to Microsoft users. Its integration with Excel, Azure, and other Microsoft products makes it a natural fit for organizations already invested in the Microsoft ecosystem. Additionally, Power BI’s AI-powered features allow you to generate insights and forecasts, giving decision-makers a deeper understanding of trends.
That said, Power BI has its limitations. Here’s a closer look at some common challenges users face and a few alternative solutions that might be a better fit for your specific needs.
How Power BI falls short as a data analytics solution
Performance issues
Large datasets: Power BI's performance can degrade when handling large datasets, especially with complex calculations or transformations.
RAM dependency: The tool relies heavily on system memory (RAM), which can slow performance on resource-constrained devices.
Slow reports: Reports with multiple visuals and filters can experience slow loading and refreshing times.
Limited data transformation
ETL complexity: The built-in Power Query Editor lacks the advanced functionality of dedicated ETL tools like Alteryx or SSIS for handling complex data transformations.
Direct Query limitations: While Direct Query mode enables real-time data access, it suffers from performance constraints and limited functionality compared to Import mode.
Licensing and cost challenges
Pro license costs: Sharing reports and dashboards requires a Power BI Pro license, priced at $10 per user/month. While this might work for smaller teams, costs can quickly add up for larger organizations with many users needing access.
Premium license costs: Enterprise features such as larger model sizes, more frequent refreshes, and advanced capabilities are included with the Power BI Premium license, priced at $20 per user/month. For organizations needing dedicated capacity, costs increase significantly and are often unattainable for small and medium-sized businesses.
Power BI alternative solutions for data insights and visualizations
- ThoughtSpot – Best for AI-powered search and intuitive self-service analytics
- Tableau – Best for advanced data visualization
- Sisense – Best for embedding analytics
- Looker – Best for unified data modeling
- SAP Analytics Cloud – Best for combining BI and planning
- Qlik Sense – Best for associative data modeling
- GoodData – Best for developer-friendly tools
- MicroStrategy – Best for geospatial and predictive analytics
- Zoho Analytics – Best for BI with integration across business apps
- Domo – Best for real-time data integration
ThoughtSpot is a leading Power BI alternative designed to empower business users with AI-powered insights and timely data exploration. With a strong G2 rating of 4.4, ThoughtSpot is an excellent option for teams seeking intuitive analytics solutions. Its search-based interface and generative AI capabilities allow you to ask complex questions in natural language and get insights without needing advanced technical expertise.
Unlike Power BI’s reliance on technical setup and deep learning curves for advanced features, ThoughtSpot simplifies data exploration with AI-driven search. It allows any team member to engage with data directly, providing faster insights for better decision-making.
ThoughtSpot offers two robust products tailored to diverse analytics needs:
ThoughtSpot Analytics: A self-service platform enabling you to create and share personalized insights using search and AI, making data accessible to all.
ThoughtSpot Embedded: A developer-friendly solution that integrates AI-powered analytics into custom applications, offering seamless data-driven insights across workflows.
Key features of ThoughtSpot
Spotter, your AI analyst: Spotter acts as your AI analyst, delivering actionable insights for any question instantly. You can interact with Spotter using plain-language queries like “What were our sales last month?” or more complex inquiries. Unlike traditional BI tools that require SQL expertise, Spotter autonomously analyzes data and generates accurate visualizations and reports, making data-driven insights accessible to everyone.
Real-time insights with Liveboards: Liveboards are dynamic dashboards that allow for meaningful and intuitive interactions with data. Designed with ease of use in mind, they empower even business users to filter, drill down into data points, and monitor updates instantly. For example, marketing teams can monitor campaign performance and adjust strategies as new data emerges, reallocating budgets to high-performing channels or refining audience targeting along the way.
Embedded analytics: With ThoughtSpot’s embedded analytics, you can integrate interactive liveboards into your apps, websites, or platforms. This allows you to explore data directly within your preferred tools, eliminating the need for custom-built solutions. This feature is especially valuable for SaaS platforms and enterprises seeking to offer integrated analytics experiences.
Massive data handling and speed: ThoughtSpot is built to handle billions of rows of data at an enterprise scale, whether on-premises or in the cloud. Its architecture is optimized for lightning-fast query performance, enabling teams to explore massive datasets and gain actionable insights without delays or performance bottlenecks.
Pros
Natural language search for accessible insights.
Reduced dependency on IT teams through self-service analytics.
Integration with cloud platforms ensures on-the-fly data updates.
Cons
Advanced features may require additional training.
Regular updates might require teams to stay current with new functionalities.
Pricing
14-day free trial
Essentials: $1,250/month (20 users)
Pro: Custom
Enterprise: Custom
Tableau is another Power BI alternative, known for its advanced data visualization and interactive reporting features. It allows users to create customizable and visually appealing dashboards, which is useful for organizations focused on data storytelling and flexible presentation of insights. However, its dependence on external data prep tools can make managing complex workflows more difficult.
Key features of Tableau
Customizable dashboards: Tableau provides a drag-and-drop interface for building interactive dashboards that cater to specific business needs.
Data integration: Connects with various data sources, including databases, spreadsheets, and cloud platforms.
Predictive analytics: Offers tools for forecasting and statistical modeling to support data-driven decision-making.
Pros
Intuitive visualization tools for non-technical users.
Seamless integration with multiple data sources.
Supports predictive analytics and advanced reporting.
Cons
May require additional training for advanced features.
Performance can be impacted with very large datasets.
Pricing
14-day free trial
Enterprise Creator - $115 user/month
Enterprise Explorer - $70 user/month
Enterprise Viewer - $35 user/month
💡Read a detailed comparison here: Power BI vs Tableau.
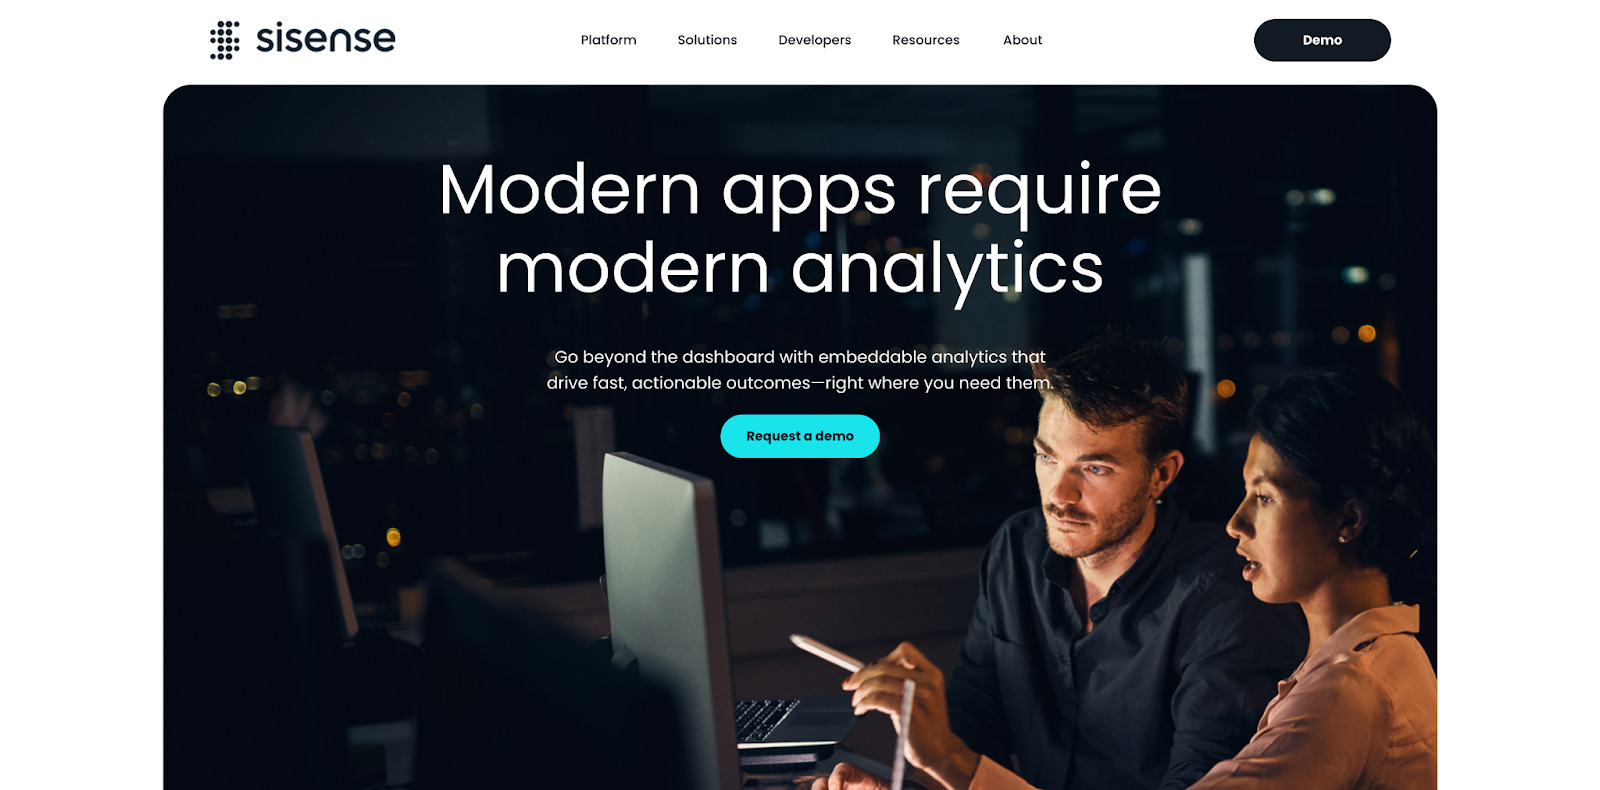
Sisense is a Power BI competitor designed to embed analytics into business workflows and handle large datasets. It allows organizations to integrate analytics into their applications, making insights more accessible to end users. It's useful for businesses looking to centralize data and streamline reporting. However, the need for technical configuration can slow down initial implementation.
Key features of Sisense
Embedding analytics: Integrates analytics into existing applications, making insights more accessible.
Big data processing: Optimized for handling large datasets with in-chip technology.
Customizable dashboards: Allows users to tailor dashboards to specific business metrics.
Pros
Ideal for embedding analytics into workflows.
Efficient handling of large datasets.
Customizable dashboards for various needs.
Cons
Initial setup may require technical expertise.
Advanced customizations may need developer support.
Pricing
Free demo
Custom platform pricing
Looker, a business intelligence platform by Google, focuses on centralized data modeling and collaboration. It allows teams to define and share metrics through a unified data model, ensuring data consistency and reducing reporting discrepancies. This makes it useful for organizations that need consistent reporting across departments, especially those already using Google products. However, its reliance on LookML can limit flexibility, particularly for teams without coding expertise.

Key features of Looker
Centralized data modeling: Allows data teams to define consistent metrics using LookML.
APIs for customizations: Enables businesses to build tailored analytics solutions with its extensive API capabilities.
Scalability: Cloud-native architecture supports growing data and user needs.
Pros
Ensures consistency in reporting with centralized data models.
Highly customizable through APIs.
Scalable for growing organizations.
Cons
Relies on technical expertise for initial setup.
May have a steeper learning curve for non-technical users.
Pricing
30-day free trial
Custom platform and user pricing
💡 Read a detailed comparison: Looker vs Power BI
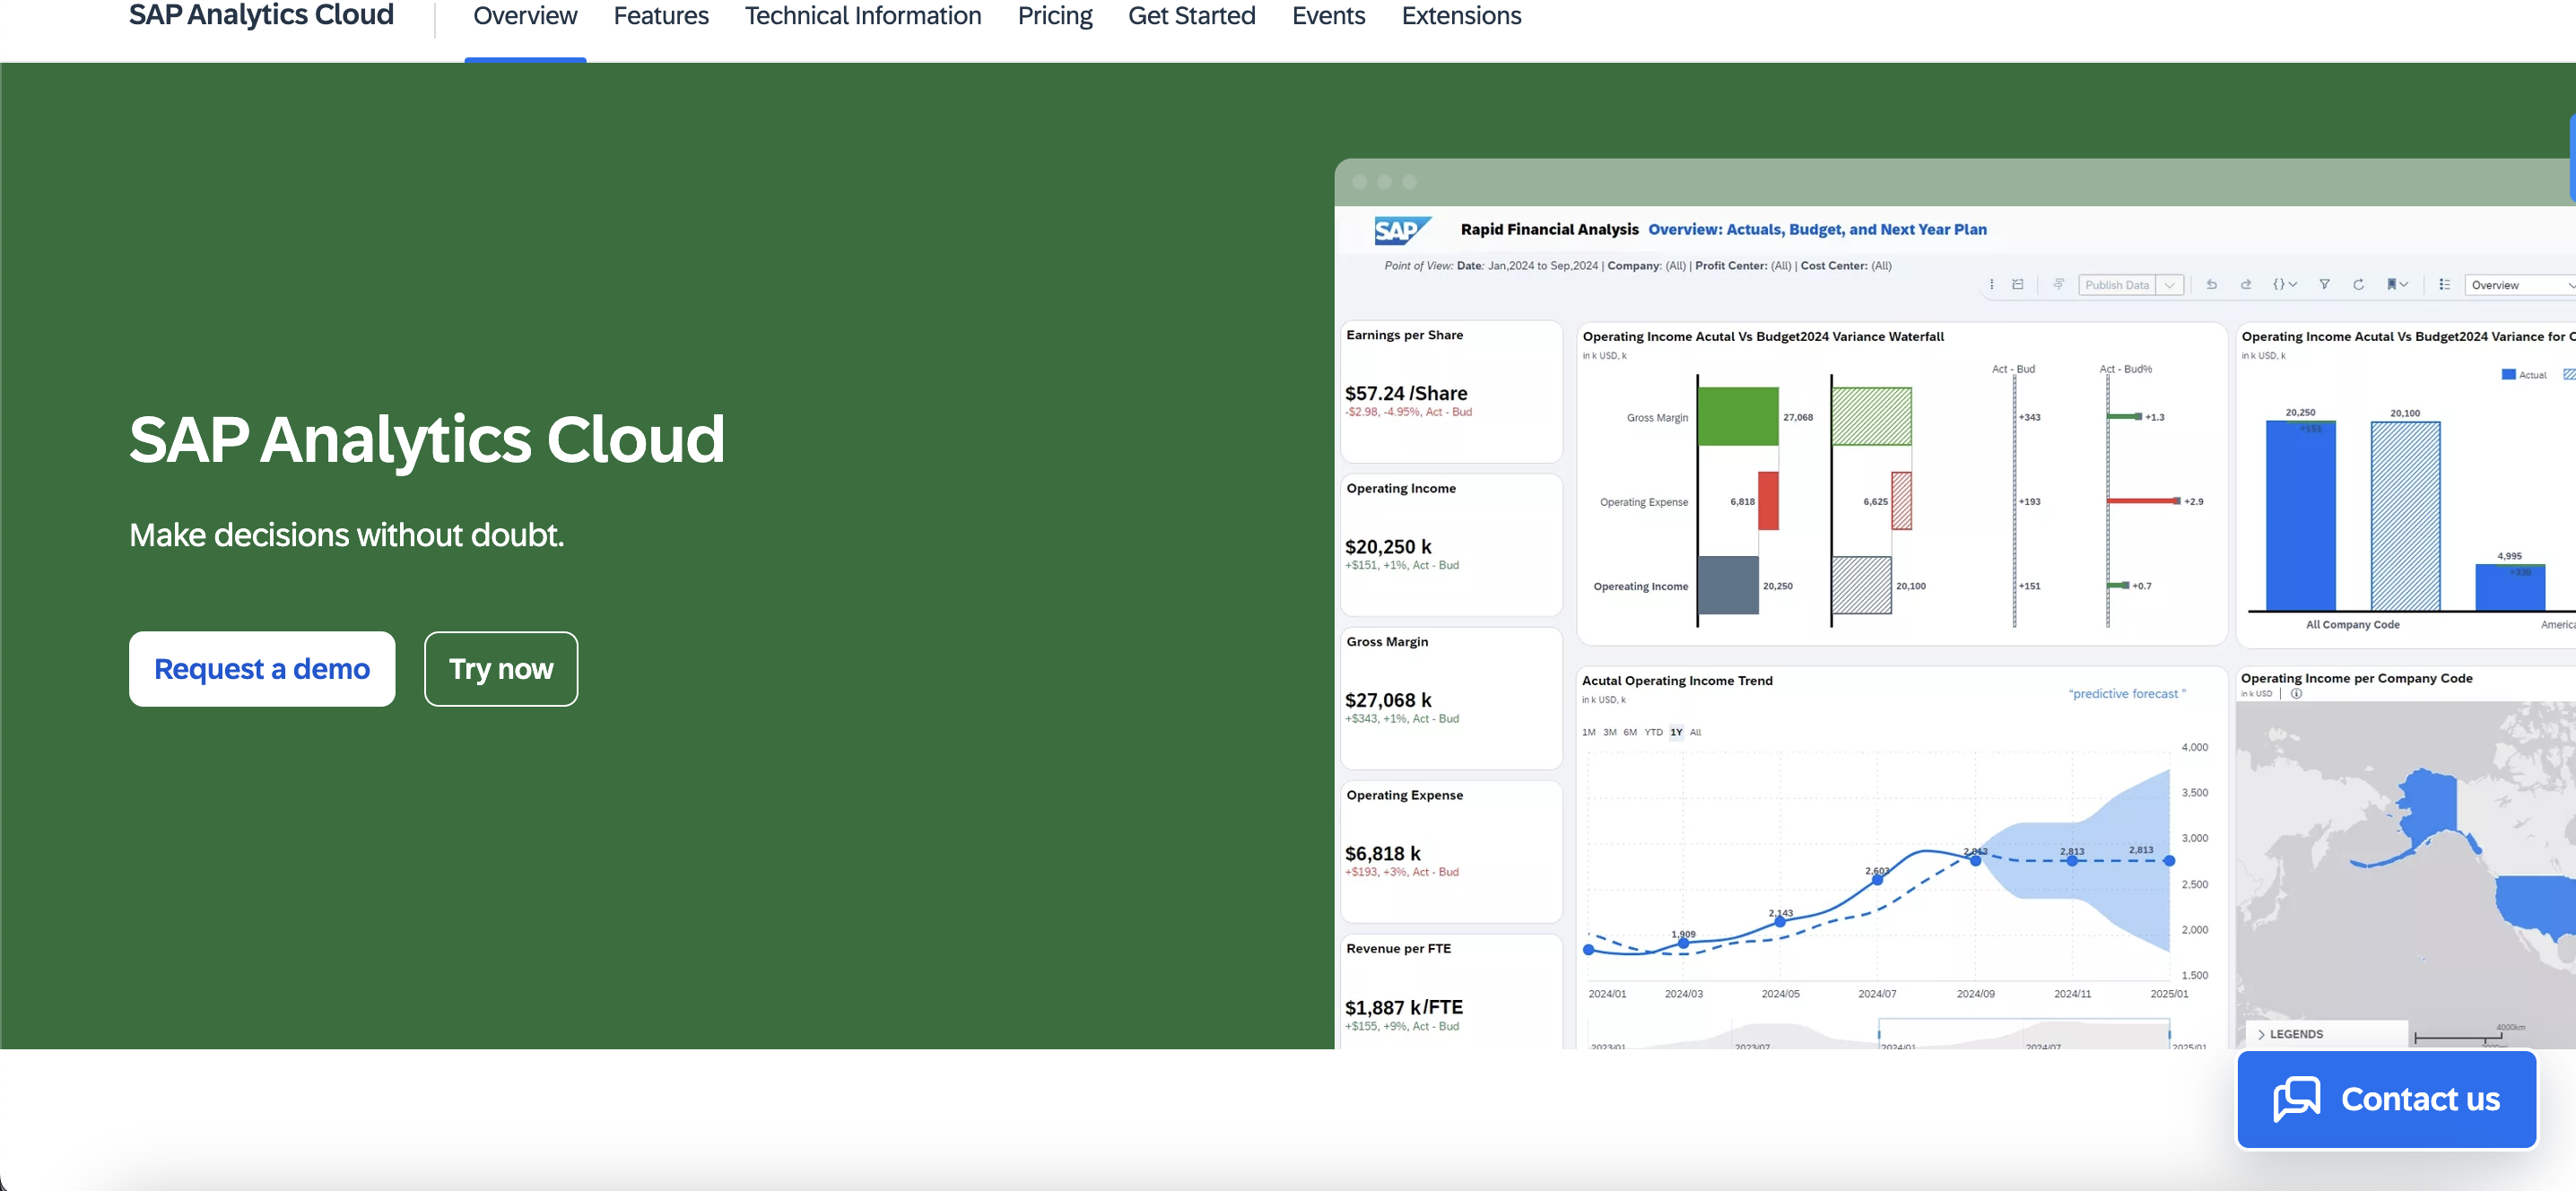
SAP Analytics Cloud is another Power BI competitor you can consider. It integrates BI, planning, and predictive analytics into a single platform, making it a versatile tool for comprehensive decision-making. It provides seamless integration with other SAP products for teams already invested in the SAP ecosystem, but businesses new to the platform might find that ecosystem restrictive.
Key Features of SAP Analytics Cloud
Integrated BI and Planning: Combines analytics with financial and operational planning tools.
Predictive analytics: Leverages machine learning to identify trends and patterns.
SAP ecosystem integration: Works seamlessly with other SAP products for organizations using SAP solutions.
Pros
Combines planning and analytics in one platform.
Predictive analytics for forward-looking insights.
Strong integration with the SAP ecosystem.
Cons
Best suited for organizations already using SAP products.
Advanced features may require additional training.
Pricing
30-day free trial
SAP Analytics Cloud for Business Intelligence - $396 user/year
SAP Analytics Cloud for Planning (Standard) - $1,200 user/year
SAP Analytics Cloud for Planning (Professional) - $14,100 user/year
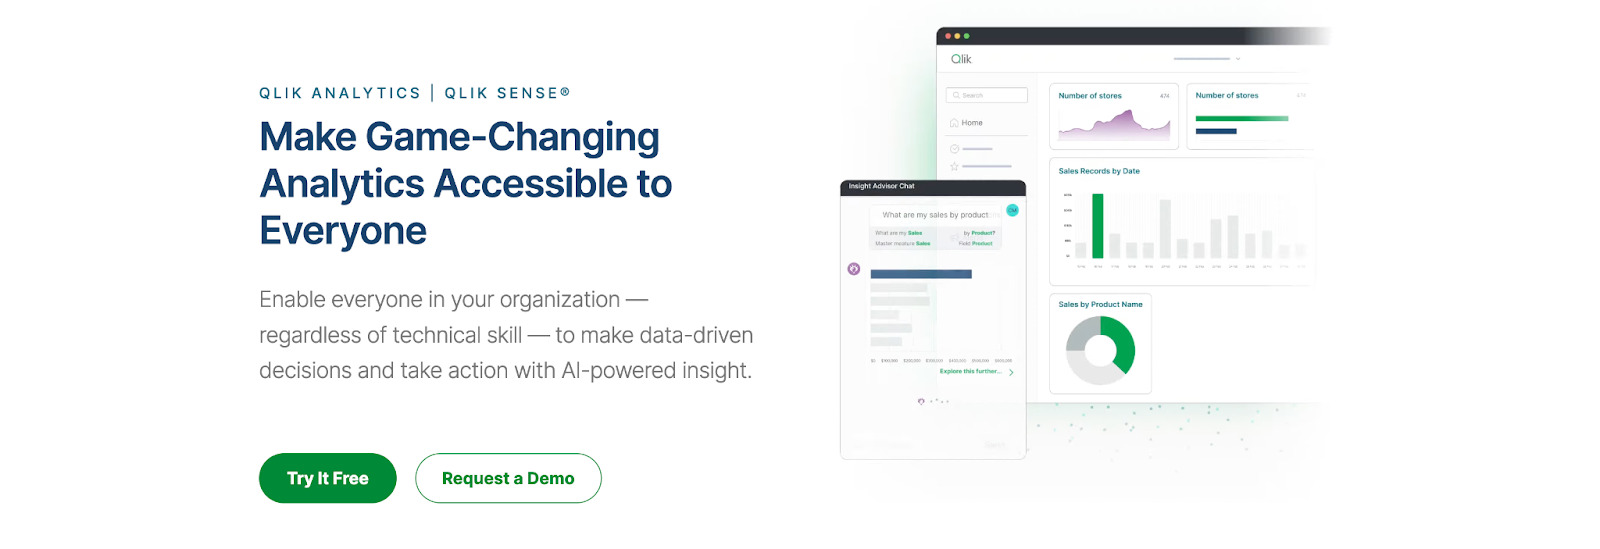
Qlik Sense is an alternative to Power BI that uses an associative data model to enable intuitive data exploration. It is especially useful for organizations that need to analyze complex datasets and find insights through flexible, interactive dashboards. However, its emphasis on associative data models may not suit organizations looking for standardized reporting workflows.
Key features of Qlik Sense
Associative data model: Allows users to explore relationships between data points intuitively.
Interactive dashboards: Provides dynamic visualizations with drag-and-drop functionality.
Live analytics: Supports live data updates for timely decision-making.
Pros
Enables intuitive exploration of data relationships.
Timely updates for immediate insights.
Customizable dashboards for tailored analysis.
Cons
Advanced analytics features may require additional expertise.
Performance may be impacted with very large datasets.
Pricing
30-day free trial
Standard - $825/month for 20 users
Premium - $2,500/month for 20 users
Enterprise - Custom
GoodData is a BI platform designed to help businesses embed analytics directly into their applications. It allows integration with various data sources, including data warehouses, which enables scalable analytics. While it supports large datasets, GoodData's setup and customization can be complex, and it often requires technical expertise for the initial configuration. This platform is most useful for businesses looking to centralize analytics within their existing workflows.
Key features of GoodData
Embedded analytics: Allows for integration of analytics within other applications.
Data warehouse integration: Works seamlessly with data warehouses.
Scalable architecture: Designed for businesses with large data volumes.
Pros
Good for embedding analytics into applications.
Scalable for larger data needs.
Easy integration with data warehouses.
Cons
Setup and customization may take time.
Requires technical resources for full implementation.
Pricing
30-day free trial
Professional - Custom
Enterprise - Custom
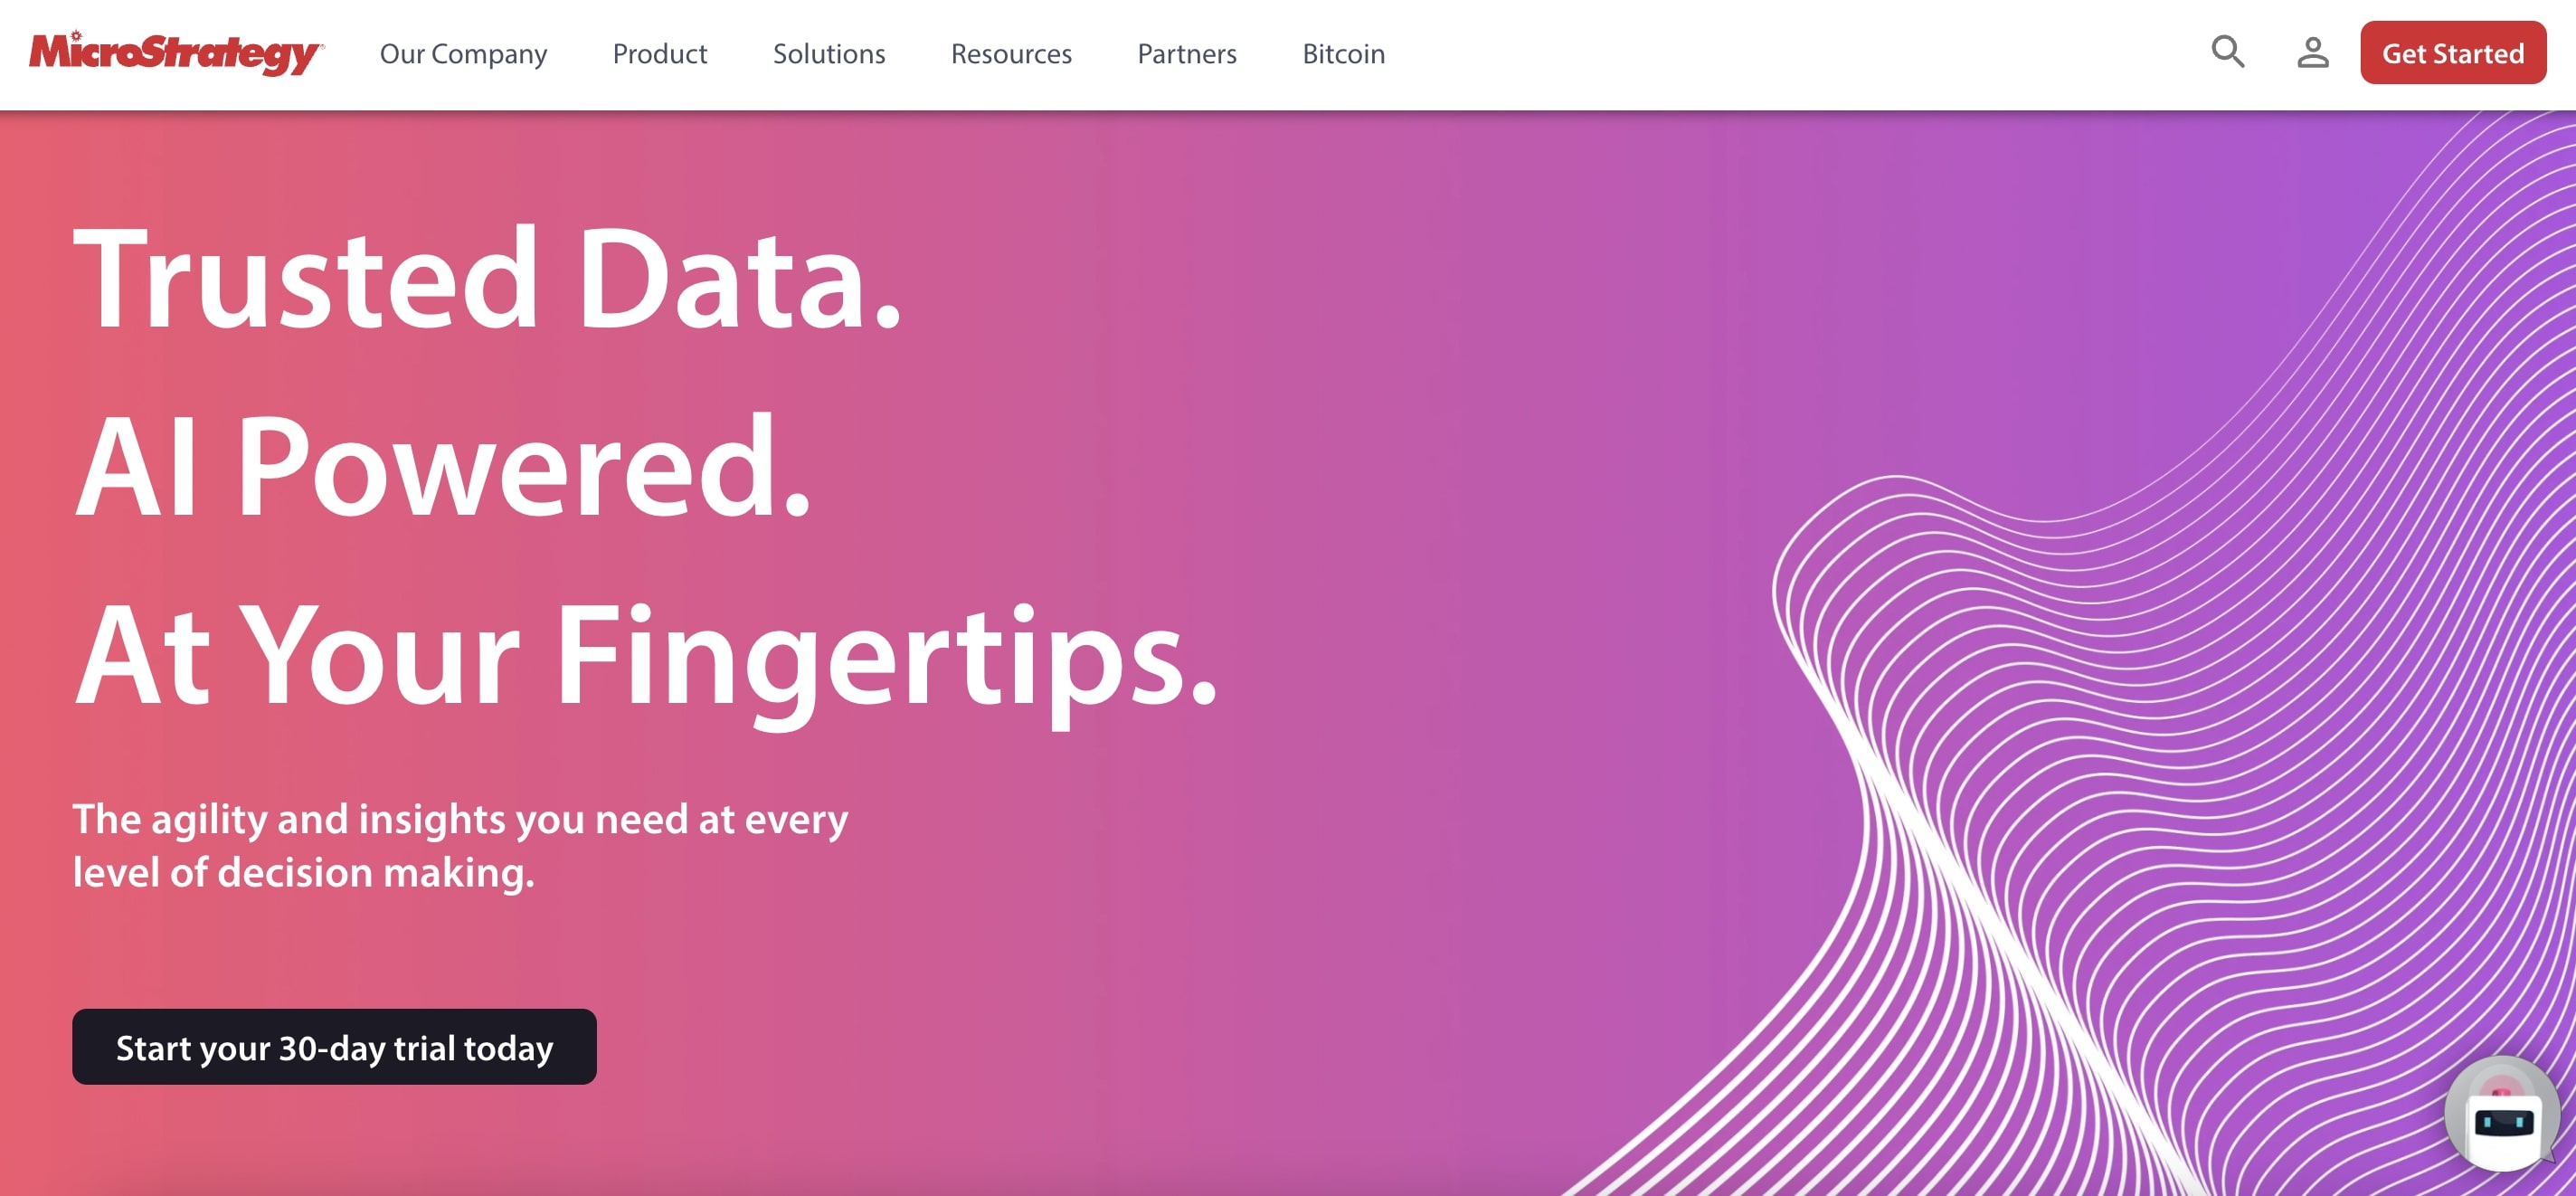
MicroStrategy is a BI tool that offers comprehensive analytics and reporting capabilities. Its strength lies in its ability to handle complex data visualizations and mobile BI, making it useful for large enterprises. However, the platform’s advanced features and enterprise-focused setup can be challenging for smaller businesses or those without dedicated IT support. Its high learning curve and technical setup can be barriers for teams with fewer resources.
Key features of MicroStrategy
Advanced data visualizations: Offers a variety of interactive and static visualization types.
Mobile BI: Provides access to reports and dashboards via mobile devices.
Security and governance: Ensures enterprise-level security for sensitive data.
Pros
Powerful reporting and data visualization.
Mobile access for on-the-go decision-making.
Strong data security features.
Cons
Complex implementation for smaller teams.
Requires significant technical resources to manage.
Pricing
30-day free trial
Basic - Custom
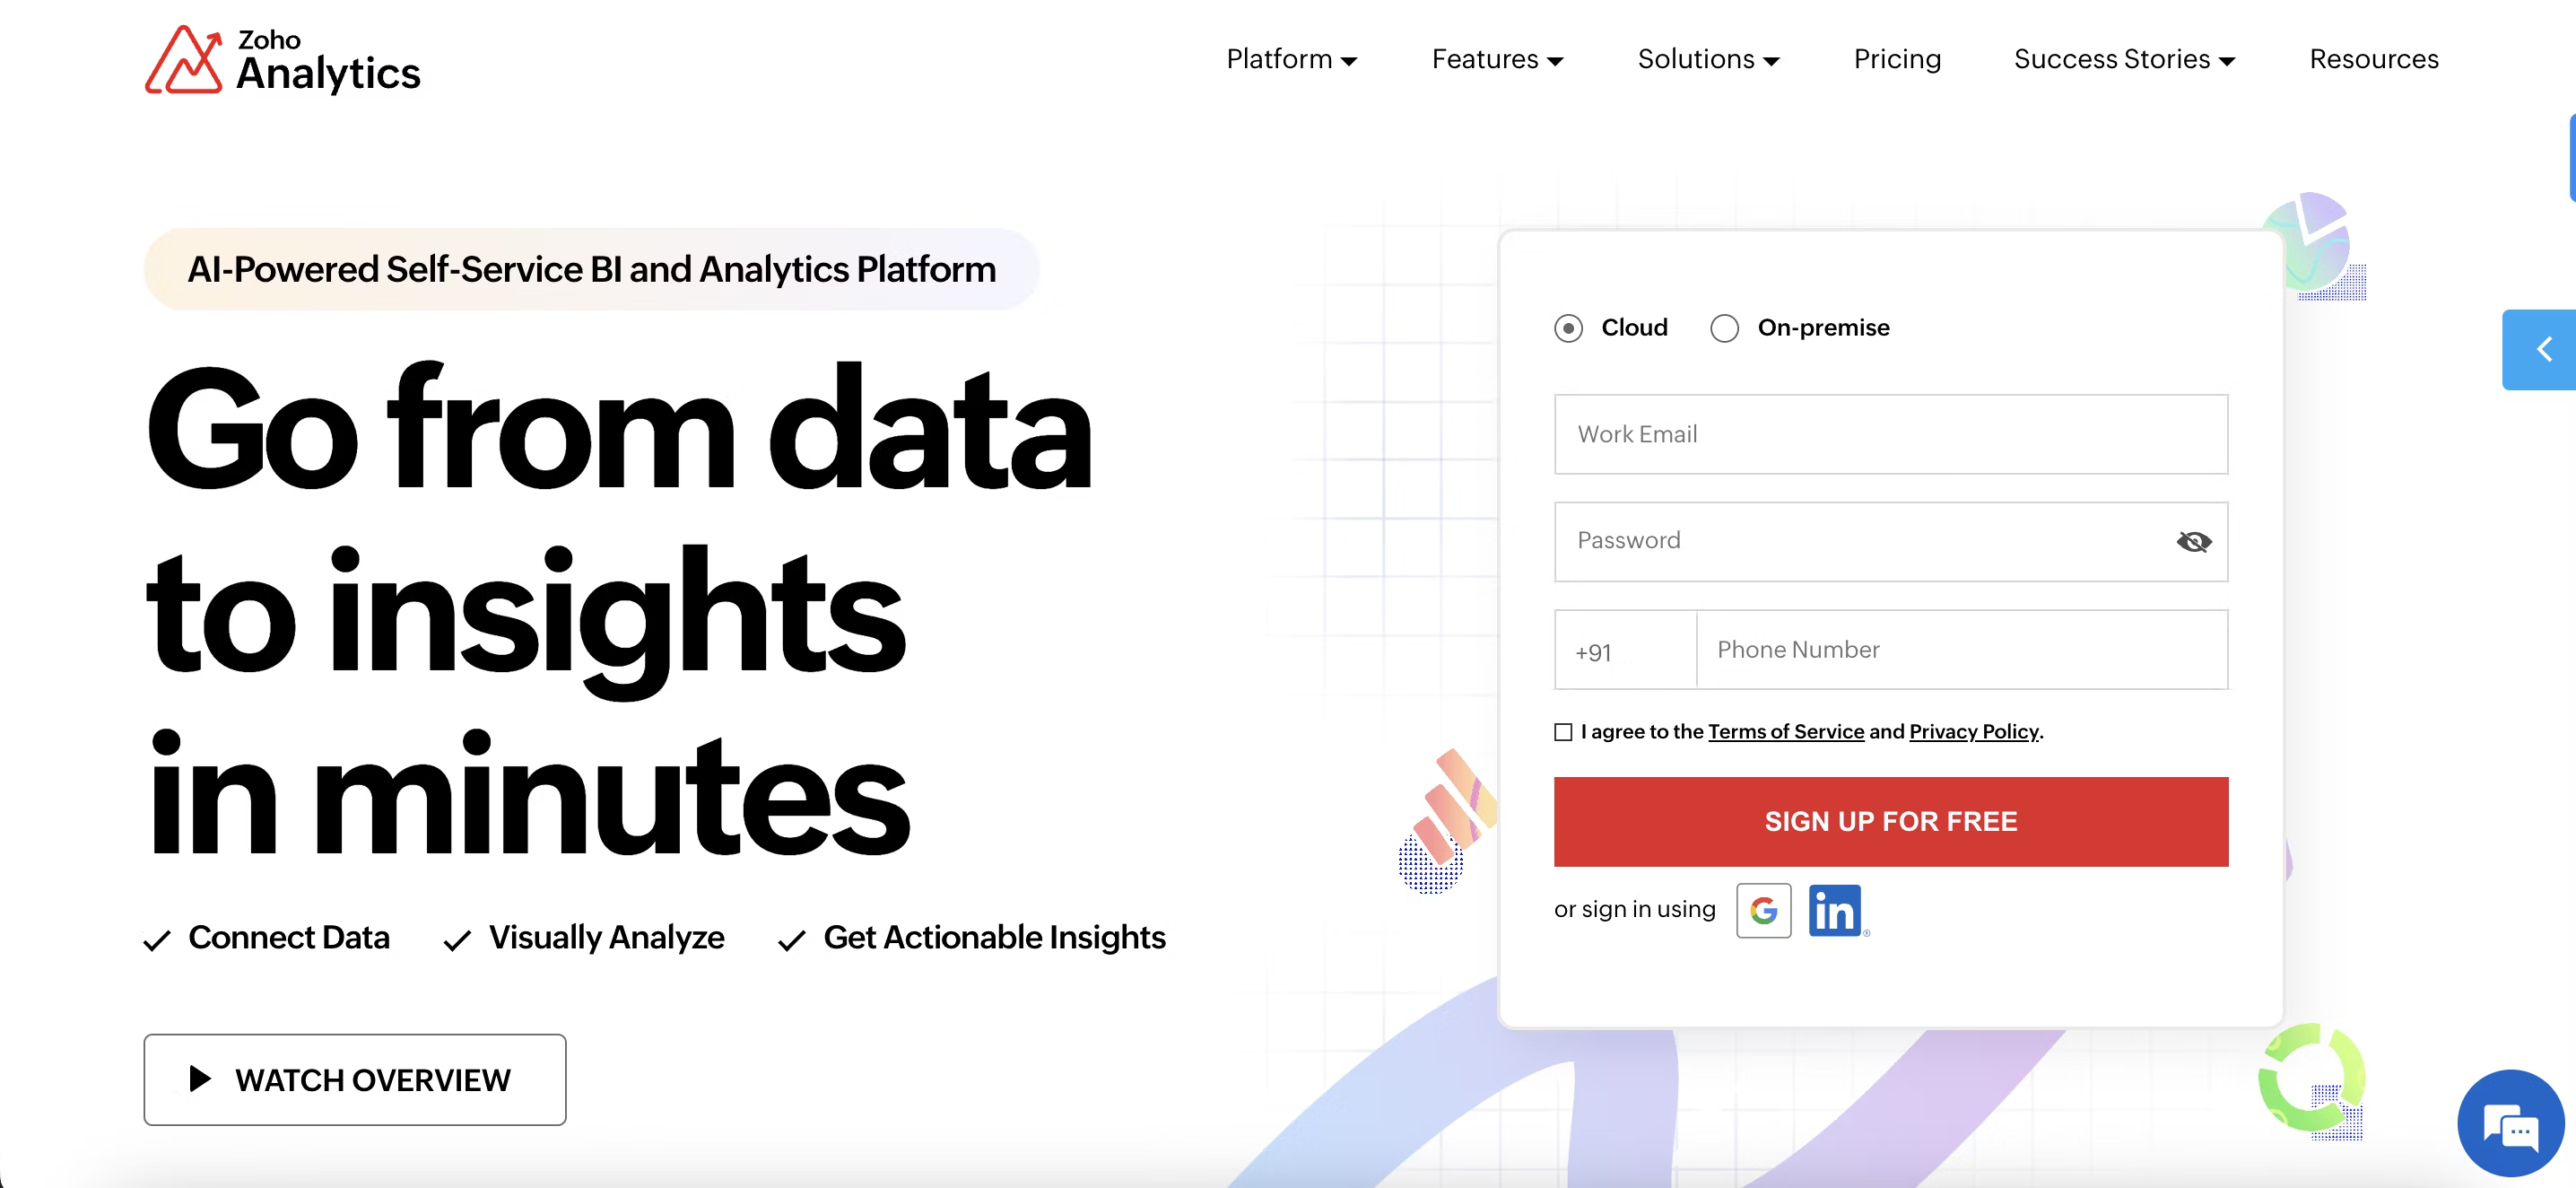
Zoho Analytics is a self-service BI tool aimed at users who want an easy-to-use platform for reporting and data analysis. Its drag-and-drop interface allows for quick report creation without technical skills, making it accessible to a broader audience. However, it may not offer the depth of customization and complex reporting that larger organizations need. While it works well for basic analysis, it might not scale as effectively for businesses with more complex needs.
Key features of Zoho Analytics
Drag-and-drop interface: Simplifies the creation of reports and dashboards.
Pre-built connectors: Facilitates easy integration with a variety of data sources.
Collaboration tools: Enables sharing and working together on reports.
Pros
Easy-to-use, intuitive interface.
Fast integration with data sources.
Good collaboration features for teams.
Cons
Limited customization for advanced reporting.
May not be suitable for larger, more complex data requirements.
Pricing
15-day free trial
Basic - $24/month for 2 users
Standard - $48/month for 5 users
Premium - $115/month for 15 users
Enterprise - $455/month for 50 users
Custom quotes are also available
Domo is a cloud-based BI platform that emphasizes data integration and dynamic reporting. It connects to a wide range of data sources and offers customizable dashboards that are regularly refreshed. While Domo is strong in providing immediate insights, its pricing may be a concern for small to mid-sized businesses. Additionally, scalability could be an issue for organizations that require more advanced analytics as their data needs evolve.

Key features of Domo
Instant data insights: Updates dashboards instantly.
Data integration: Connects with a wide range of data sources.
Customizable dashboards: Tailors dashboards to meet specific business needs.
Pros
Immediate updates for faster insights.
Easy data integration with various sources.
Customizable to meet specific needs.
Cons
Pricing may be prohibitive for smaller organizations.
Scalability could become a challenge as data grows.
Pricing
30-day free trial
Standard - Custom
Enterprise - Custom
Business Critical - Custom
Choose the Power BI alternative that fits your business
Getting the most out of your data starts with choosing a platform that actually supports your goals. While Power BI works well for basic reporting and dashboards, its limitations in scalability and flexibility might slow your business down.
ThoughtSpot, on the other hand, offers an intuitive, AI-powered search and self-service analytics solution designed to make data accessible to everyone. With its strong customization options, ease of use, and powerful insights, ThoughtSpot empowers you to make confident, data-driven decisions.
Discover how ThoughtSpot can simplify data exploration and boost your analytics–sign up for a free trial!


