When it comes to choosing the right business intelligence (BI) tools, Tableau and Power BI often find themselves at the center of a debate. Just like the never-ending question of whether pizza or pasta is the ultimate favorite, opinions on these platforms tend to be strong and divided. But objectively speaking, which one truly comes out on top? Or more importantly, do either of them fully meet specific business objectives?
Below, we’ll explore how two of the most popular BI platforms—Tableau and Power BI—stack up against each other. We’ll dive into a comprehensive comparison, including their features, strengths, pricing, and limitations, to help you confidently choose a platform that best meets your business needs.
Table of contents:
- What is Power BI?
- What is Tableau?
- Power BI vs Tableau: Comparison matrix
- Power BI vs Tableau: Value comparison
- Power BI vs Tableau: Pricing
- Power BI vs Tableau: Advantages and disadvantages
- Gartner MQ report 2024: Where do Power BI and Tableau stand?
- Alternatives to Power BI and Tableau
- Data visualization is not business intelligence
- FAQs
Power BI is Microsoft’s BI offering built for “power” users—which is more-often the analyst archetype. Power BI describes itself as a unified, scalable, enterprise business intelligence platform that allows organizations to connect to and visualize their data. They consistently add features to keep up with the speed of innovation. That’s why Azure customers who consider themselves a “Microsoft shop” often tell us that using PowerBI for analytics is a no-brainer.
Tableau is a visual analytics platform. They are known for being a world-class data visualization and BI reporting solution, allowing analysts to buld pixel-perfect dashboards that tell data stories. It’s an incredibly powerful tool in the hands of a data analyst which makes it one of the best Power BI alternatives.
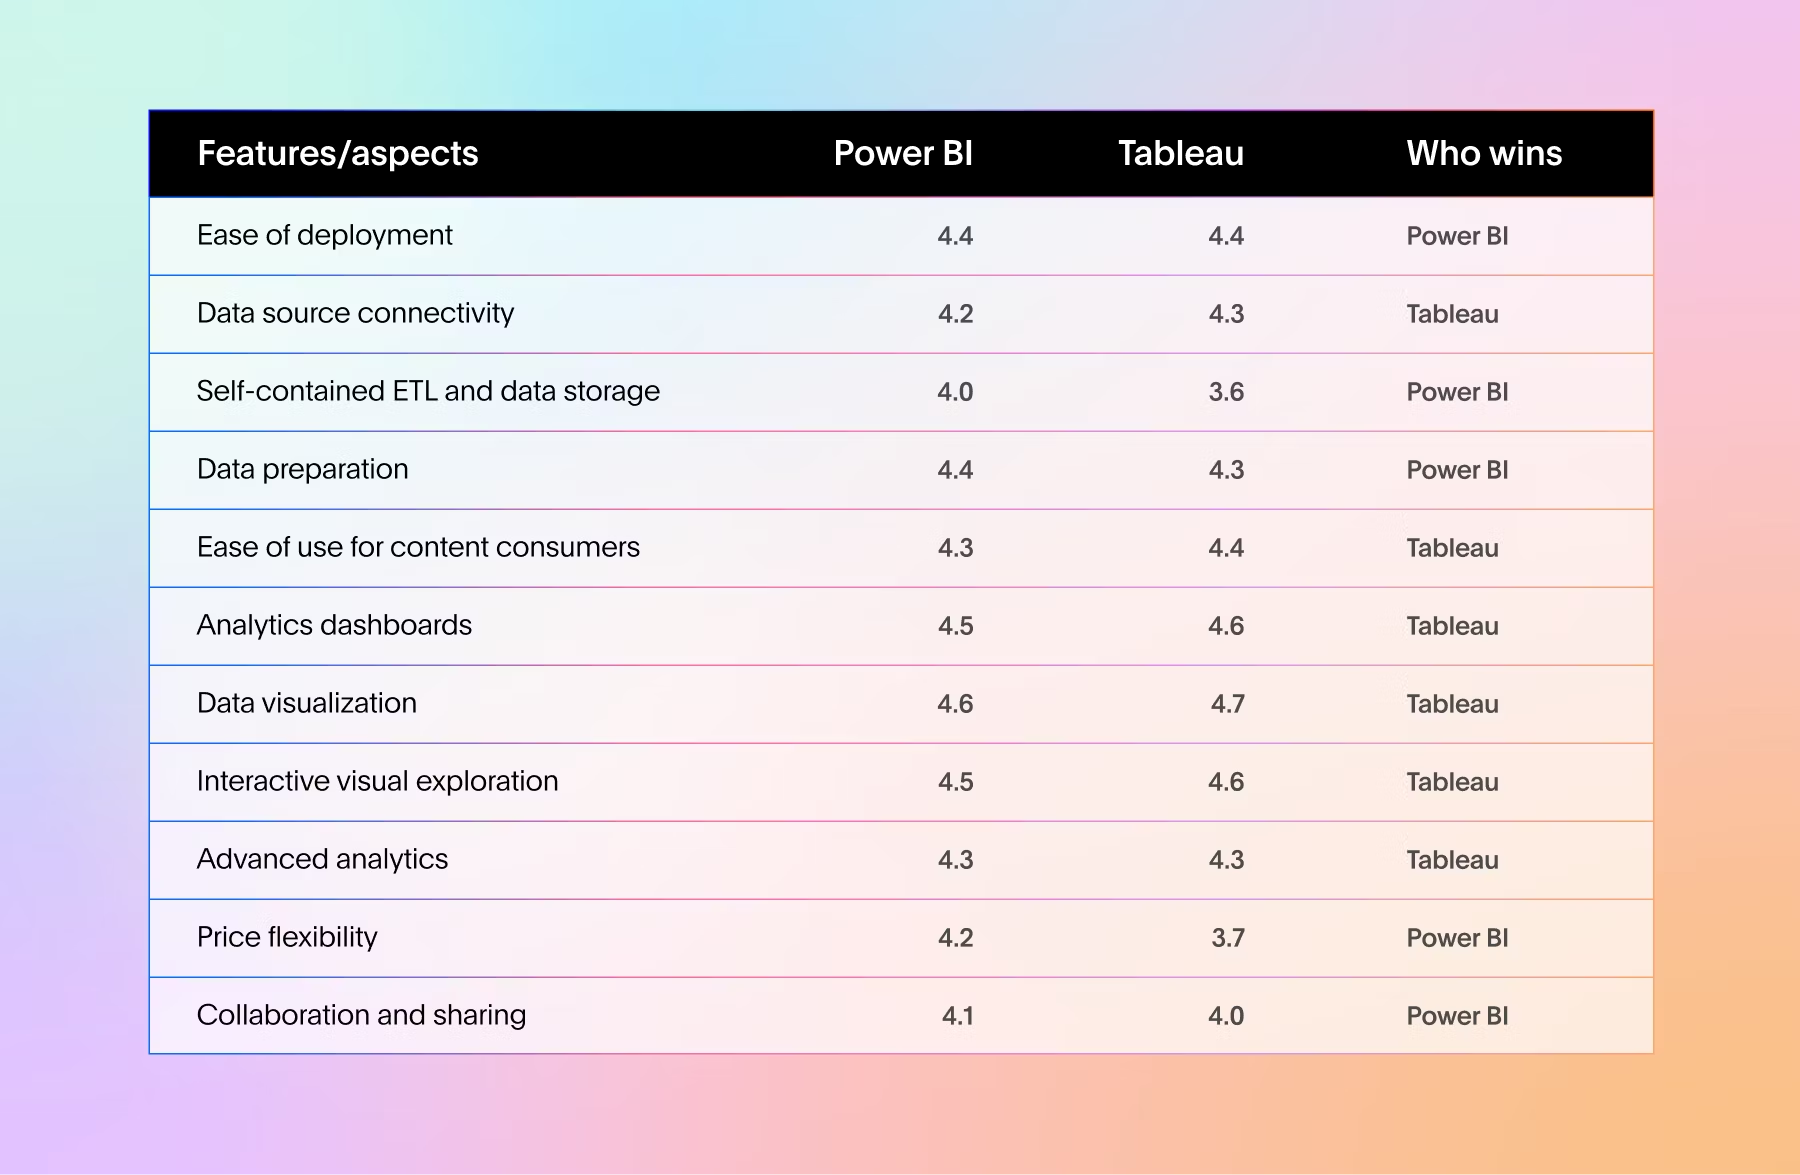
Now that we've thoroughly examined how both platforms measure up, let’s look at how business users on Gartner Peer Insights have rated their experience with Power BI and Tableau:

When it comes to market share, Tableau vs Power BI both hover anywhere from 15%- 20%. At face value, these two rivals might seem pretty well matched. But depending on your specific organization’s needs, one tool might be a clear leader. Let’s do a quick comparison of some of the top features data professionals are looking for today.
User interface
While comparing Power BI vs Tableau in terms of user interface, Tableau has a naturally intuitive drag-and-drop interface. This makes it easy for data experts to create visualizations. Tableau offers a wide range of capabilities to customize the look and feel of visualizations along with formatting options.
Power BI has a similar interface to other Microsoft products. So, if you are used to working with Excel, Word, and other productivity tools, it will be more familiar to you. However, the user-experience for creating in PowerBI is considered more complex by a majority of users. So, it often takes more time for users to adopt than Tableau.
Data sources
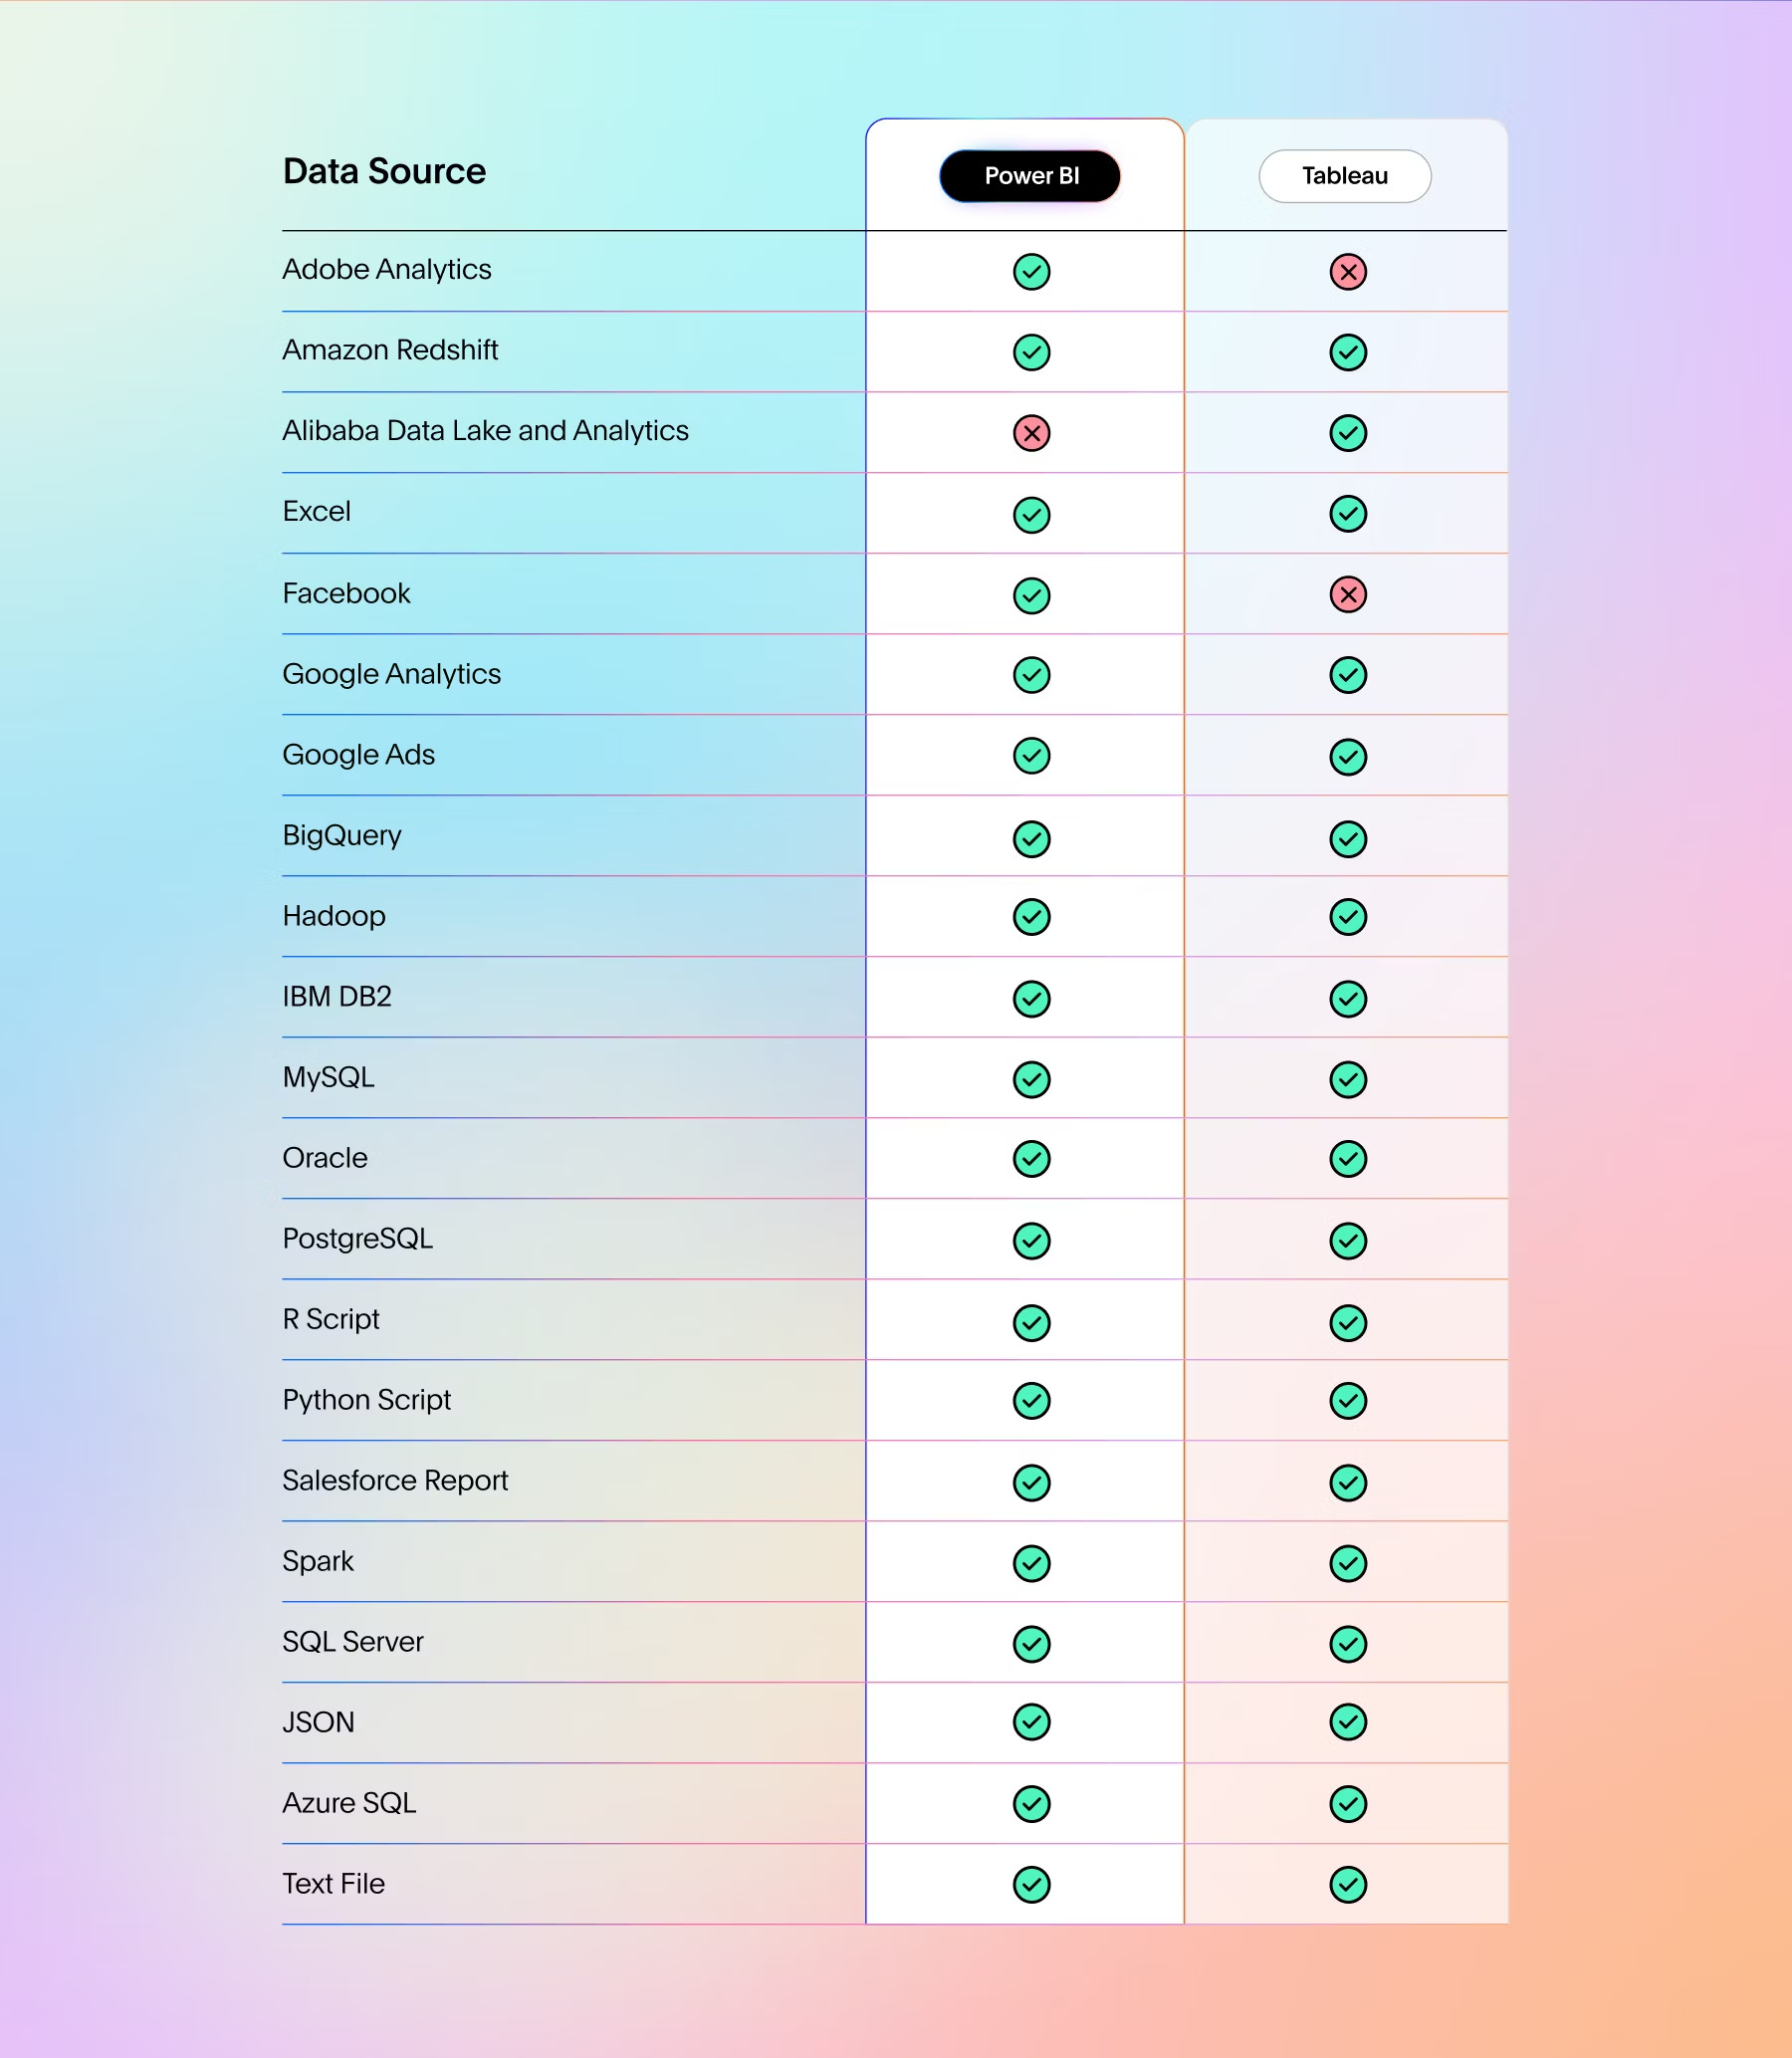
Many public reviewers noted that Tableau's connectors are more performant, and built for live-query of a cloud data warehouse. Power BI's query manager and planner struggles at scale, which can result in slower dashboards depending on the size and complexity of the data being analyzed.
Power BI has slightly fewer connector options for users, but is designed to work well with Microsoft data sources like Excel and SQL Server. Here's a full list breakdown of data source comparison (source):

Visualization
This is the area Tableau is more known for. It offers a wide range of charts and visualization options including: bar charts, line charts, scatter plots, and geographic maps. Tableau also offers advanced visualization options, such as treemaps and bubble charts, that can help users visualize complex data sets.
While Power BI offers a wide range of chart types, it's more limited to Tableau in terms of the number of customizations available. That as it is, Tableau is the leader for data professionals who want to painstakingly control every pixel and color in their dashboard.
Analytics
In the analytics arena, let us first examine how each vendor compares on advanced analytics. Tableau is strong for technical users who need advanced analytics, including the ability to create calculated fields, perform statistical analysis, and forecasting. Tableau also allows hardcore users to leverage more data-science-centric use cases like clustering, trend analysis, and more.
Power BI’s calculation language, DAX, results in rigid formulas. VisQL, Tableau’s counterpart, is reported to be more efficient—driving better query efficiency and faster visualization load times.
All in all, any highly-skilled technical user should be able to get value from either of these solutions. But what about non-technical users on the self-service analytics side? That’s a much taller order.
Performance
Now, let's compare Power BI vs Tableau in terms of performance. Tableau was designed to handle enterprise-size data sets. They added in-memory caching capabilities to speed up queries, and their performance is compatible with multi-core processors, which help users work with data more speedily.
Furthermore, Tableau does not limit the number of data points in a visualization for the user. They also do not enforce row or size limitations, giving you a broad view of the data. Power BI has in-memory capabilities as well, but public benchmarks show that it tends to slow down while handling bulk data.
Pricing models often fluctuate, so we encourage you to research pricing directly with Power BI and Tableau experts. That said, here's what we know from general industry knowledge, customers, and reports like the Gartner Magic Quadrant:
Power BI plans
Power BI offers various pricing models depending on several factors, such as the total users, your model size limit, how often your data refreshes, and other premium features that may or may not be important to your business. Here are four popular pricing models based on the level of access and functionality each user receives:
Power BI free plan: This free individual plan allows you to access Power BI on your desktop and create dashboards and reports. However, it limits access to advanced analytical features and restricts real-time report sharing.
Power BI Pro—$10.00 user/month: For those who already hold Microsoft 365 E5 and Office 365 E5 accounts, this plan is available at no extra cost. However, others must subscribe for $10.00/month to create dashboards, generate KPI reports, and share insights across their organization. This plan is best suited for small organizations with dedicated data teams.
Power BI Premium Per User—$20.00 user/month: Mid-sized companies and enterprises opt for this plan. This plan allows users to access larger model sizes with more frequent data refreshes. As you scale the number of users accessing data, your licensing cost will also increase.
Power BI embedded—Variable pricing: Organizations wanting to embed BI capabilities such as data visualization and analytics into their applications can opt for this plan. The pricing may depend on the number of users of the application.
💡Important note: Power BI’s suite of AI capabilities, Copilot, is limited to Premium license holders or specific Fabric licenses, which can further increase your overall licensing costs.
Tableau plans
Compared to competitors like ThoughtSpot and Power BI, users on G2 and Gartner Peer Insights report that Tableau’s subscription costs quickly add up. That said, Tableau’s pricing is primarily based on the number of named users licensing the system. Here are five main tiers:
Tableau Creator: This license is for data power users who need a complete suite of analytical tools for data exploration, visualization, and reporting. It includes access to Tableau Desktop for building and designing dashboards, Tableau Prep Builder for preparing and shaping data, and comes with one Creator license for Tableau Server and Tableau Pulse.
Tableau Explorer: This license is built for users who perform simple analyses on existing data sources, but are not concerned with preparing or modeling underlying data. Tableau Explorer is only available on the Cloud or Server.
Tableau Viewer: This license is meant for users who only view Tableau dashboards and reports. Users cannot create or modify any dashboards or reports. This license has a minimum requirement of 100 users.
Tableau Enterprise: This plan offers individual licenses that are ideal for users who want wide-scale access to analytics. The advanced software package is available on Tableau Cloud and Tableau Server. Also, when you opt for an enterprise plan, the pricing in the three buckets also changes.
Tableau+ plan: By far the most expensive option, this variable-cost plan infuses Tableau's latest augmented analytics functionality into analytics workflows.
💡 Note: For an accurate pricing estimate, users must reach out to Tableau directly.
Power BI advantages
Power BI has garnered a substantial user base for its merits. Some of those include:
Integration with Microsoft ecosystem: Power BI integrates with other Microsoft products like Excel, Azure, and SharePoint, allowing users to pull data from these sources directly into the platform.
Extensive visualization options: The platform offers a variety of data visualization options, from basic charts to interactive maps. Its drag-and-drop interface helps users customize these visualizations, allowing them to create dynamic business dashboards and reports.
Sharing and collaboration: Power BI users can share dashboards and reports with licensed viewers, through OneDrive, and via Microsoft Teams.
Power BI disadvantages
Although Power BI is popular among analysts, the platform comes with its own set of challenges. Here’s what users have reported:
Built for MSFT power users: For business users, leveraging Power BI’s advanced analytical features can be challenging as it often requires extensive training. This complexity can be discouraging for non-technical users or those new to the Microsoft ecosystem.
Performance gaps: Power BI users have often reported poor performance on large data volumes. Also, users find mature data analytics capabilities, such as predictive modeling and machine learning integration quite limiting.
Expensive to scale: Power BI licensing costs can quickly escalate when you are adding advanced functionalities to the mix. Moreover, users have reported that Power BI Desktop slows down in terms of performance particularly when dealing with substantial datasets or complex calculations. That’s why people are always looking for Power BI alternatives.
Tableau advantages
Because of its long-standing history, Tableau is a favorite among technical users. It is favored mostly because of the following features:
Flexibility for visualizations: Tableau allows users to create ‘pixel-perfect’ visualizations, helping them customize their look and feel with various formatting options. However, with that level of granularity comes complexity—which is why business users may struggle to fully leverage the platform.
Connects with multiple data sources: The platform can connect to various data sources, such as databases, spreadsheets, and cloud services.
Control of content: Tableau allows analysts to serve up data in a well-controlled environment and restrict the level of detail that other users can see.
Tableau disadvantages
Today’s fast-paced businesses must empower everyone—from business teams to technical teams—to find insights from their data. However, users often find Tableau lacking in certain areas, which can hinder data-driven decisions.
Data processing times: In the case of large datasets, users complain that data processing times can increase significantly. These slower processing times can hinder timely decision-making, driving up opportunity costs and shifting focus away from high-value initiatives.
A steeper learning curve: From initial set-up to analyzing large datasets, non-technical users require extensive training to utilize core features and use cases.
Scalability issues: High licensing costs can make scalability difficult. Moreover, the cost of accessing advanced analytics features can quickly add up.
In the 2024 Gartner Magic Quadrant for Analytics and Business Intelligence Platforms, both Power BI and Tableau are positioned in the Leaders quadrant. Now, let’s take a closer look at Gartner’s assessment of each vendor, examining their respective strengths and weaknesses:
1. Power BI
The report highlighted that over the last four years, Power BI has made significant inroads in the BI market due to standard prices, comprehensive functionality, and tight integration with the Microsoft ecosystem that includes Microsoft 365, Azure, and Dynamics.
However, as the analytics landscape evolves, there is an increasing demand for more interoperability with competitive platforms. Also with the launch of Copilot, it is becoming difficult for the platform to enforce standard data governance practices—raising security concerns. An inconsistent data governance policy can reduce efficiency across the organization. Even worse, they can lead to inaccuracies that drive poor business decisions.
2. Tableau
Tableau remains a leading visual analytics tool, enabling users to access, prepare, analyze, and present findings in their data. The platform has also introduced Tableau Pulse, an augmented analytics experience designed for business users.
The report says that while Tableau is an established player, GenAI has yet to become a fundamental component for all users of the platform. While adding Tableau Pulse to its augmented analytics capabilities demonstrates Tableau’s attempt to innovate, it still needs to demonstrate the impact and reach of these capabilities.
With GenAI sparking the rebirth of data analytics, almost every notable BI vendor, including Power BI and Tableau, has come forth with a plan to integrate Generative AI into their tools. We’ve seen promises of chatbots, auto-generated insights, and natural language search, but only a few Power BI and Tableau alternatives truly delivered. Amongst them, ThoughtSpot emerges as a true leader.
ThoughtSpot’s approach to AI-driven analytics has always been to deliver an experience designed for everyone. Spotter, the AI Analyst for everyone, allows anyone—from marketers and sales executives to IT and data teams—to ask a business question and get answers in seconds. Here’s how ThoughtSpot’s AI-Powered Analytics stands out from the rest of the pack:
GenAI-powered self-analytics: Legacy BI tools may provide answers to someone’s first query, but not the next. ThoughtSpot delivers a true self-service analytics experience that empowers users to ask the next and the next question—without going back to the data team. Ask questions in natural language with an intuitive chat experience and gain relevant insights within seconds. With interactive Liveboards, users can access real-time insights, and drill anywhere to answer the next question.
Complete analytics platform: The overall TCO for Tableau and Power BI is high since customers have to spend a lot of resources building and maintaining dashboards. In contrast, ThoughtSpot stands out as a unified analytics platform with a powerful AI-driven experience, empowering all users to interact with data on their own terms.
Leverage augmented analytics: Uncover meaningful answers however you want to do it—whether code-first, low-code, or code-free in natural language. Advanced analytics is no longer reserved for analysts and data scientists - any user can leverage SpotIQ to discover how key metrics have changed, why they have changed, and explore possible outcomes.
Ease of embedding: Using Tableau and Power BI to build in-app analytics can be complex and time-consuming. ThoughtSpot Embedded (TSE) is a developer-friendly, low-code, embedded analytics platform that empowers product leaders and developers to build tailored analytics experiences into any web application.
Robust security, compliance, privacy, and governance: Manage and enforce how your data is used by anyone across your organization with enterprise-grade semantic layer and access controls. ThoughtSpot also includes human-in-the-loop capabilities that ensure relevancy, accuracy, and oversight.
As the 2024 Gartner MQ recognizes ThoughtSpot as a leader in the BI and analytics space, we continue our commitment to building a fact-driven world, where customers go from insights to action. By freeing you from uninspired number crunching and hard coding, you and your entire team can discover the unthinkable and do the impossible.
You need insights to drive business results. But if your data sits lifeless on a dashboard, will your stakeholders ever know its value? To truly facilitate data-driven decisions, you need an AI partner that empowers you to initiate action. ThoughtSpot is that partner.
With decision-ready insights and enterprise-grade trust experiences, ThoughtSpot ensures that users can personalize their data experience—the way they want, ensuring they’re always making the most of their data.
Is Tableau better than Power BI?
Deciding whether Tableau is better than Power BI depends on your unique needs and priorities. Both platforms have their own strengths and potential drawbacks. To make an informed decision, start by evaluating your specific requirements, budget, and current technology stack, and then compare the features of each platform in light of those factors.
What is Tableau used for?
Tableau is a data visualization tool that allows users to build interactive and visually appealing dashboards, displaying complex data in an easily understandable format.
Does Power BI require coding?
Power BI often requires coding for advanced modeling and data discovery.
What’s better than Power BI?
While Power BI offers powerful data visualization capabilities, that alone is not enough to gain actual insights from your data. To drive business outcomes, you need an AI-powered solution like ThoughtSpot that allows everyone to go from insight to action. With powerful augmented analytics features and an AI-driven search experience, ThoughtSpot enables deeper exploration till users get the data story just the way they want it. Read this list of Power BI alternatives to make an informed decision.
What is Tableau’s pricing?
Tableau offers a range of pricing tiers, from Tableau Creator to Tableau Viewer, catering to different user needs. The platform also provides enterprise pricing options, which may not be the most budget-friendly option for small or mid-sized businesses. For precise pricing details, we recommend contacting Tableau’s team directly.


