


Your business has unique data needs, but not every BI tool is flexible enough to meet them.
Sigma offers a structured, spreadsheet-style interface that can feel familiar if your team is used to Excel. But when you need customizable dashboards, AI-powered insights, or real-time collaboration, it can start to feel limiting. Instead of analyzing data, you’re stuck wrestling with rigid workflows and slow performance.
If your analytics tool isn’t adapting to the way you work, it’s time for a change. We’ve rounded up the top Sigma competitors and alternatives to help you choose a solution that aligns with your team’s workflow.
Where does Sigma fall short?
Based on reviews from G2 and industry feedback, here are some common pain points:
Limited AI and automation: Sigma lacks the advanced AI-driven insights and automation compared to modern BI tools like ThoughtSpot or Power BI.
Performance challenges with large datasets: While the platform connects to cloud warehouses, real-time querying can be slow, especially with complex calculations.
Rigid dashboards: Compared to other BI tools, Sigma’s dashboards offer less flexibility in terms of customization and interactivity.
Steep learning curve for advanced features: While the spreadsheet interface is familiar, building complex reports often requires SQL knowledge.
Collaboration limitations: Sharing insights and building collaborative reports can feel clunky compared to other modern BI platforms.
Top 6 Sigma competitors & alternatives
- ThoughtSpot — Best for AI-powered search and self-service analytics
- Sisense — Best for embedded analytics and low-code customization
- Tableau — Best for advanced data visualization and dashboarding
- Power BI — Best for Microsoft integration and cost-effective BI
- Qlik Sense — Best for associative data modeling and real-time insights
- Looker — Best for centralized data governance and Google Cloud integration
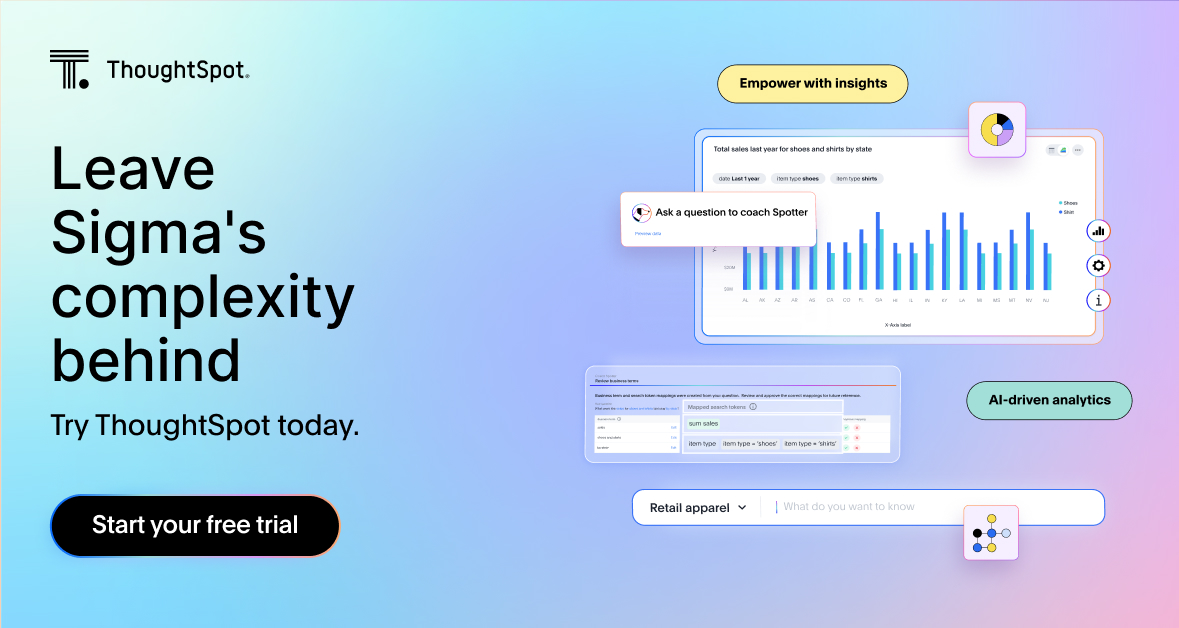
ThoughtSpot is designed from the ground up to deliver seamless, scalable embedded analytics. Whether you're building customer-facing dashboards or integrating AI-driven insights into your application, ThoughtSpot makes it easy to provide interactive, self-service analytics without heavy development overhead.
Unlike Sigma, which primarily extends spreadsheet-style workflows to embedded experiences, ThoughtSpot takes a search-first, AI-powered approach. You don’t need to rely on complex formulas or pre-built reports—anyone can explore live data, spot trends, and get contextual insights instantly.
To meet your analytics needs, ThoughtSpot offers two core solutions:
ThoughtSpot Embedded: A developer-friendly solution that integrates AI-powered analytics into any web application or workflow.
ThoughtSpot Analytics: A self-service platform that lets anyone create and share insights using AI and natural-language search.
Key features of ThoughtSpot
Generative AI with Spotter: Get answers from your data instantly. Spotter, your AI Analyst, helps you dig deeper and sends real-time alerts so you never miss a key insight.
Intelligent dashboards: Your data moves fast, and your dashboards should keep up. ThoughtSpot's AI-Augmented dashboards refresh automatically, so you never have to second-guess your numbers.
Advanced data modeling: Connect, customize, and automate your data workflows with ease. ThoughtSpot works with 20+ cloud platforms and supports TML for deeper control.
Enterprise-wide connectivity: Keep your data in sync. ThoughtSpot works with your existing cloud and business apps, so you get a smooth, unified analytics experience.
AI-driven data prep: Spend less time cleaning data and more time finding insights. Analyst Studio’s AI-powered tools help you prep data quickly with SQL, Python, and R.
Pros of ThoughtSpot
AI-powered search simplifies data exploration.
Self-service analytics lets teams find insights without relying on data experts.
Easy cloud integrations create a connected analytics experience.
Real-time updates keep your decisions timely and data-driven.
Cons of ThoughtSpot
Some advanced features, like custom data modeling, may require additional training to be fully utilized.
Frequent updates bring new capabilities, but staying up-to-date can take some effort.
Pricing
14-day free trial
Essentials: $62.5/user/month
Pro: Custom
Enterprise: Custom
Sisense is a BI and analytics platform designed for data exploration, visualization, and embedded analytics. With natural language querying (NLQ) and a low-code interface, it’s accessible to business users who want to create insights without deep technical expertise.
You can connect Sisense to cloud data warehouses or use its ElastiCube storage engine, depending on how you want to manage your deployment. While it makes building dashboards and reports relatively easy, some users find its data modeling capabilities less advanced than other tools in this space.
Key features of Sisense
Data connectivity: Connect to cloud data warehouses, on-prem databases, and third-party applications.
Low-code interface: Create dashboards, reports, and widgets without extensive technical skills.
APIs and SDKs: Customize workflows and integrations to enhance functionality.
Git integration: Use version control to track changes and manage custom analytics code.
Pros of Sisense
AI-powered exploration and automated insights make it easier to identify trends.
Embedded analytics allow you to integrate dashboards into applications or websites.
Handles complex data processing efficiently, making it suitable for organizations with growing data needs.
Cons of Sisense
Advanced analytics may require more technical expertise.
Performance can lag when working with large datasets or complex queries.
Some features come with a steep learning curve.
Pricing may be expensive, particularly for small to mid-sized businesses.
Pricing
Free demo available
Platform pricing - Custom
Tableau is often considered an alternative to Sigma Computing because both platforms focus on data visualization and analytics. They enable teams to explore and present data in an interactive way, making insights more accessible. Tableau offers a broad range of visualization options, dashboarding capabilities, and integrations with various data sources.
However, while Tableau is powerful, it is not always the most user-friendly option, especially for non-technical users. Working with complex datasets often requires knowledge of Tableau’s proprietary scripting language or SQL, making it harder for business teams to explore data independently. The platform also has a steep learning curve, which can slow down adoption.
Key features of Tableau:
Augmented analytics: Use AI and natural language queries to explore your data.
Data blending: Combine data from multiple sources in one project to compare datasets and find patterns.
Collaboration: Work on shared projects with other teams through Tableau Server, Tableau Cloud, or Tableau Public.
Visualization: Create a wide range of charts, including bar, line, pie, scatterplots, histograms, and treemaps.
Pros of Tableau:
Efficiently processes large datasets, handling millions of rows without issues.
Offers extensive training materials and a strong user community for support.
Connects with various databases, cloud services, and third-party applications.
Cons of Tableau:
Advanced dataset creation often requires SQL knowledge, though working with pre-prepared data is more straightforward.
Limited parameter options mean some data updates need to be done manually.
Performance may slow down when working with highly detailed visualizations on large datasets.
Pricing
14-day free trial
Tableau Creator - $75.00/user/month
Tableau Explorer - $42.00/user/month
Tableau Viewer - $15.00/user/month
💡Top Tableau competitors and alternatives to consider
Power BI is Microsoft’s go-to tool for data visualization, reporting, and dashboard creation. Its drag-and-drop interface makes it easy to build reports, but some advanced analytics features might need additional configuration.
If your team already uses Microsoft products, Power BI integrates smoothly. Just keep in mind that performance can slow down with very large datasets or complex models.
Key features of Power BI
Customizable dashboards: Build interactive dashboards and reports that update in real time to support faster decision-making.
Data integration: Connect to Excel, SQL Server, Azure, and various third-party applications.
Natural language queries: Use the Q&A feature to ask questions about your data in plain language and get instant answers.
Data modeling: Leverage Power Query and Power Pivot to organize data and create advanced models for deeper analysis.
Pros of Power BI
Provides a wide range of visualization options to help present data.
Integrates well with Microsoft tools, making it an easy fit for organizations using the Microsoft ecosystem.
Provides strong analytics capabilities at a lower price point.
Cons of Power BI
Advanced customization can be more restrictive compared to some other BI tools.
Performance may slow when working with large datasets, often requiring additional tools for optimization.
Some features depend on cloud services, which could be a challenge for organizations with strict data privacy or compliance requirements.
Pricing
30-day free trial
Free account
Power BI Pro - $10/user/month
Power BI Premium - $20/user/month
Power BI Embedded - Variable
💡10 Power BI alternatives for data-driven insights
Qlik Sense offers self-service BI designed for intuitive data exploration and visualization. Unlike traditional query-based tools, its associative data model allows users to explore connections between datasets without predefined structures.
If you’re new to analytics, Qlik’s interface can take some time to learn. And when you're working with large datasets or complex queries, performance may slow down, leading to longer load times and delays in analysis.
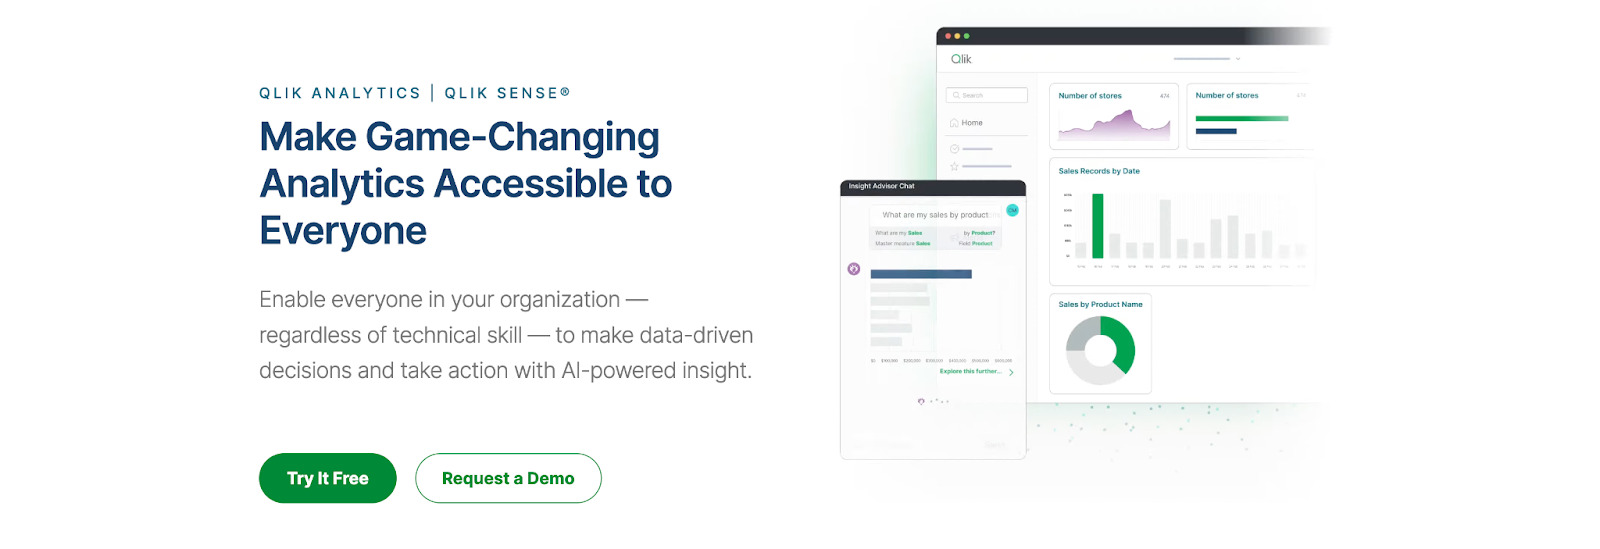
Key features of Qlik Sense:
Self-service visualization: Easily load and explore datasets with interactive, real-time visual updates.
Conversational search: Leverage search-based tools and natural language processing to get insights quickly.
Automated alerts: Stay informed with notifications triggered by data changes and automated workflows.
Embedded analytics: Use open APIs to integrate custom analytics into other applications seamlessly.
Pros of Qlik Sense:
Works across multiple devices, including desktops, laptops, tablets, and smartphones.
Enables custom app creation for personalized visualizations, even without advanced technical expertise.
Allows users to explore data dynamically, finding relationships that traditional query-based tools might miss.
Cons of Qlik Sense:
Performance can slow when handling large datasets, impacting responsiveness.
While cost-effective for small teams, per-user pricing may be expensive for larger organizations.
Exporting data to Excel can be problematic, often leading to formatting issues like lost colors and fonts.
Looker is a cloud-based BI platform that helps you explore, analyze, and visualize data in real time. Its standout feature is LookML, a proprietary modeling language that helps you define metrics consistently across your team so everyone’s working from the same source of truth.
If your organization already uses Google’s ecosystem, Looker fits in easily. But setup can be complex, and it may not give you the flexibility you need for quick, ad hoc analysis.
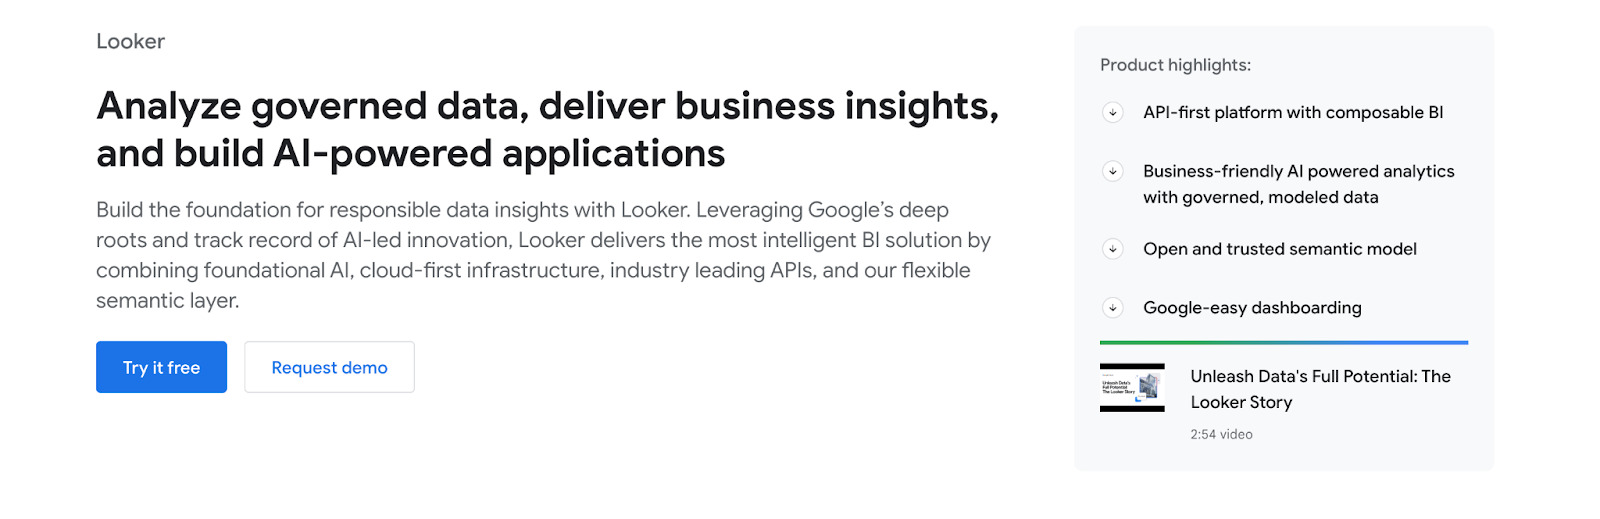
Key features of Looker
Custom data applications: Build tailored data experiences with reusable components and modules.
Automated workflows: Set up alerts and schedule reports to monitor key business metrics in real time.
Third-party integrations: Connect with tools like Salesforce and Confluence to extend functionality beyond data visualization.
Cloud-based: Access Looker from anywhere without software installation, ensuring easy deployment with strong security and access controls.
Pros of Looker
Create customized reports and dashboards for more in-depth analysis.
Automates data processing tasks, such as aggregation and segmentation, to improve efficiency.
Uses LookML to centralize data definitions, providing consistency and accuracy across reports.
Cons of Looker
Sharing reports isn’t always easy, requiring extra steps that may slow collaboration.
Performance can lag when handling multiple visualizations at once.
Limited documentation can make onboarding and troubleshooting more difficult.
Pricing
30-day free trial
Looker’s pricing structure includes separate platform and user licensing fees, so it’s difficult to estimate costs upfront. The platform offers standard, enterprise, and embedded options, but pricing for integrations isn’t always transparent.
User licenses come in three tiers—Developer, Standard, and Viewer—each with different access levels. With pricing ranging from $30 to $125 per user per month, costs can add up quickly, especially for large teams needing multiple roles and broad data access.
💡5 Looker alternatives for AI-Powered business insights
Build your BI success on the right platform
Business intelligence isn’t just about looking at dashboards—it’s about getting the right answers, right when you need them. While Sigma gives you a structured approach to analytics, it can feel restrictive when working with dynamic, real-time data.
ThoughtSpot offers AI-powered search, automated insights, and interactive dashboards that refresh instantly, so you’re always working with the most up-to-date information. If your team is ready for a faster, smarter way to analyze data, it’s time to make the switch to ThoughtSpot.
The best decisions start with the best insights. See ThoughtSpot in action–schedule a live demo!


