


Imagine if every employee in your company could analyze and visualize business data coming in from various sources on a single, interactive interface and make informed decisions in a matter of hours—not days or weeks.
This ability is the foundation of AI-powered business dashboards. By transforming raw data into interactive visualizations, business dashboards help you go from collected data to insight to action.
This article will take you through the world of business dashboards, from knowing what they are to referring to great examples. By the end, you’ll understand how business dashboards help you extract the insights needed to make strategic decisions.
Table of contents:
A business dashboard is a visual interface that provides a consolidated view of key performance indicators (KPIs) and metrics, helping business users make smarter, data-driven decisions. Using a self-service analytics tool like ThoughtSpot, you can create interactive business dashboards that offer instant access to insights and facilitate seamless information sharing throughout the organization.
Whether you’re from sales, marketing, or operations, you can customize these dashboards, or as we call them Liveboards, to visualize a wide range of data.
1. Accessing real-time data
Businesses need timely and relevant information to respond to changing market conditions. Instead of churning out static reports, business dashboards empower executives with real-time data visualizations and insights. This enables them to monitor key performance metrics, spot new trends, and identify anomalies.
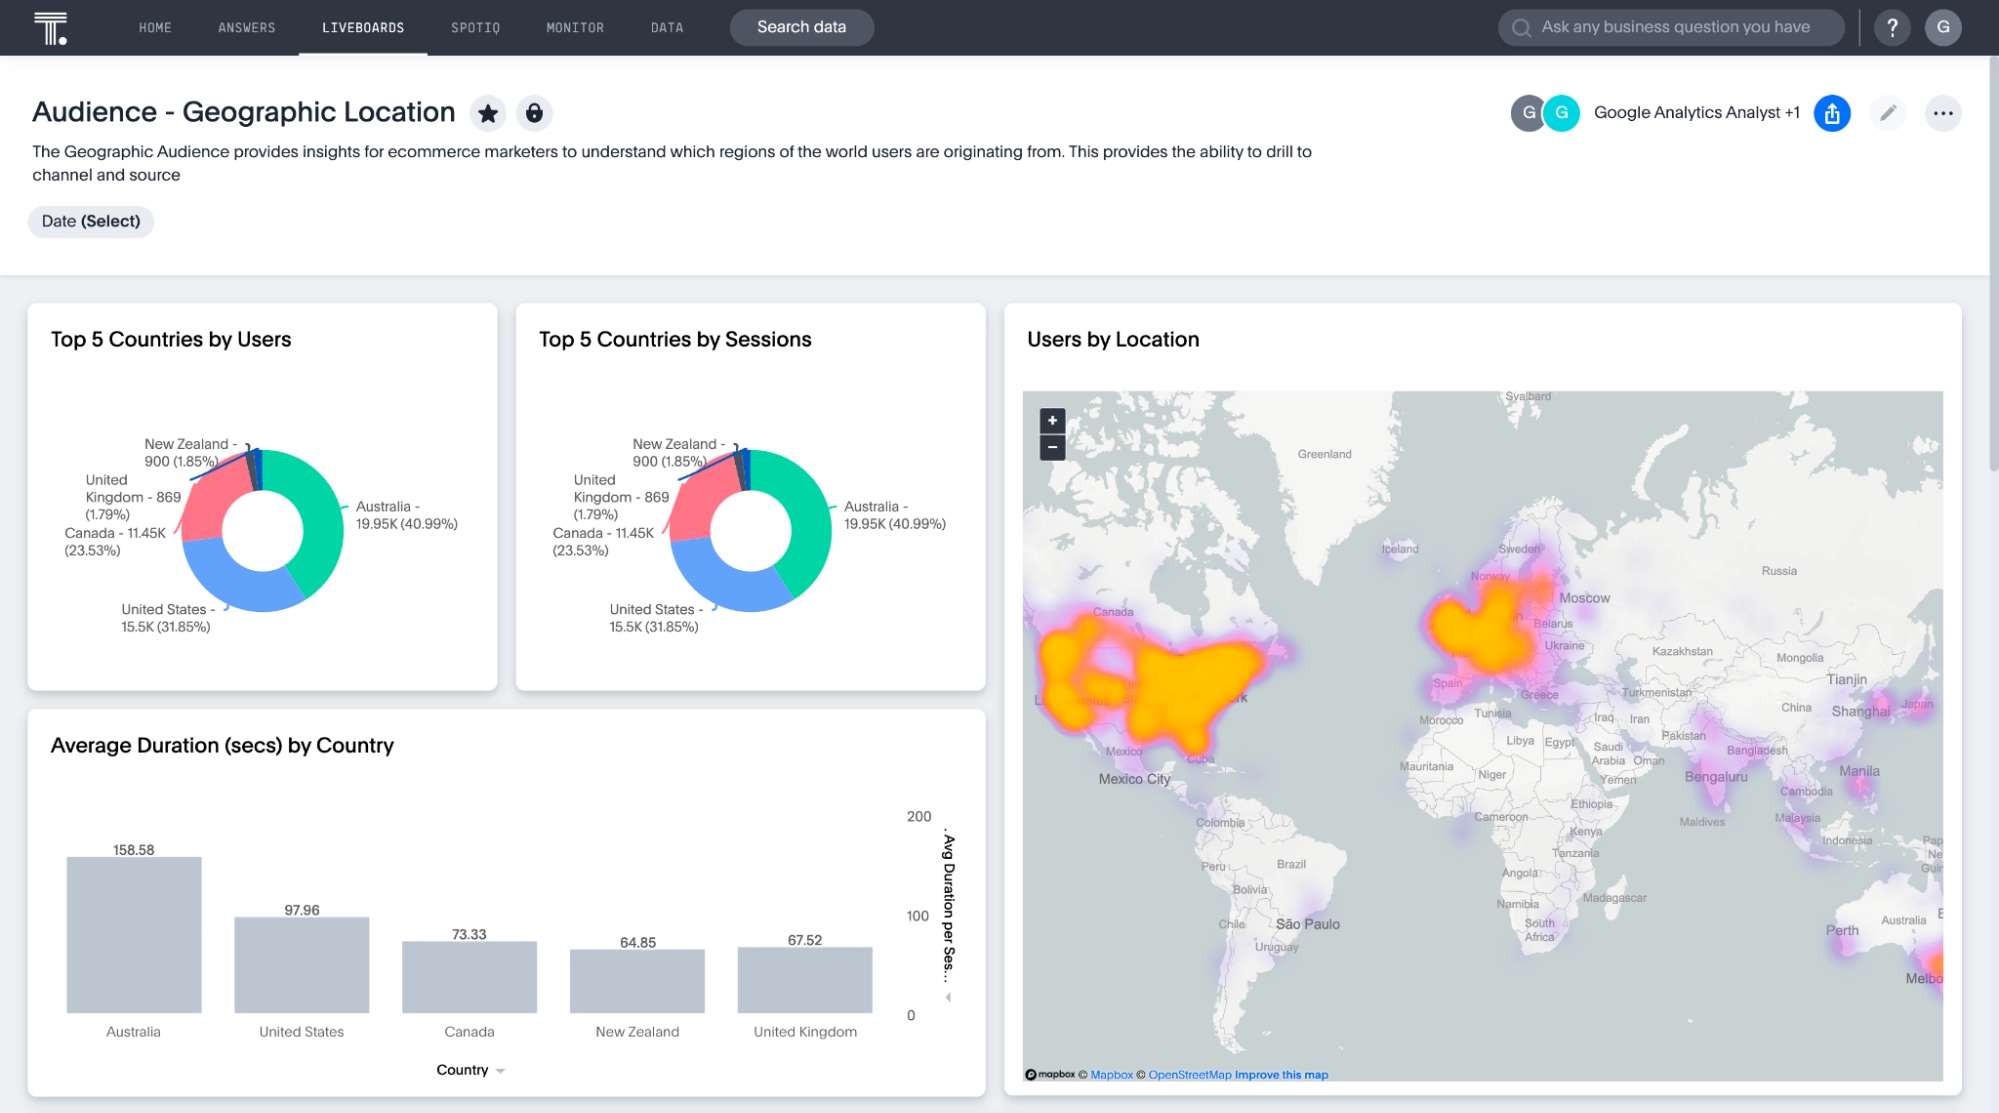
For instance, an e-commerce company could use an e-commerce dashboard to gain more visibility into their website visitors. This agile analysis paints a picture of how prospects and current customers interact with your website, allowing you to create targeted messages, optimize product listings, and adjust marketing campaigns as needed.
2. Enhancing data exploration
Better data analytics means you’re ready to meet—and exceed—your customer’s high expectations. Instead of viewing information at a high level, you can leverage business dashboards with interactive elements like drill-downs and filters to explore specific data points, time periods, and categories. This granular approach empowers business users to slice and dice data, gaining a wealth of information about customer behavior.
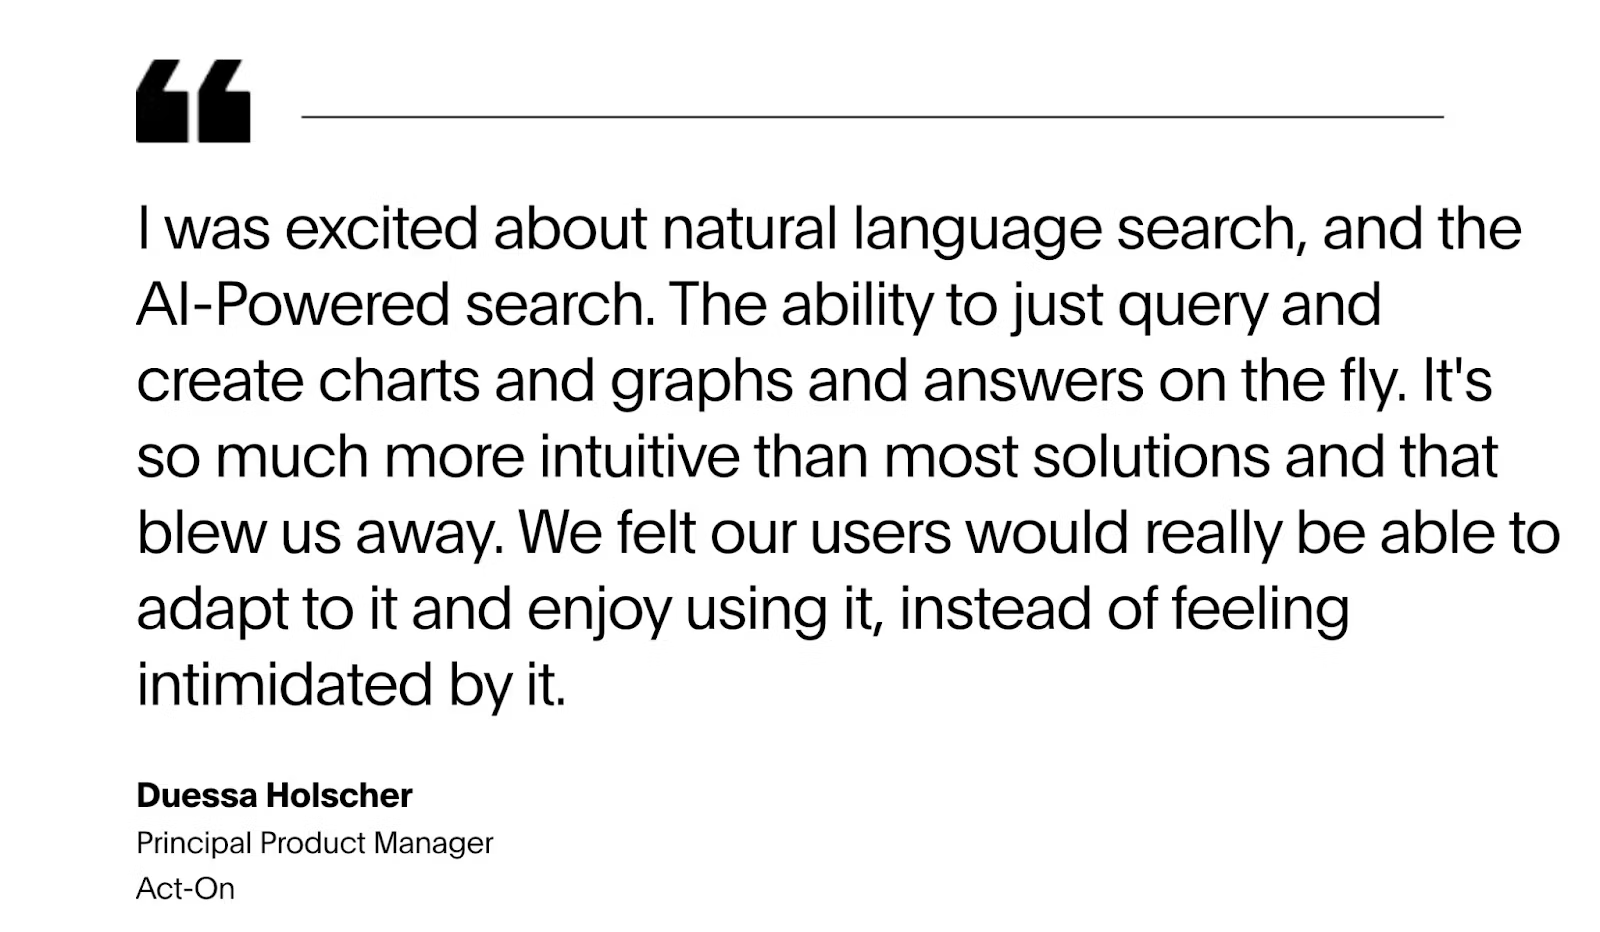
This was the case for Act-On. With ThoughtSpot Embedded—the next-generation AI-powered embedded analytics solution—the company was able to make data exploration and analysis ubiquitous for all users. In fact, they saw over 60% higher report usage over their previous reporting system—their embedded analytics experience empowers users to swiftly access data and pose critical questions about their marketing campaigns.
3. Improving bottom line
By setting up a customizable live dashboard that offers real-time updates on end-to-end business performance, leaders can make data-driven decisions about effience resource allocations. This instantaneous access to real-time insights allows leaders to monitor current conditions, anticipate demand forecasting, and identify improvement areas for a better ROI.
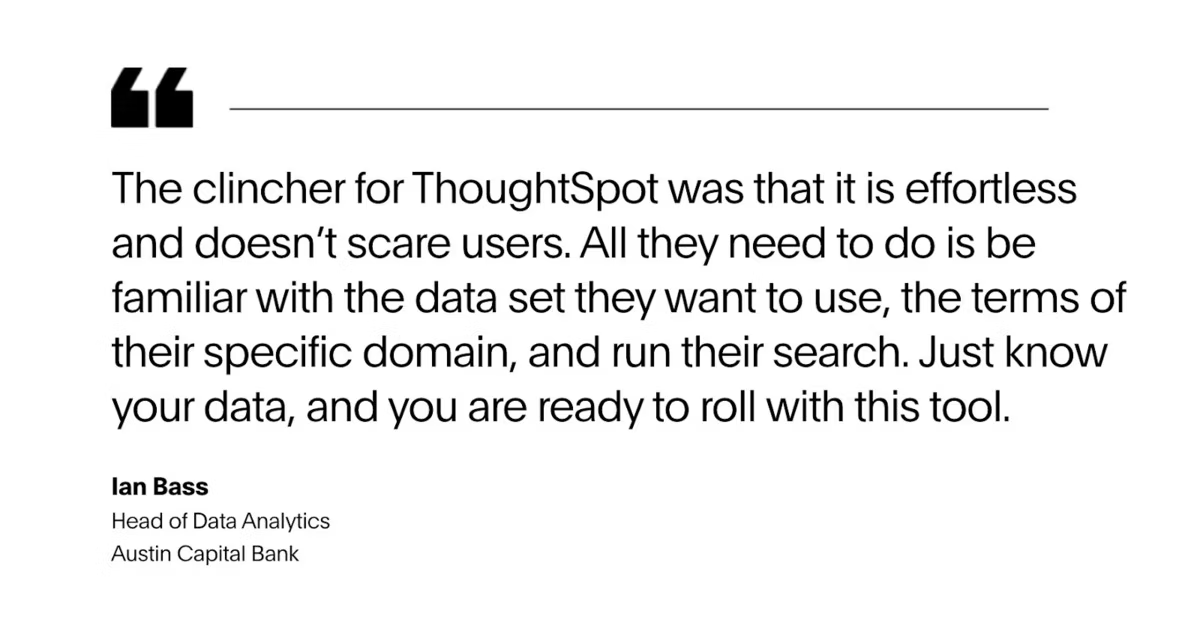
This was the case for Austin Capital Bank. By using ThoughtSpot daily to track lead generation and conversions, the company was able to drive a 50% decrease in paid search spend and improve its margin by almost 30%.
Different business dashboards serve unique audiences and goals. Below, we’ve listed some business dashboard examples that are relevant to specific job functions:
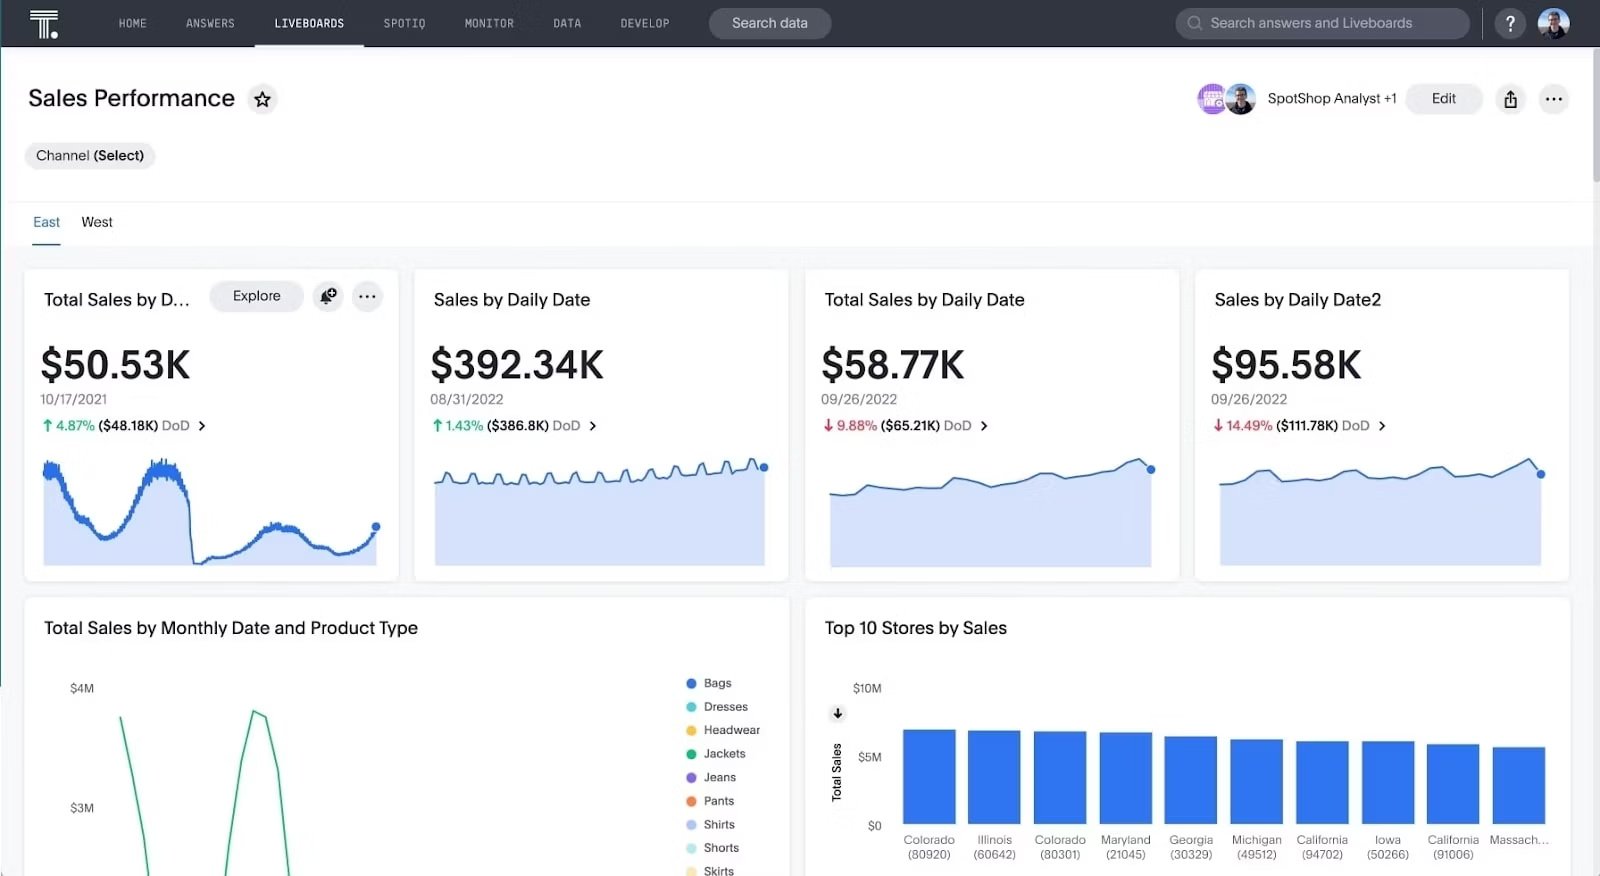
1. Sales dashboard
Have you ever looked at a sales report and thought, “I wish I could see which region drives the most sales?” or “What is the cost of converting a lead into a customer?”
When used strategically, sales dashboards can help sales managers and stakeholders unlock valuable trends in their sales data, including revenue, conversion rates, and sales growth over time. Modern dashboard software like ThoughtSpot consolidates data from your CRM systems, spreadsheet, and marketing tools into a single, easy-to-access interface, presenting clear visibility into your pipeline. Such insights allow you to adjust your sales strategies and tactics accordingly.
💡Take a look at some handpicked sales dashboard examples
2. Marketing dashboard
The ultimate goal of marketing dashboards is to give you a holistic view of your past and ongoing marketing efforts. You can leverage these dashboards to track and analyze critical marketing KPIs, helping you gauge the performance of your ongoing campaigns, monitor customer interactions, and identify engagement opportunities.
For instance, here’s how Katie Dunn, our former Senior Manager of Demand Generation, uses ThoughtSpot Liveboards to understand how prospects and customers interact with our marketing campaigns.
💡Take a look at some handpicked marketing dashboard examples
3. Financial dashboard
Managing a company’s finances can be tricky. From complex financial data to factors that impact revenues, there’s a lot you need to keep track of. With financial dashboards, you gain real-time, visual insights into key financial metrics like budget, revenue, and growth. This can help understand your organization’s economic health and performance and address areas that need attention.
💡Take a look at some handpicked financial dashboard examples
4. HR dashboard
At the core of every business are its people. With HR dashboards, you gain up-to-date information about employee performance, enabling HR managers and executives to quickly identify workforce trends, areas of concern, and opportunities for improvement. With such insights, you can implement specific programs to empower individuals to perform better and propel organizational growth.
Alana Roesler, End-to-End Data Flow Architect at Schneider shares how she uses ThoughtSpot’s AI-Powered Analytics to drive digital transformation in HR:
💡Take a look at some handpicked HR dashboard examples
5. IT dashboard
As organizations adopt a new set of cloud technologies, IT teams need end-to-end visibility into cloud workloads for optimal performance. With IT dashboards, your team can track, analyze, and visualize tons of IT data, helping them resolve bottlenecks, reduce the constant barrage of support tickets, and enhance the ROI of their IT operations.
Having explored various examples of business dashboards across different job functions, let’s look at how they can be applied across industries:
1. Retail dashboard
Retailers have to stay on top of critical KPIs—including sales, finance, and inventory, to keep up with evolving business needs. With business dashboards, retailers gain a concise and accessible overview of various data points, allowing them to monitor performance and gain insights into customer behavior. Whether you want to make strategic decisions about resource allocation, product development, or sales strategies, these interactive dashboards eliminate guesswork and enable data-driven decisions at every intersection.
💡Take a look at some handpicked retail dashboard examples
2. Healthcare dashboard
Every day, healthcare organizations collect tons of patient data—both structured and unstructured—in the form of clinical notes, electronic records, and patient feedback. Yet for many healthcare professionals, analyzing this data on legacy dashboards can be laborious. With modern analytics tools, professionals can easily analyze past patient data, optimize workflows, and create personalized healthcare plans, leading to better patient outcomes.
3. Telecommunication dashboard
Having a robust subscriber base is great, but providing quality customer service requires you to analyze customer usage at a granular level. With telecom business dashboards, you can visualize crucial customer data, including call drop data, signal strength, and network latency, to identify areas with poor coverage or network congestion.
For instance, by using ThoughtSpot’s AI-powered Liveboards, every member of your team can swiftly uncover trends and anomalies in your telecom data. This data-driven understanding enables you to personalize service offerings, recommend relevant products or promotions, and provide targeted support to individual customer needs.
💡 Take a look at some handpicked telecom dashboard examples
4. Manufacturing dashboard
The manufacturing industry is characterized by complex processes and high-volume operations—be it production, sourcing, or inventory management. To streamline such processes and improve outcomes, you need a bird’s-eye view of your manufacturing data. Through interactive manufacturing dashboards, you can regularly track essential manufacturing KPIs to pinpoint inefficiencies within your operations, enabling you to minimize downtime and improve profitability.
For instance, you might use manufacturing dashboards to analyze expenditures across your operations and identify areas of improvement.
Unlocking the full potential of your data can help you capitalize on growth opportunities and build a competitive advantage. But that’s easier said than done, especially when you’re using legacy dashboards.
With ThoughtSpot, however, that’s a whole different story. Our intuitive search-driven experience allows business users to ask questions in natural language and receive AI-assisted answers and visualizations in return.
See how our AI-powered Liveboards can empower your team to find granular, actionable insights within minutes. Schedule a demo today.


