


If there’s one thing the stock market crash of 1987 and the global financial crisis of 2008 taught us, it’s that cash is king. And for finance leaders like you, managing complex cash flows and identifying revenue generation opportunities is even more important. However, juggling multiple accounts and dealing with data from countless sources require dynamic tools that provide immediate insights into your organization’s financial health.
Cash flow dashboards can give you actionable insights about your cash inflows and outflows from ongoing operations, investment portfolios, and other financial activities. This information empowers you to make data-driven decisions about optimizing liquidity and strategically managing your resources.
However, not all cash flow dashboards are built equally. Below, we cover key features so you can create a dashboard that aligns with your financial goals.
Table of contents:
A cash flow dashboard is a visual representation of key financial indicators (KPIs) and metrics that help CFOs and business leaders monitor, analyze, and optimize their company’s cash flow. These financial dashboards collect various pieces of information in a business intelligence (BI) platform to give users a cohesive, easy-to-understand view of their income streams, expenses, and liquidity.
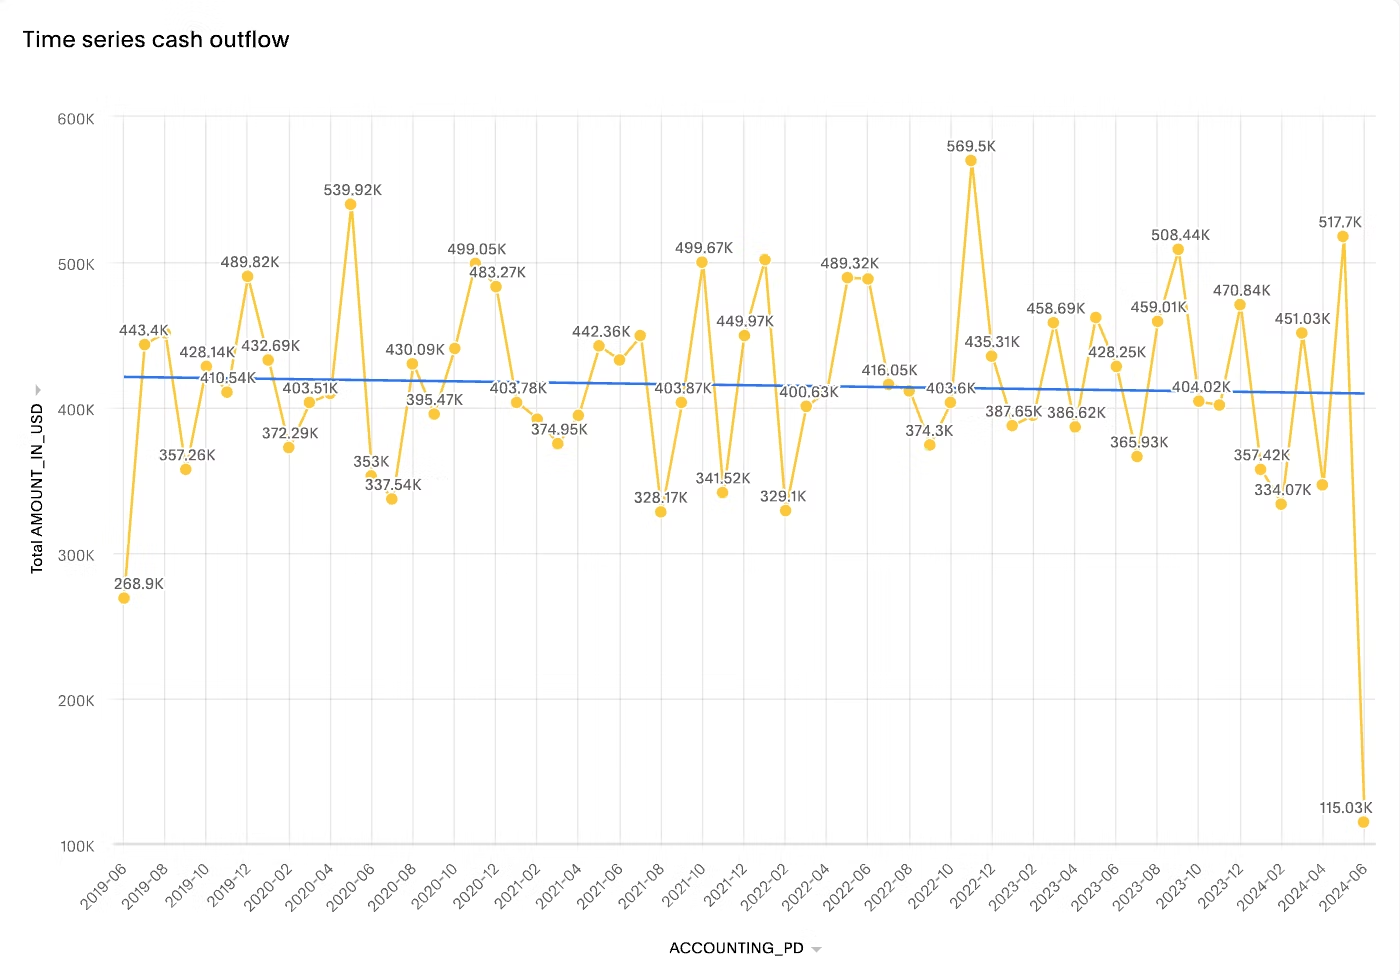
Whether you want to monitor your month-to-month cash outflows or anticipate account receivables for the next quarter, you can customize the dashboard to align with your financial goals.
1. Gaining insights into your spending activities
Because many finance teams perform cash flow calculations using spreadsheets, dealing with large financial datasets can create huge bottlenecks. With cash flow dashboards, you can consolidate and visualize data coming in from bank accounts, expense reports, sales systems, and investment portals, creating an easy-to-understand view of your accounts' payables and receivables. This high-level visibility can help you pinpoint cash leaks, identify overspending areas, and flag potential risks.
However, if you want more precise intelligence on the changes in your spending activities, you need a modern solution like ThoughtSpot to create interactive Liveboards. These live dashboards give you real-time insights into your financial KPIs, empowering you to quickly uncover hidden causes, effects, and correlations. You can continuously monitor spending activities, drill into specific areas, and dynamically analyze trends and anomalies. Access to instant insights enables strategic planning, resource allocation, and risk mitigation with greater accuracy and confidence.
2. Understanding your cash inflows
Traditional dashboards provide insights into your cash inflow pipeline, helping you track money from various revenue streams such as sales, loans, and investments. Using intuitive charts, bars, and graphs, you can monitor performance over time and strategically plan for the future.
AI-powered solutions like ThoughtSpot can further help you elevate your financial performance. Take the Liveboard example below. Say you want to analyze your cash inflows coming from sales this quarter and understand which factors are affecting your financial performance. With natural language search, you can uncover driving factors and anomalies behind key metrics, ensuring your organization remains on track to achieve its financial objectives.
3. Mitigating financial risks
Many people think profitability is the end game. However, this couldn't be farther from the truth. Even if your business is profitable, you can still face bankruptcy if you don’t have the cash to pay bills. That’s why it’s important to monitor your working capital KPIs and maintain liquidity.
By analyzing historical data and scenario modeling, cash flow dashboards can help you develop contingency plans, refinance short-term debt, or optimize inventory management. However, most are limited in their ability to forecast trends and often require significant manual plumbing to generate insights.
Using next-gen solutions like ThoughtSpot, you can do more than just monitor KPIs. Leveraging SpotIQ's "what-if" scenario exploration, you can predict future cash flow challenges, identify potential revenue streams, and develop proactive strategies to effectively navigate changing market conditions.
💡Dashboards are Dead. Yes, we said it. See why business leaders are choosing Liveboards over static dashboards.
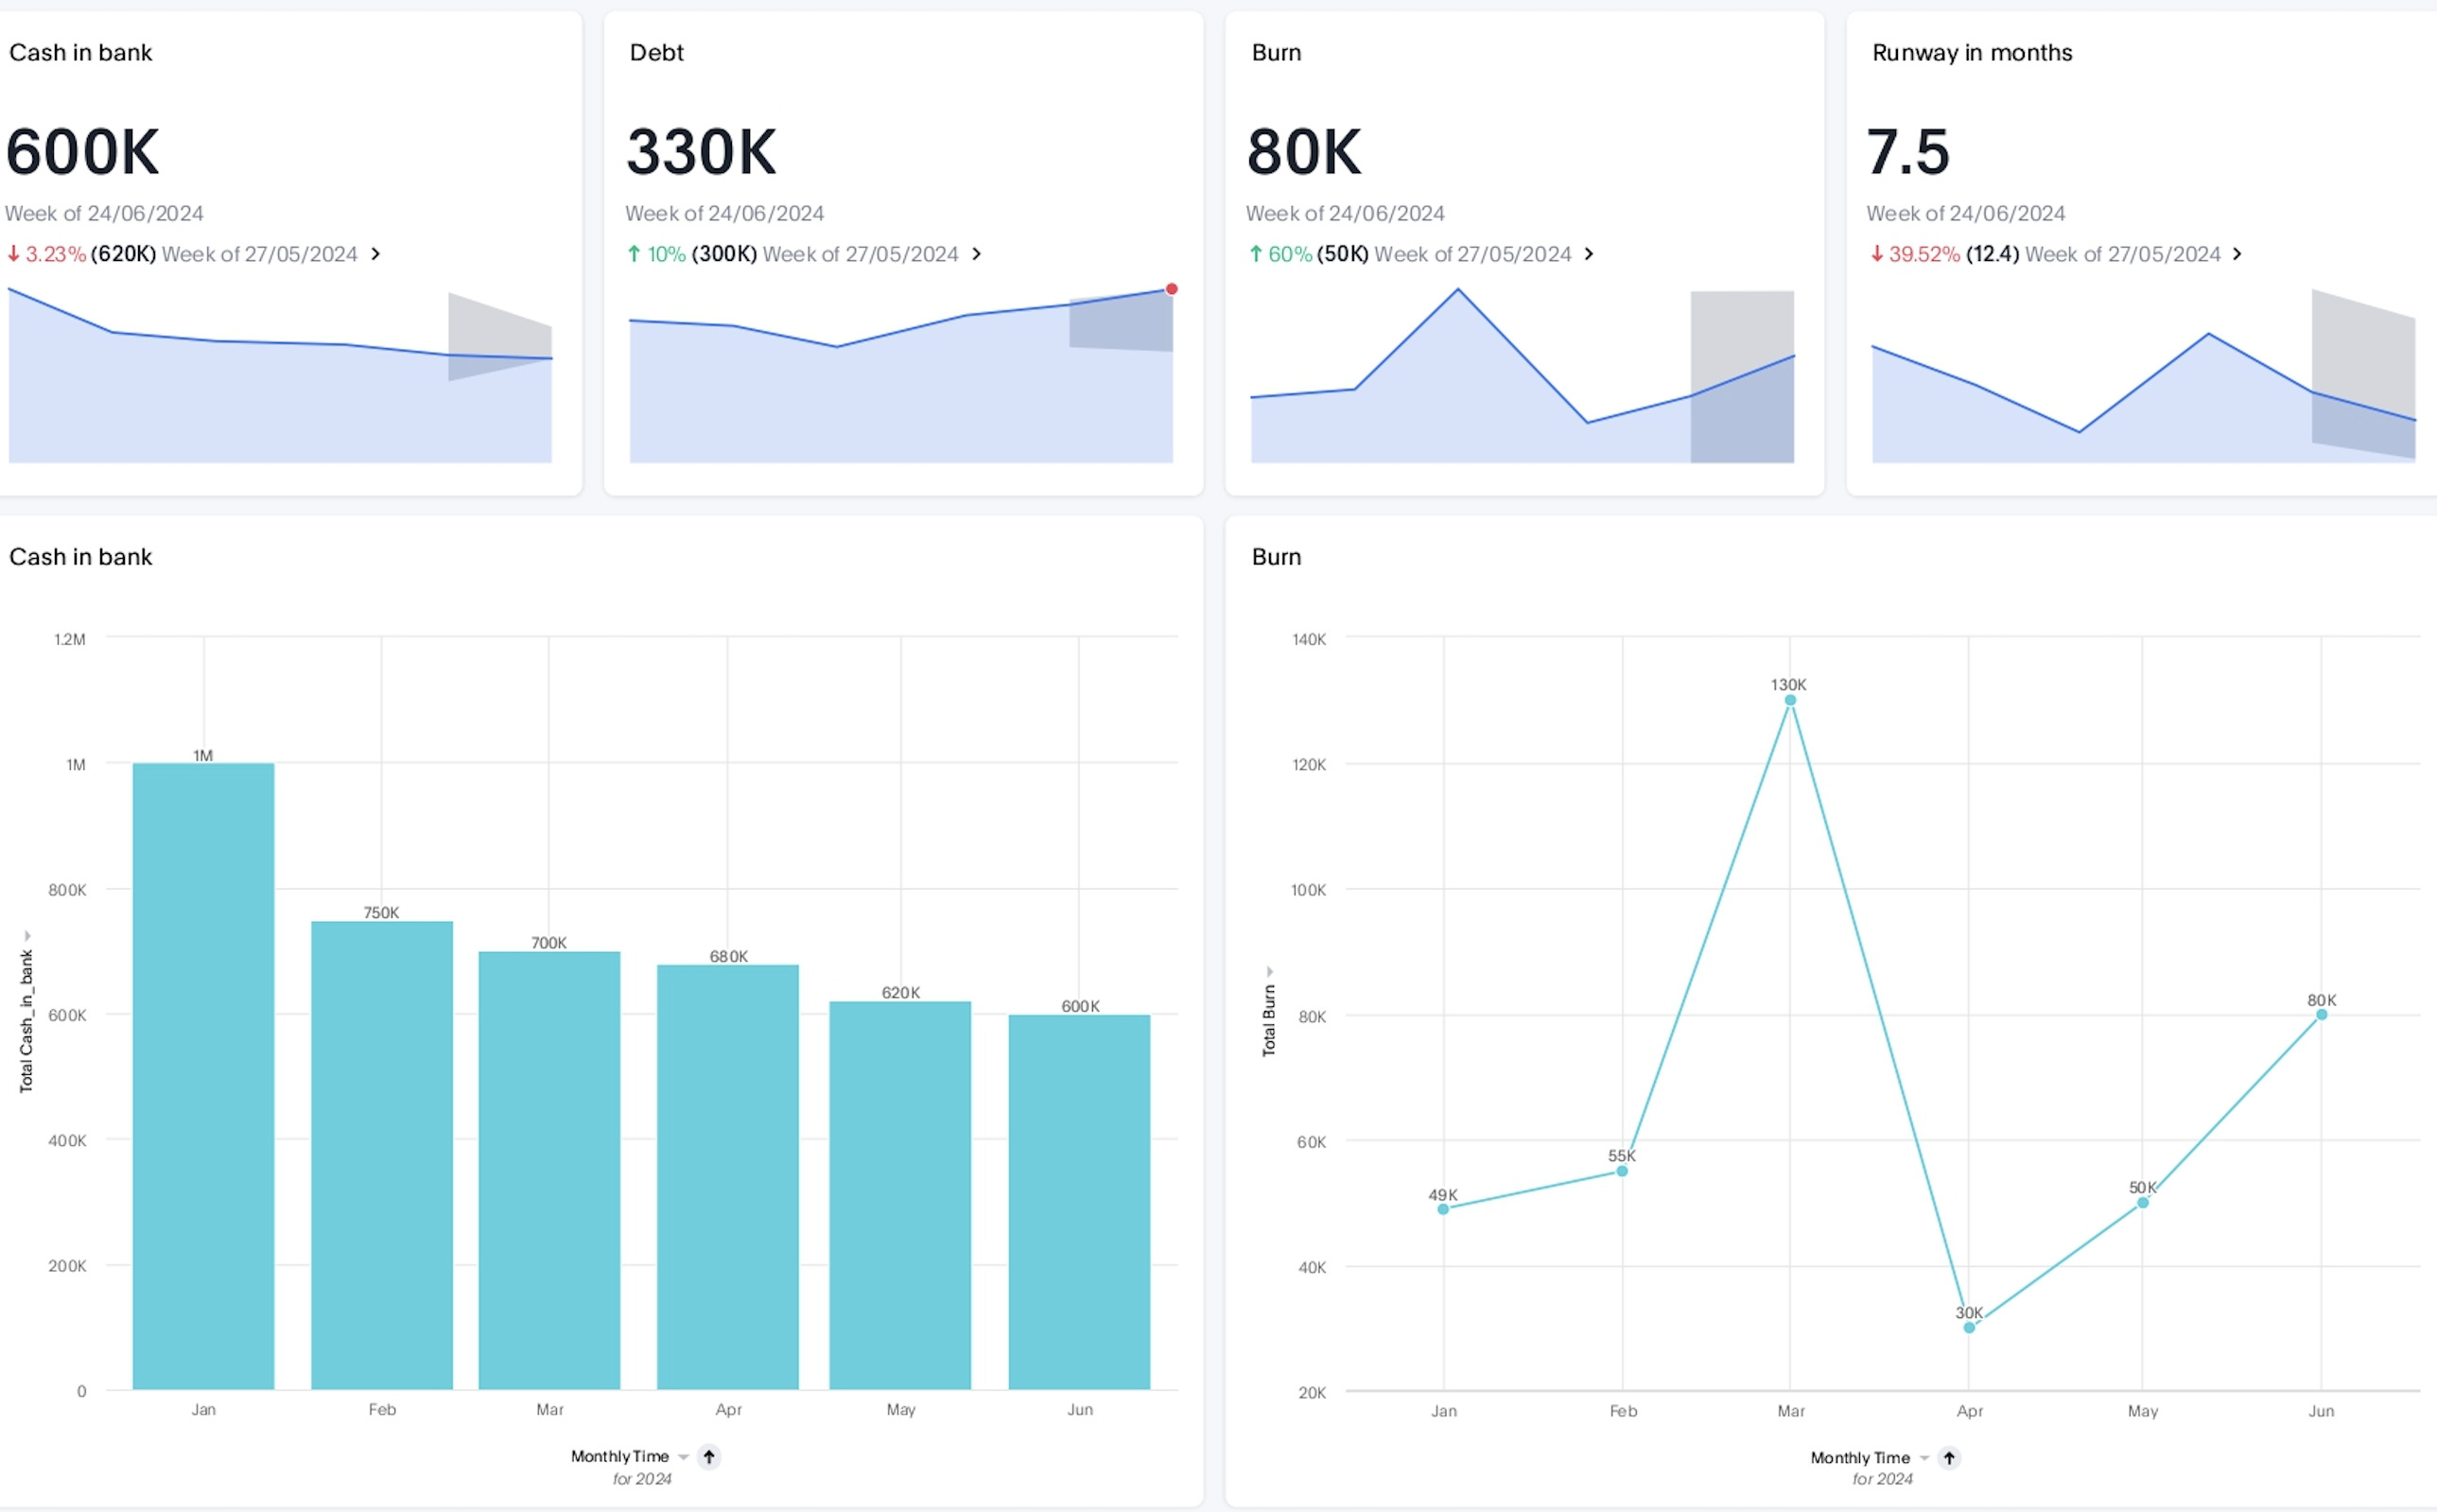
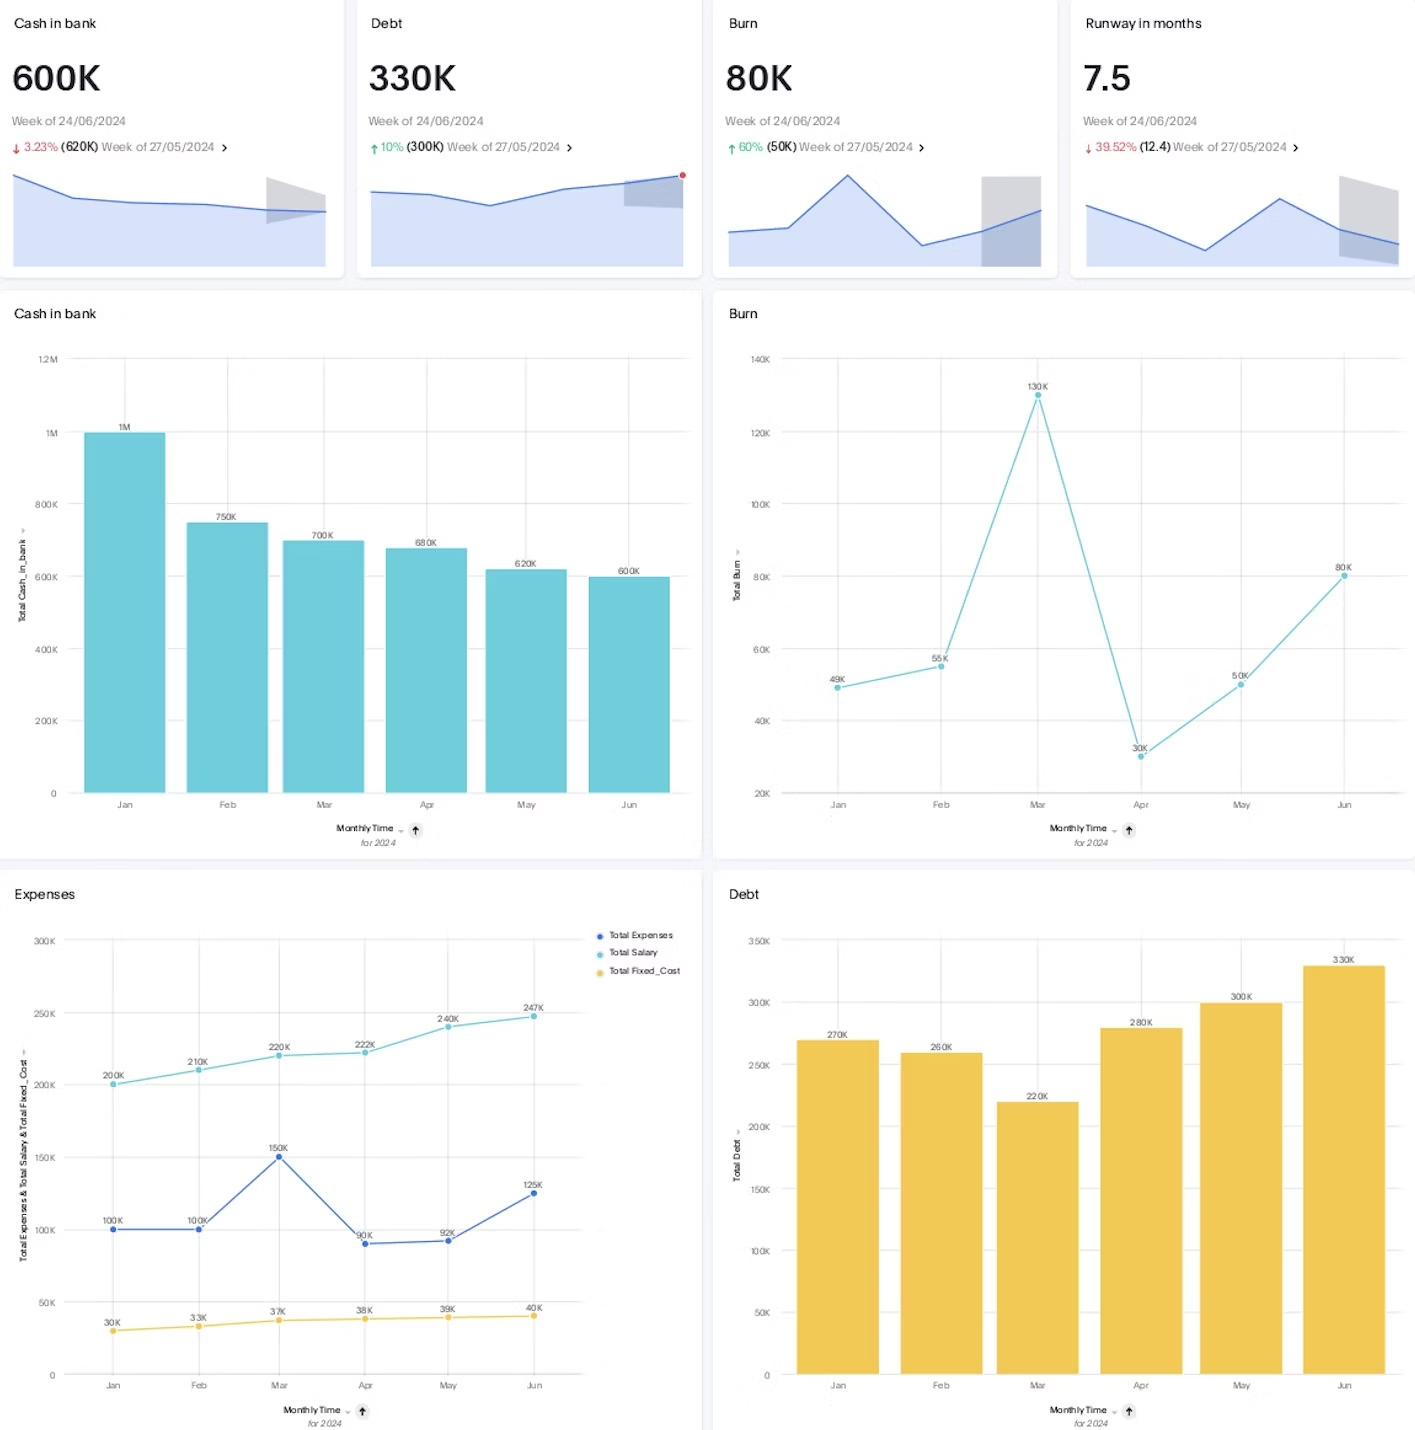
1. Executive cash flow dashboard
This executive dashboard offers stakeholders a near real-time snapshot of their business’s financial health by generating visualizations of cash inflows and outflows. It highlights key metrics like net cash flow, accounts receivable, and payable, and operating cash flow. You can track, analyze, and visualize important financial data such as expenses, revenue, cash flow, and liquidity to avoid cash shortfalls, maximize growth opportunities, and reduce the churn associated with cash flow management.
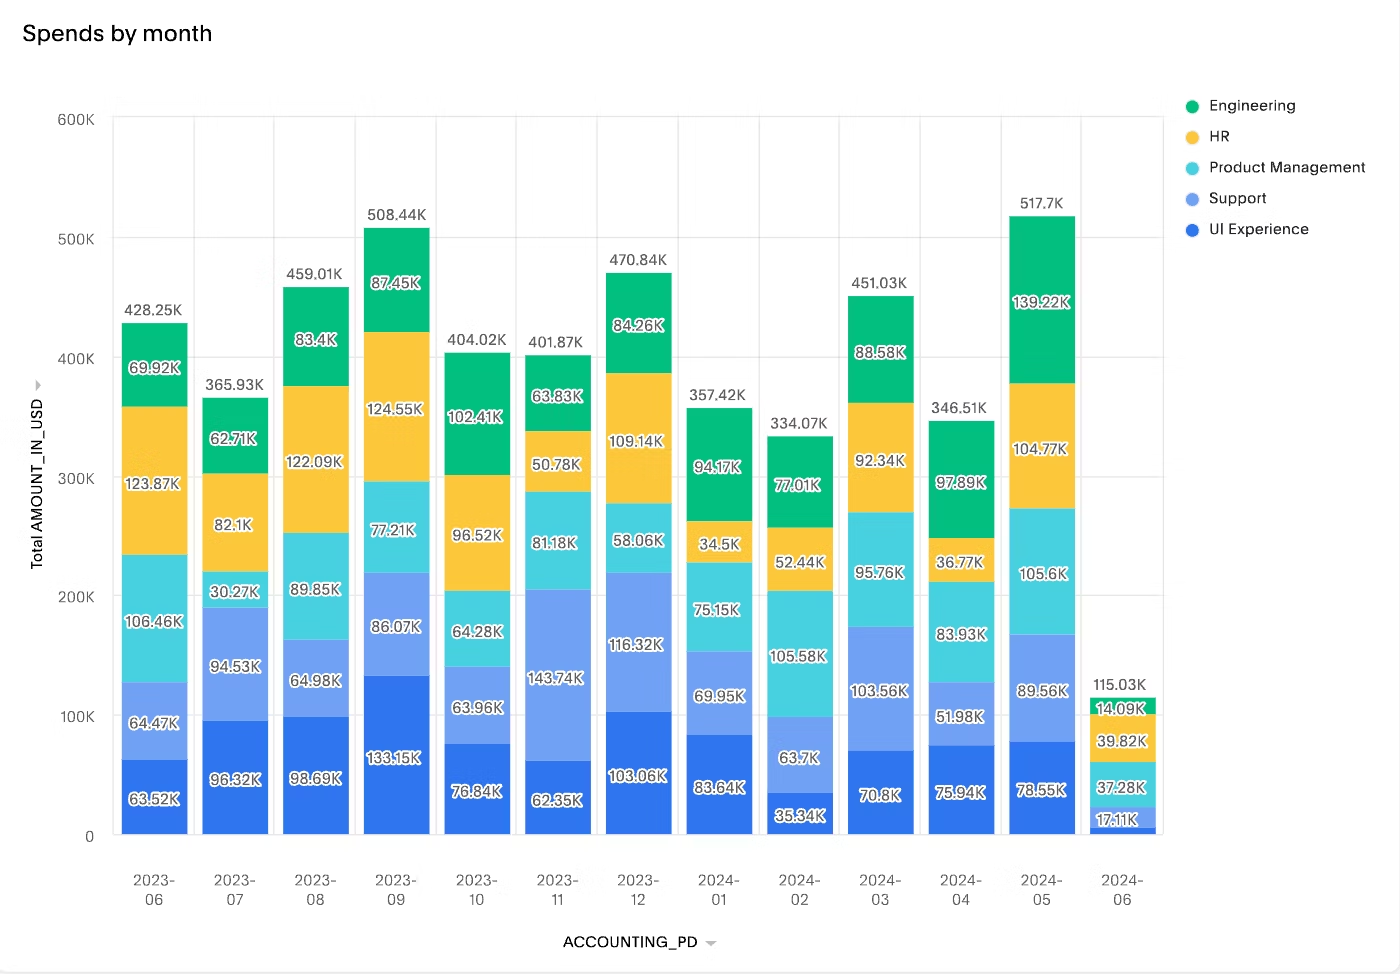
2. Expense management dashboard
An expense management dashboard provides a comprehensive view of where and how your money is spent. It provides a detailed overview of all your expenses broken down into categories such as marketing, sales, operations, finance, and human resources. This delineation can help you make strategic decisions about cost optimization. With features such as trend analysis, budget monitoring, and customizable reports, an expense management dashboard allows you to compare past performances and understand how your current expenses align with your budgetary projections.
This was the case for Austin Capital Bank. By using ThoughtSpot to track its daily marketing operations, the company was able to drive a 50% decrease in paid search spend and improve its margin by almost 30%.
3. Cash inflow from sales
These business dashboards help finance leaders visualize cash inflows from sales activities to understand their contributions to overall cash flow. By focusing on key sales metrics, you can identify opportunities to improve cash flow by optimizing sales processes and payment collections. Whether you’re conducting revenue analysis or forecasting future cash inflow, this dashboard is an effective tool for strategic planning and driving sustainable business growth.
4. Cash inflow from investment
CEOs and CFOs use this dashboard to gain a high-level view of cash inflows generated from various investment activities. It provides a summary of all incoming cash from investments and assets, including stocks, bonds, real estate, and dividends. You can also leverage this type of dashboard to track realized and unrealized gains from the sale of investments, helping you assess the impact of your overall investment strategy.
5. Cash flow projections
As the name suggests, this dashboard generates projections on future cash flows based on past data. By using AI-powered analytics solutions like ThoughtSpot, you can harness the power of large language models (LLMs) and GenAI to create cash flow projections that will better equip you to plan for upcoming expenses, streamline operations, and stay ahead of the competition.
The way many finance teams use data is highly reactive. Data is stored in disparate systems, legacy BI tools require considerable manual plumbing, and business users have to rely on data teams for every ad-hoc report, which usually takes weeks to complete. These delays can cost companies dearly, as they prevent you from capitalizing on emerging trends and making real-time decisions.
To take your team's approach to data from reactive to proactive, you can rely on ThoughtSpot. Our AI-Powered Analytics reduce the time to value through seamless integration with cloud databases and data sources. ThoughtSpot also offers a unique and intuitive approach to exploring and analyzing data—simply ask questions about your data and get instant answers and visualization.
See how easy it is to create ThoughtSpot Liveboards—take a product tour today.


