


Research by McKinsey, shows executives spend about 40% of their time on decision-making. Unfortunately, 60% say that’s time spent poorly.
This begs the question: How can business leaders gain fast and reliable access to data-driven insights so they can take effective action quicker than ever before? That’s where CEO dashboards come into play.
These interactive CEO dashboards—or Liveboards, as we call them—are essential for understanding what drives organizational performance, sharing insights, and making data-backed decisions. In this guide, we will explore the ins and outs of CEO dashboards, including how they work and real-life examples to help you plan more strategically.
Table of contents:
A CEO dashboard is a visual interface that offers business leaders a real-time snapshot of organizational performance. These dashboards consolidate data from disparate sources, displaying key performance indicators (KPIs), metrics, and data visualizations in an easily digestible format. This empowers leaders to track progress, identify outliers, and pinpoint areas of improvement.
While there is no one-size-fits-all template for a CEO dashboard, it might include information about sales performance or offer insights into your company’s financial outlook.
1. Improved data comprehension
A CEO dashboard visualizes your data and tracks the health of your business by measuring metrics, such as total sales value, revenue, expenses, and cashflow. For busy CEOs, these dashboards act as a window into understanding the company’s day-to-day operations. Using these insights, you can identify gaps and make improvements before they can negatively impact your business.
With ThoughtSpot Liveboards, Fabuwood executives were able to access real-time sales data, empowering management to proactively address potential issues, accurately forecast SKUs, and have more visibility into Fabuwood’s overall profitability. Here’s what David Samet, Director of Technology at Fabuwood, has to say about ThoughtSpot’s interactive Liveboards:

2. Enhanced business outcomes
By leveraging CEO dashboards, you gain access to essential information on key financial metrics, including revenue, expenses, cash flow, and profitability. Presenting this complex financial information in a visually appealing format allows you to identify risks early on and take preemptive measures to improve business processes.
Using next-gen dashboard tools like ThoughtSpot, you can do more than just create Liveboards. Featuring limitless drill-downs and filters, you can drill anywhere from high-level sales performance to granular insights like quarter-to-quarter growth rate. ThoughtSpot also offers real-time KPI monitoring through ThoughtSpot Monitor that allows you to set a threshold, so you can take action in real time. Using the mobile app, you can also keep track of key metrics on the go.
3. Faster problem solving
In an era where speed is everything, AI-powered CEO dashboards can help you dig deep into past data and trends to uncover the root causes behind specific events or outcomes.
For instance, suppose your revenue this quarter is lower than expected. You want to understand which factors are affecting your financial performance. With ThoughtSpot Liveboards, you can use natural language search and our AI-augmented analysis, SpotIQ, to identify anomalies and gaps, ensuring your organization remains on track to achieve its financial objectives.
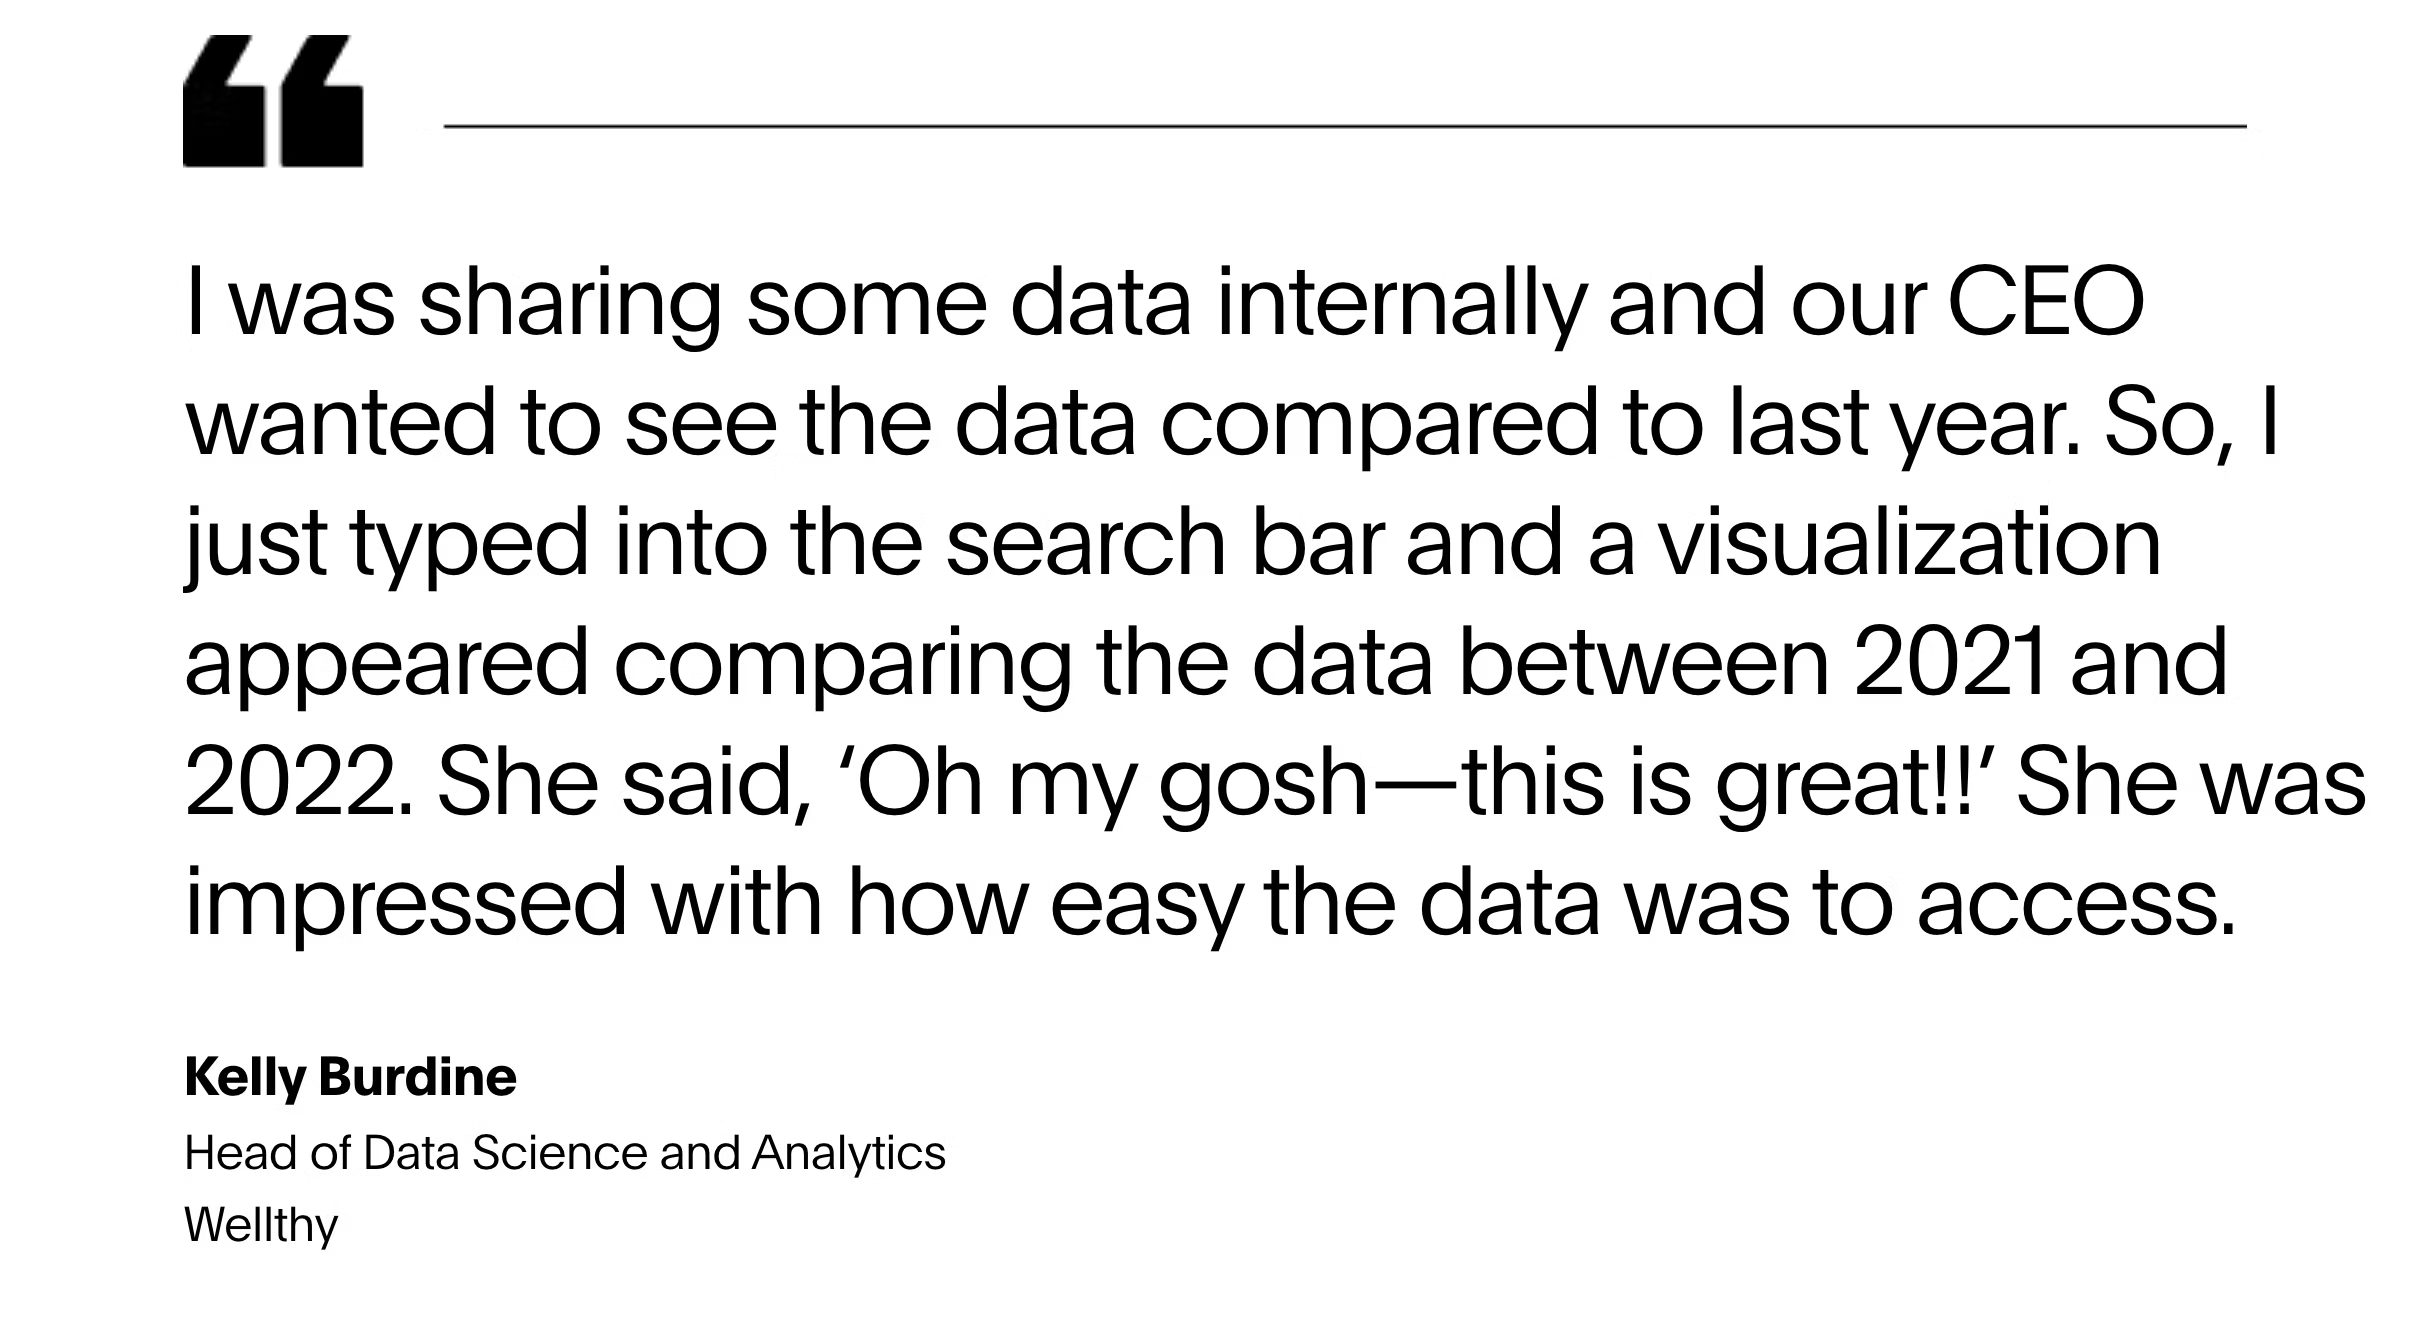
Even better, you don’t have to be a data expert to access this type of advanced analysis. That’s something Wellthy’s CEO found out for herself:
Every executive dashboard serves a unique purpose. You can customize them by choosing relevant KPIs that align with your business goals and then connecting the data with the right dashboard tools. Below, we’ve listed some examples so get inspiration, before you build your own dashboard:
1. Executive sales dashboards
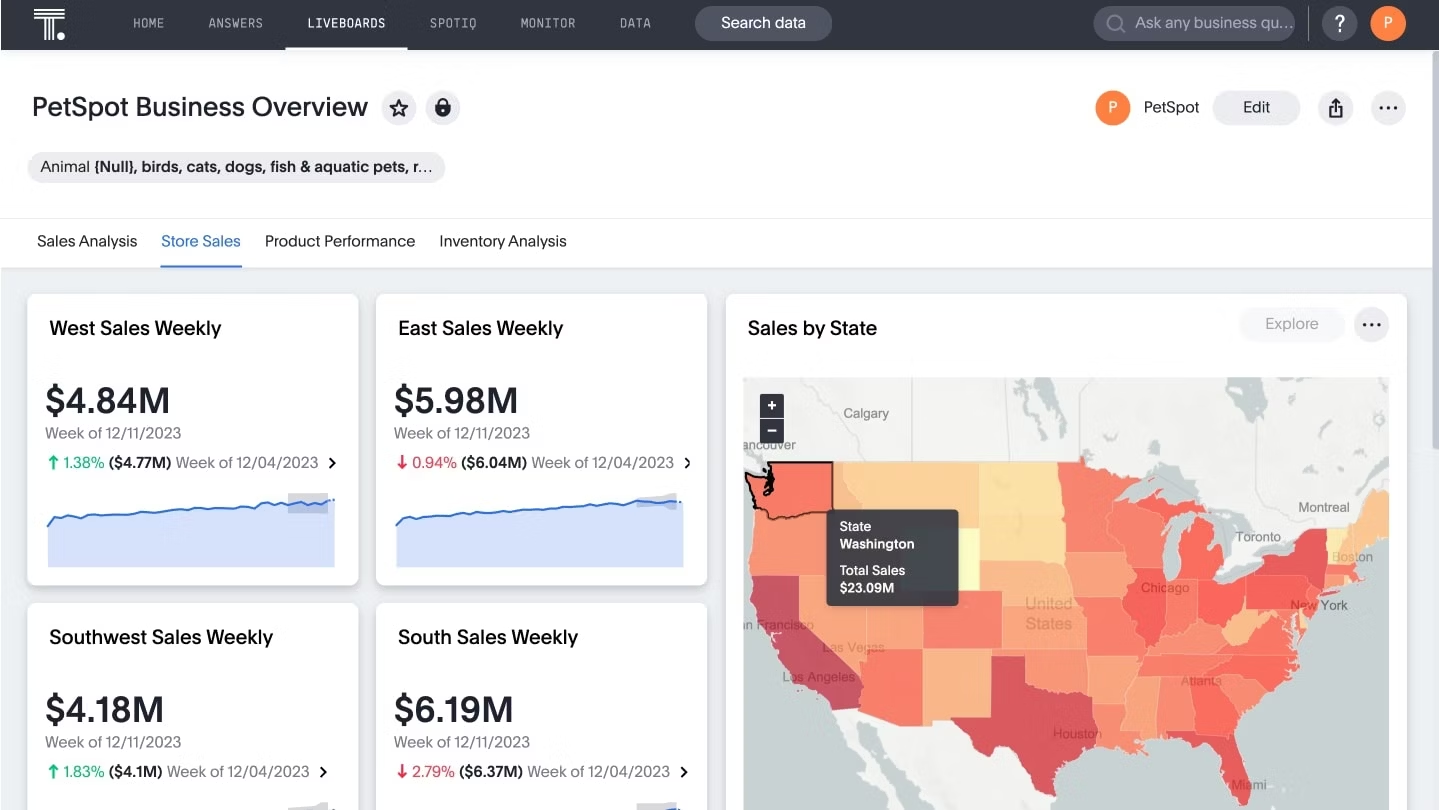
These business dashboards help executive leaders analyze sales performance and identify areas for improvement in the sales process. By focusing on key sales metrics, this view offers insights into how effectively the company is achieving its targets and objectives. Whether you need visibility into your sales pipeline or want to track the total sales cycle length, leveraging sales dashboards will help you drive growth.
Here are some of the top sales metrics typically seen in an executive sales dashboard:
Total revenue: Measures the total revenue generated from sales
Sales cycle time: The total time duration it takes to complete the sales process, from lead generation to deal closure
Lead conversion rate: Evaluates the total percentage of leads converted into customers
Geographic performance: Performance metrics across different regions
Total pipeline value: Measures the potential revenue in the sales pipeline
2. Executive finance dashboards
Executive financial dashboards offer stakeholders a comprehensive and real-time view of their financial data. The dashboard typically consolidates data from various financial sources into a single, intuitive interface, making it an effective tool for strategic planning. From expenses and revenue to cash flow and liquidity, you can track, analyze, and visualize data to find insights that will reduce costs and improve profitability.
Key metrics commonly included in an executive finance dashboard are:
Revenue growth: Measures the year-over-year or quarter-over-quarter growth percentage
Total expenses: Overall expenses for the current period
Operating income: Income generated from the core operations of the business
Net profit: Overall profitability after all expenses
Cash flow: Tracks the net amount of cash being transferred in and out of the business
3. Executive marketing dashboard
CEOs and CMOs use executive marketing dashboards to gain a high-level view of their organization’s marketing activities. By monitoring real-time marketing KPIs, you can analyze the performance of various marketing initiatives and campaigns and make data-driven decisions for optimization. These dashboards also help you keep a pulse on evolving customer behavior, including their demographics, choices, and preferences.
An executive marketing dashboard might include the following metrics:
Conversion rate: Measures the percentage of website visitors performing a desired action, such as making a purchase or filling out a form
Return on investment (ROI): Evaluates the total profitability of an investment when compared to its cost
Customer lifecycle value (CLV): Assesses the total revenue you can expect from a customer throughout their relationship
Return on ad spend (ROAS): Determines the total revenue generated against ad spend
Cost per lead: Average cost to generate a new lead
Customer acquisition cost: Measures the total expense incurred by a business to acquire a new customer
4. Executive HR dashboard
An executive HR dashboard provides CEOs and HR leaders with a comprehensive overview of key HR metrics and KPIs that directly align with the organization's long-term goals. These dashboards allow you to assess your workforce by identifying hidden trends and insights that optimize workforce management.
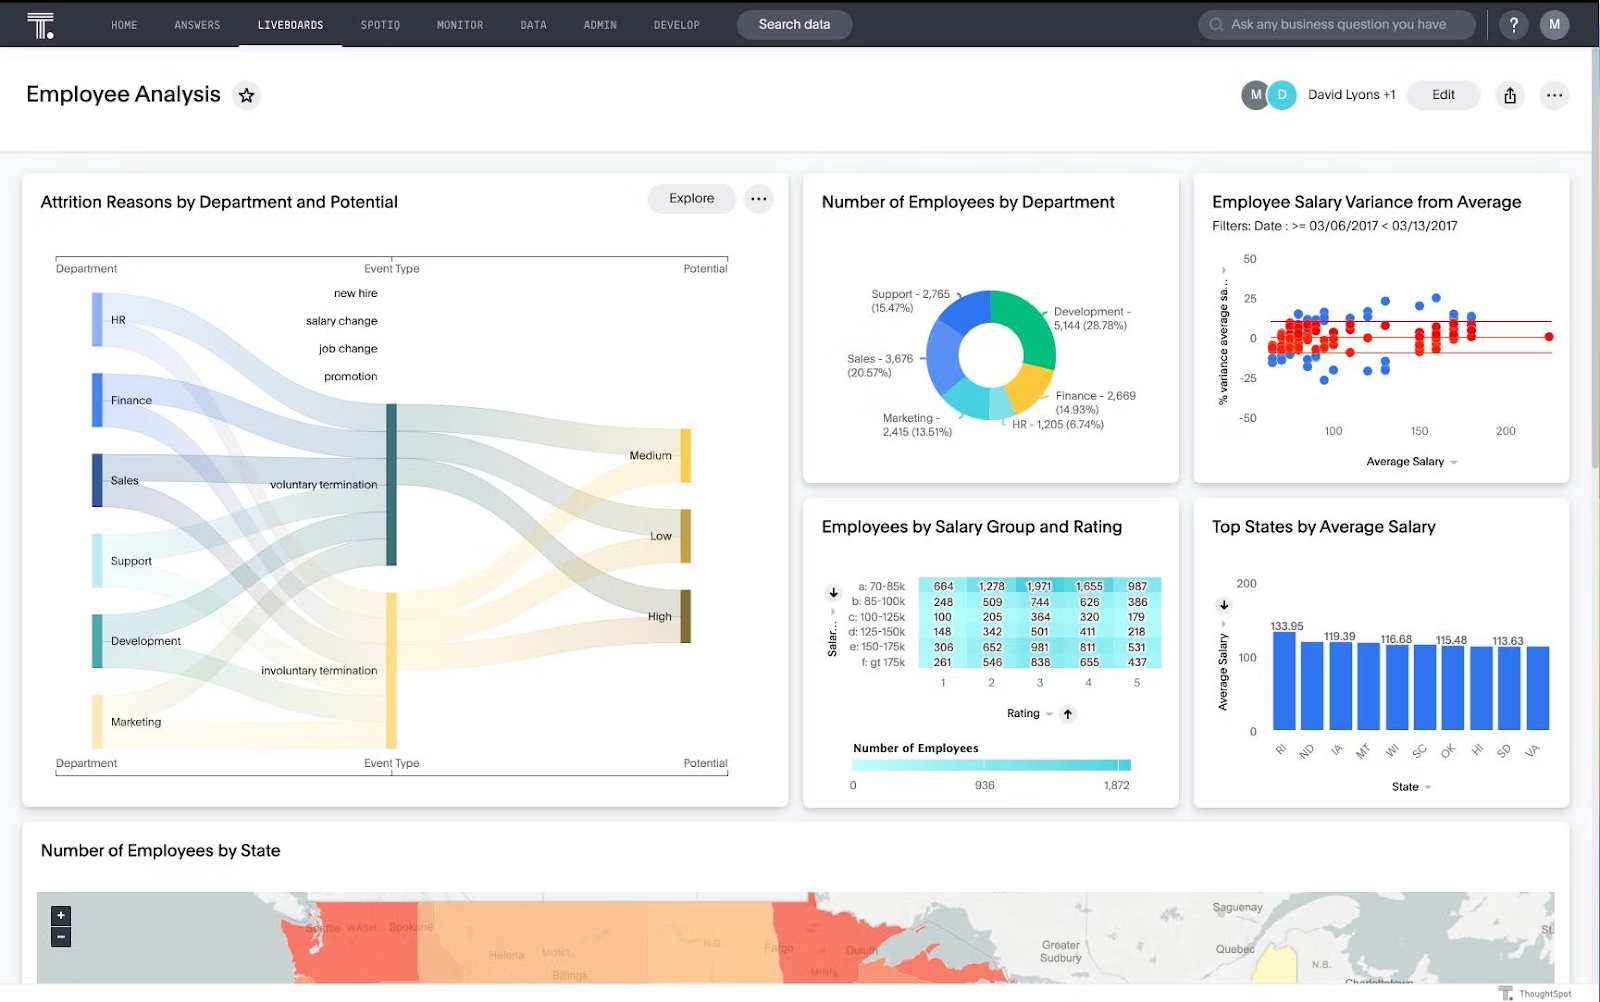
Top metrics and KPIs included in an executive HR dashboard are:
Cost per hire: Calculates the total cost involved in hiring a new employee
Employee satisfaction score: Measures the contentment levels of employees within the organization
Employee turnover rate: The total percentage of employees who leave the organization within a specific time period
Time to hire: The average time taken to fill a vacant position from the date the job is posted to the date the offer is accepted
Revenue per employee: Calculates the total revenue generated by an employee
It’s no longer enough to just have dashboards in your applications. You need real-time insights into KPIs that allow you to respond promptly to market shifts, emerging trends, and operational changes.
With ThoughtSpot’s AI-powered, search-driven approach to data analysis, you can ask complex business questions in natural language, drill into data, gain AI-powered answers, and create interactive data visualizations. Our AI-powered features go beyond basic data visualization and offers real-time insights so you can capitalize on emerging opportunities.
See how leaders leverage GenAI to drive growth with this playbook and schedule a ThoughtSpot demo today.

