


As a finance leader, you play a pivotal role in shaping your company's strategy and ensuring its financial health. With data pouring in from countless sources, the need for a centralized, real-time view of an organization's financial health has never been more critical. Relying solely on static reports and spreadsheets is no longer feasible.
In fact, a survey by Pigment found that 89% of finance leaders are making monthly decisions based on inaccurate or incomplete data. Modern finance leaders like you require dynamic tools that provide immediate insights into your company's current financial status—and its future. And the solution to all of these challenges lies in CFO dashboards.
Table of contents:
A CFO dashboard is a comprehensive visual tool used to monitor and manage the financial health of the organization. It consolidates all your essential financial metrics into a single, intuitive interface, providing real-time insights into key performance indicators (KPIs) that are important to you.
For example, imagine a CFO at a multinational corporation overseeing multiple subsidiaries across different regions. With different CFO dashboards, they can quickly assess each subsidiary's financial performance, compare revenues and expenses across regions, and identify areas for improvement in each market. This visibility allows them to make informed decisions and effectively allocate resources, driving overall company growth.
The diverse benefits of a CFO dashboard offer you and your organization a competitive edge. Here are some key advantages:
1. Financial monitoring: CFO dashboards provide a consistent overview of key financial metrics, allowing you to monitor performance trends over time. Their structured format helps track long-term progress and maintain historical data integrity. Modern tools like ThoughtSpot Liveboards revolutionize financial monitoring by offering intuitive, self-service analytics on real-time data, enabling you to promptly identify trends and opportunities.
Let’s take a look at Neobank Northmill. Before implementing ThoughtSpot’s Liveboards, Northmill’s data team spent countless hours building old-fashioned reports. Today, Northmill uses ThoughtSpot to develop Liveboards for users across finance, marketing, products, and customer service.
Here’s what Tobias Ritzé, Former CFO of Northmill Bank has to say about ThoughtSpot:
"I use ThoughtSpot to help manage the business every day, looking at metrics like sales performance across different time periods and conversion rates. It’s also a real benefit to have live data available in my phone and be able to answer questions on the spot in meetings. It certainly gives me an edge in the boardroom, in investors meetings, and so on. I can always check my phone and get the data that I want."
2. Enhanced decision-making: By consolidating essential financial data into a single, intuitive interface, CFO dashboards empower you to make data-driven decisions. Access to comprehensive insights enables strategic planning, resource allocation, and risk mitigation with greater precision and confidence. AI-powered analytics tools like ThoughtSpot can take your financial monitoring to the next level. With features like Spotter, your AI Analyst, you can search for insights the way you’d ask any question on your favorite search engine.
3. Better forecasting: CFO dashboards enable you to track trends over time and make informed decisions based on past patterns and current performance indicators. Modern analytics solutions like ThoughtSpot can augment your experience with predictive analytics.
For example, SpotIQ leverages machine learning to anticipate future trends with greater accuracy. SpotIQ's "what-if" scenario exploration provides deeper insights for proactive decision-making. By analyzing historical data and current performance metrics, you can anticipate challenges, identify opportunities, and develop proactive strategies to navigate changing market conditions effectively.
4. Facilitated compliance: With built-in monitoring of key compliance metrics, CFO dashboards help ensure adherence to regulatory requirements and internal policies. By flagging potential compliance issues early on, you can mitigate risks and avoid costly penalties, safeguarding the organization's reputation and integrity.
5. Strategic resource allocation: CFO dashboards enable you to optimize resource allocation by identifying areas of inefficiency or underperformance. By aligning investments with strategic priorities and business objectives, you can maximize ROI and drive sustainable growth.
6. Enhanced stakeholder communication: CFO dashboards, including executive dashboards, provide a visually engaging platform for communicating financial performance and insights to key stakeholders, including executives, board members, investors, and external partners. Clear, concise visualizations foster transparency, accountability, and trust, strengthening relationships and driving alignment toward common goals.
When it comes to a CFO dashboard, selecting the right KPIs is essential for gaining actionable insights and making informed decisions. Here are some of the most important KPIs commonly measured in a CFO dashboard:
Revenue growth rate: Measures the percentage increase in revenue over time
Gross profit margin: Indicates the profitability of core business operations
Net profit margin: Shows the percentage of revenue remaining as net profit after deducting all expenses
Return on investment (ROI): Measures the profitability of investments or projects
Current ratio: Assesses short-term liquidity by comparing current assets to current liabilities
Debt-to-equity ratio: Provides insights into financial leverage by comparing total debt to total equity
🔍21 financial KPIs and metrics you should track in 2024
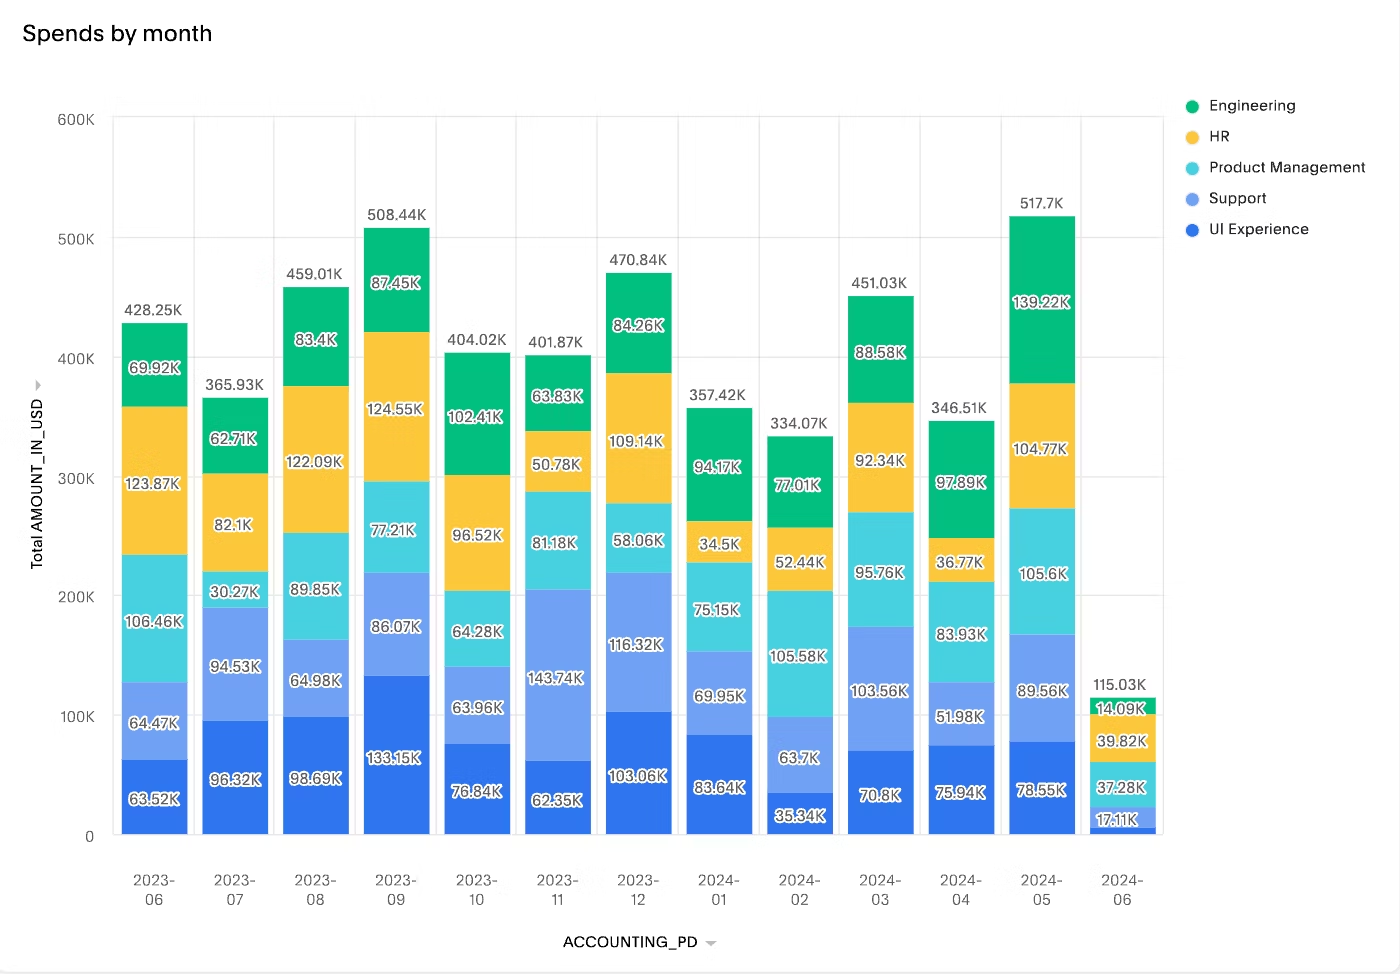
Revenue and profitability dashboard
A revenue and profitability dashboard serves as a vital tool, offering you a comprehensive view of financial performance. It provides key metrics such as revenue streams, profit margins, cost structure, and key performance indicators (KPIs) that help you assess your financial health.
By incorporating spending by month across various departments, the revenue dashboard becomes even more valuable, offering deeper insights into cost management. You can view breakdowns of expenses by department, such as marketing, sales, operations, finance, and human resources, allowing you to understand resource allocation better.
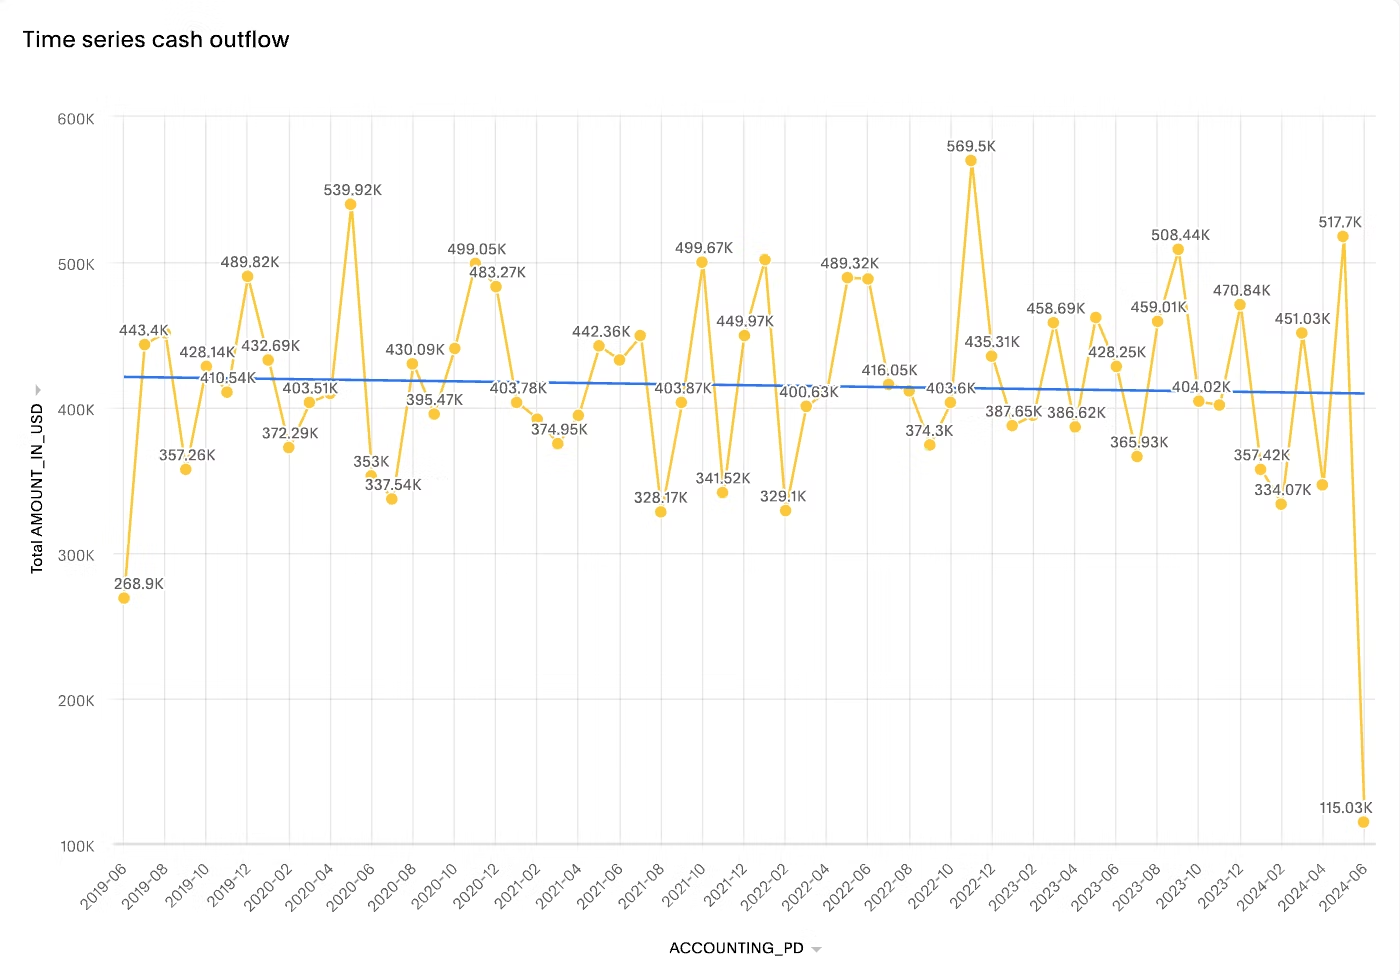
Cash flow dashboard
A cash flow dashboard is a powerful tool that offers real-time insights into your business’s financial health by visualizing cash inflows and outflows. It highlights key metrics like net cash flow, accounts receivable, and payable, and provides cash flow forecasting to predict future trends.
With intuitive graphs, charts, and automated alerts, it simplifies financial tracking and analysis, enabling you to make informed decisions quickly. This CFO dashboard example helps you avoid cash shortfalls, maximize growth opportunities, and reduce the stress of financial management by offering a clear, dynamic snapshot of your business's financial status.
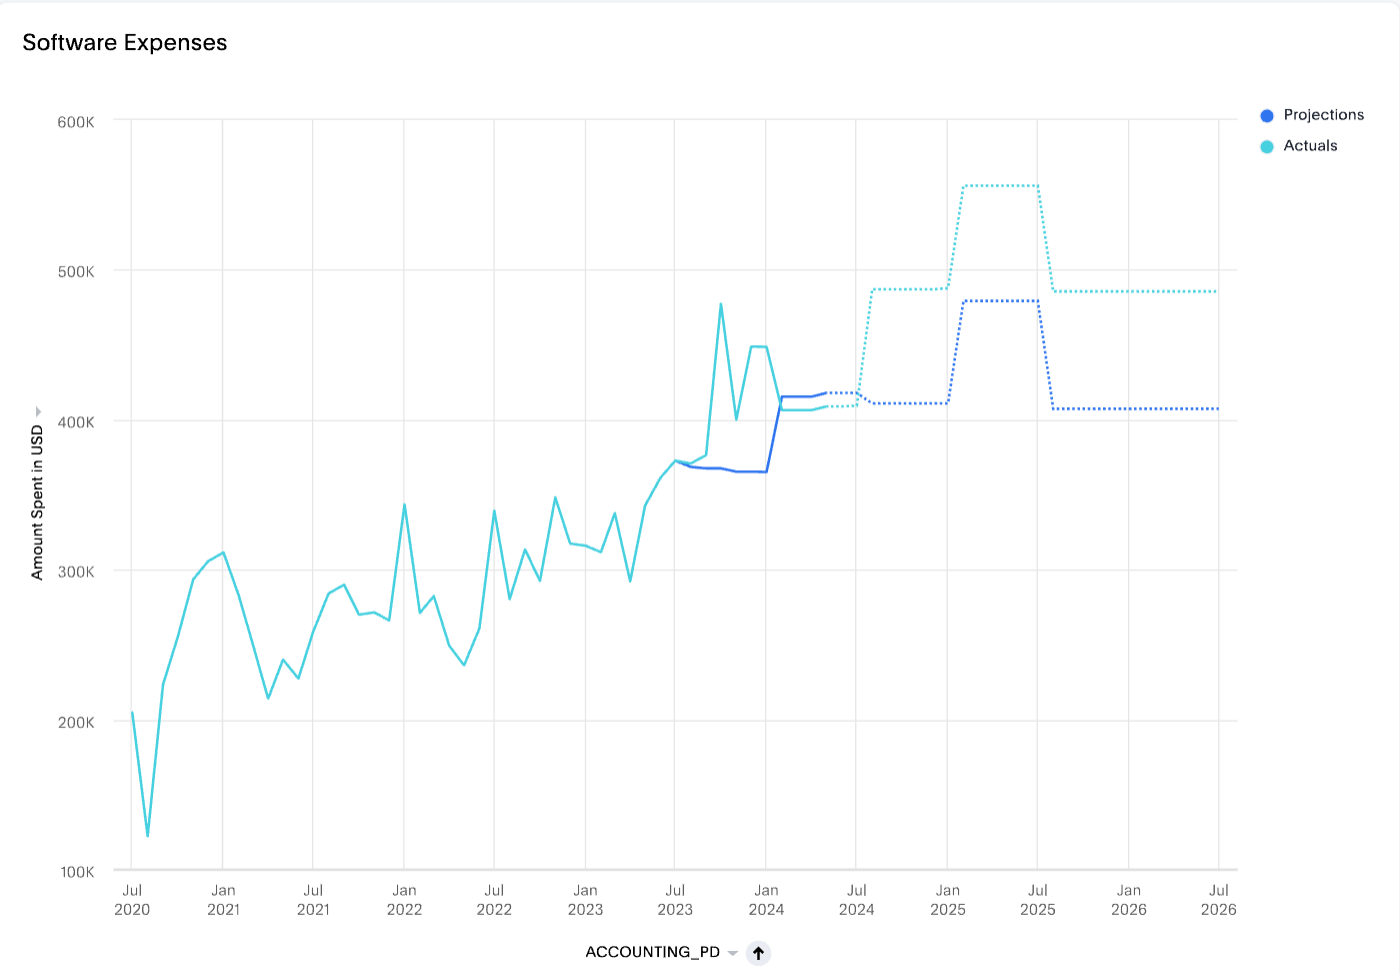
Expense management dashboard
An expense management dashboard is your go-to tool for keeping your business's spending in check. It provides a real-time, detailed overview of all your expenses, broken down into categories. You can track and analyze your expenses thereby managing costs effectively and making informed decisions.
With features such as expense tracking, budget monitoring, trend analysis, and detailed reporting, this dashboard offers you a holistic understanding of where your company’s money is being spent and how it aligns with your budgetary projections. Additionally, it allows you to project future expenses and compare them to actual spending.
The sheer complexity and volume of financial data make manual analysis tedious and error-prone. This is where advanced financial analytics software like ThoughtSpot becomes essential.
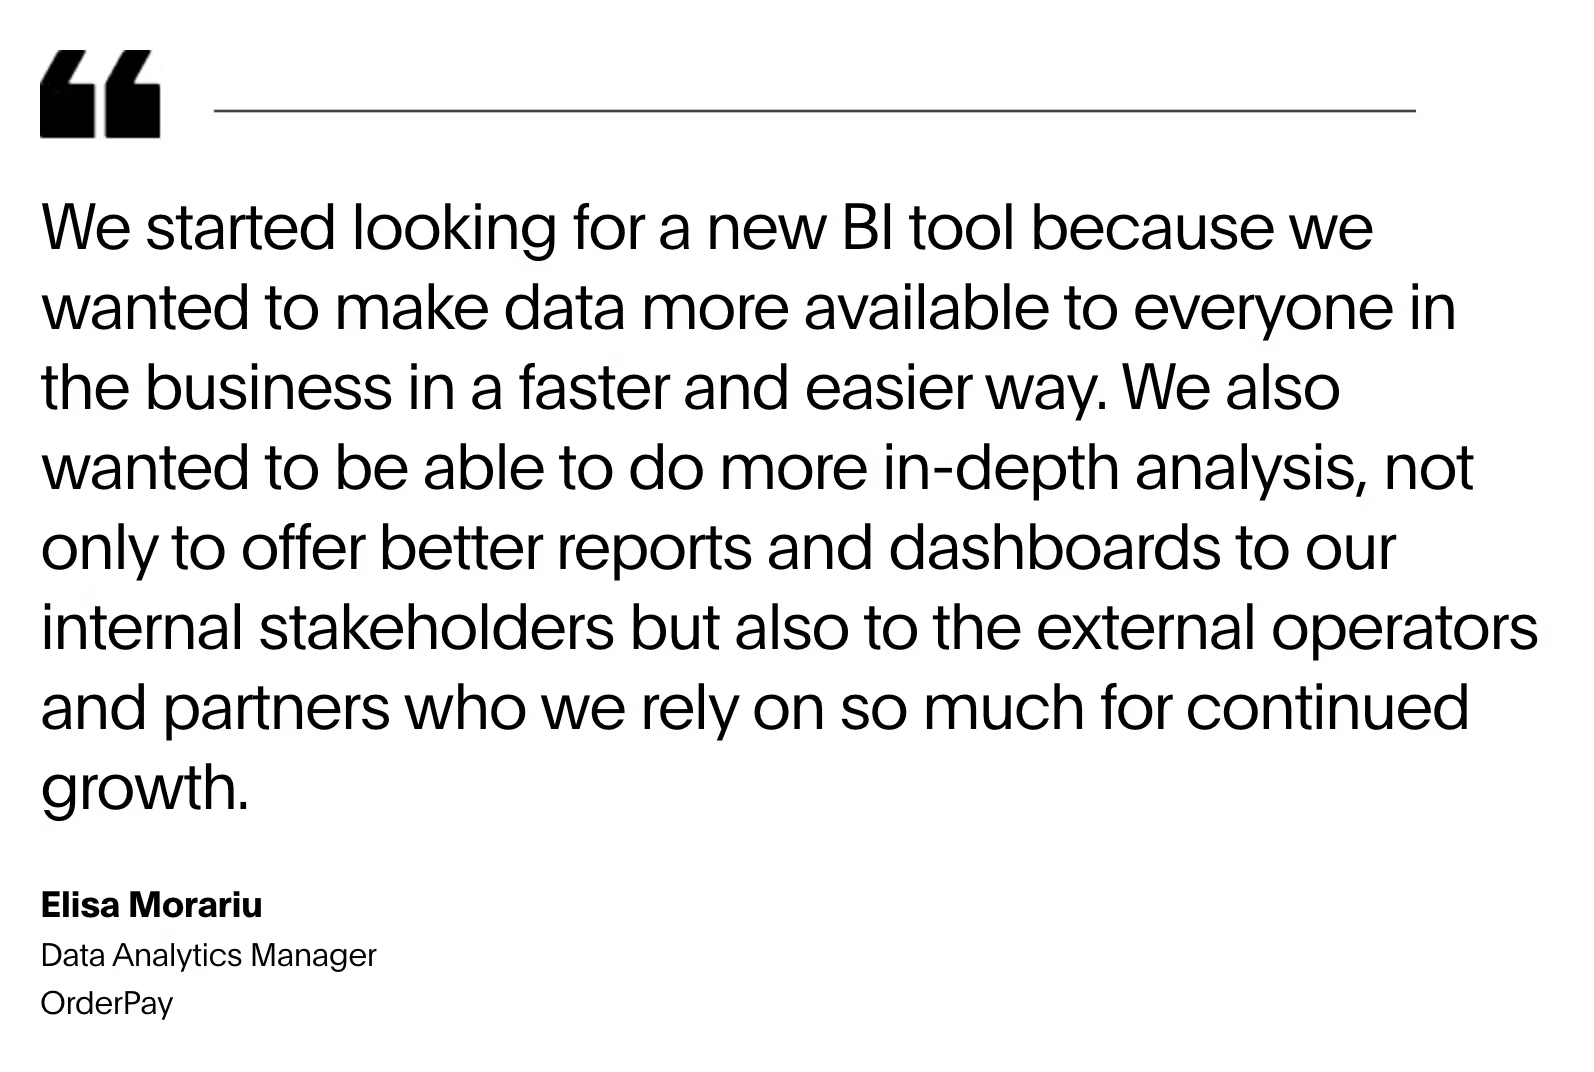
ThoughtSpot enables anyone in your organization to analyze data effortlessly using natural language search, much like typing into your favorite search engine or chatbot. With interactive data visualizations and artificial intelligence, ThoughtSpot helps you uncover insights that would otherwise remain hidden. That’s why businesses like PetSmart, Snowflake, and OrderPay rely on ThoughtSpot as their business intelligence solution.
Core benefits of ThoughtSpot
Liveboards provide a consolidated view of KPIs and metrics, enabling you to quickly understand the financial status of your organization's expenses, sales, and profits.
With ThoughtSpot’s self-service analytics, any business user can easily create their own data visualizations using a simple search interface.
AI-augmented analytics in ThoughtSpot detects anomalies and identifies opportunities for optimization, even when you don’t know exactly where to look.
💡 As someone who likely self-identifies as a number cruncher, you’ll appreciate Forrester’s report on The Total Economic Impact™ of ThoughtSpot.
Navigating financial data doesn't have to be daunting. With ThoughtSpot Liveboards, you can use AI-Powered Analytics to simplify complex financial information, unlock invaluable insights, and empower informed decisions in real time.
Experience the power of ThoughtSpot's Liveboards—schedule a demo today.


