


According to PwC, 73% of customers view their experience with a company as a crucial factor in their purchasing decisions. That makes analyzing these complex customer journeys a mighty but worthy challenge.
Dynamic customer experience (CX) dashboards provide timely insights into customer behavior, preferences, and satisfaction levels to help you provide champion-building customer experiences. Let’s take a closer look.
Table of contents:
A customer experience dashboard is a visual representation of key metrics to track, analyze, and understand how your customers interact with a product or service. It can help you determine trends, identify issues, evaluate customer feedback, and improve your overall customer satisfaction levels.
Your CX dashboard, or as we call it—Liveboard, is the central hub for critical customer data. It allows you to track and visualize your customer's journeys, including their touchpoints with your products.
For instance, consider a retail analytics dashboard. It might showcase metrics such as purchase patterns, product popularity, and customer feedback sentiment. With these insights, you can ensure every customer interaction is a positive one.
Data integration: CX dashboards merge data from diverse sources like CRM systems, social media platforms, and customer feedback channels—into a unified view. They facilitate thorough analyses and actionable insights.
Advanced analytics: By harnessing techniques such as predictive modeling, machine learning, and natural language processing, CX dashboards empower you to uncover concealed patterns and correlations.
Real-time insights: Customer experience dashboards offer real-time visibility into customer interactions and feedback, providing valuable data for customer analytics. It enables you to monitor performance metrics and key performance indicators (KPIs) as they evolve.
Personalization opportunities: Insights from customer experience dashboards inform tailored marketing campaigns, product recommendations, and service offerings which enhances the overall customer experience, nurturing stronger relationships and increasing customer lifetime value.
Continuous improvement: Supporting a culture of continuous improvement, customer experience dashboards provide ongoing feedback and insights, allowing you to adapt to evolving customer needs and market dynamics.

A customer experience dashboard can measure a wide range of metrics tailored to your specific business needs and goals. Here are some common metrics you might include:
Customer satisfaction (CSAT): This metric gauges how satisfied customers are with your products or services. It's often measured through feedback forms or surveys. To calculate CSAT, use the formula below:

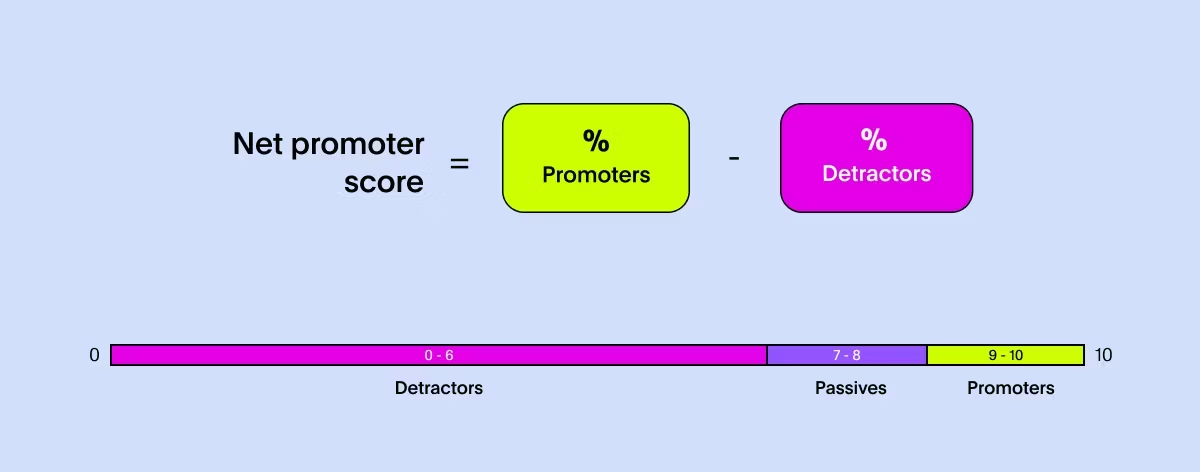
Net Promoter Score (NPS): NPS measures the likelihood of customers recommending your business to others. This metric is a good indicator of overall customer loyalty and advocacy. NPS quantifies customer loyalty by asking, "How likely are you to recommend us?" Responses are categorized as Promoters (9-10), Passives (7-8), and Detractors (0-6), with the score calculated by subtracting Detractors from Promoters.
Customer Effort Score (CES): CES measures how easy or difficult it is for customers to interact with your company or use your products/ services. A lower score indicates a smoother customer experience.
Customer retention rate: This metric denotes how many customers continue to do business with you over time. A high retention rate implies satisfied and loyal customers.
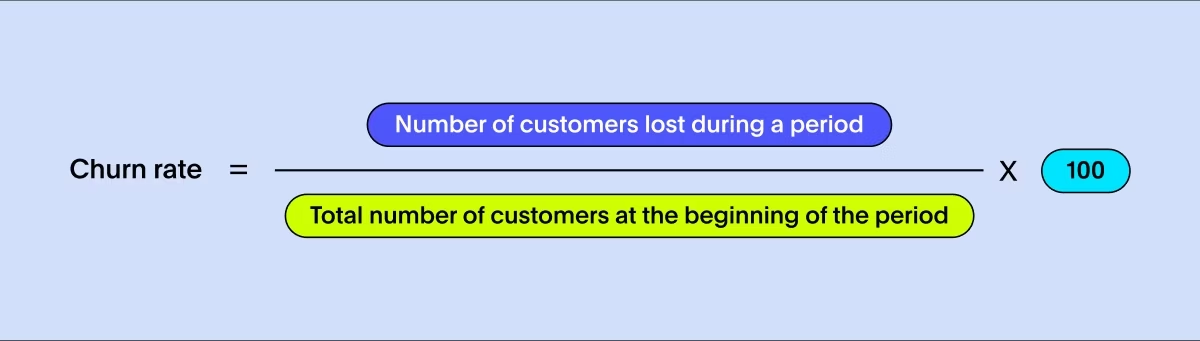
Churn rate: The churn rate is the percentage of customers who stop using your products or services over a certain period. It's the opposite of the retention rate and is crucial for understanding customer attrition. To calculate the churn rate, use the formula below:
Average resolution time: This calculates the average time it takes for customer issues or inquiries to be resolved. Faster resolution times generally lead to higher satisfaction.
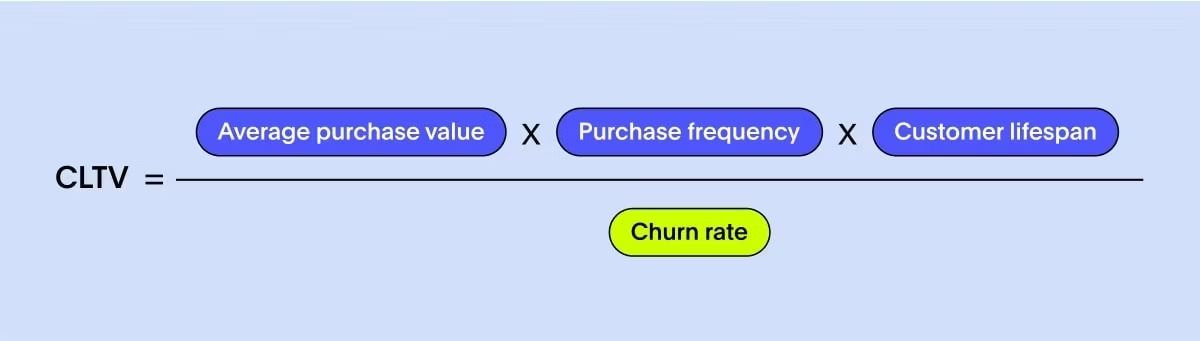
Customer Lifetime Value (CLTV): CLTV estimates the total value a customer brings to your business over their entire relationship with you. It helps prioritize measures to retain high-value customers. To calculate CLTV, use the formula below:
Customer segmentation: Segmenting customers based on demographics, behavior, or purchase history can provide valuable insights into different customer group's preferences and needs.
Social media engagement: Monitoring social media interactions such as likes, shares, and comments can indicate customer sentiment and brand engagement levels.
Website analytics: Tracking website metrics like traffic, bounce rate, and conversion rate is essential for understanding the digital customer journey and improving marketing KPIs.
Step 1: Define your KPIs and metrics
Start by clearly defining the objectives of your customer experience dashboard. Specify what distinct aspects of the customer experience you want to measure and improve. Identify a mix of perception, descriptive, and outcome metrics that align with your objectives:
Perception metrics: Gauge how customers feel about their interactions with your business. Examples include Net Promoter Score (NPS) surveys, Customer Effort Score (CES) scores, and sentiment analysis from customer feedback.
Descriptive metrics: Capture observable events or actions that occur during customer interactions. They include first-call resolution rates, website navigation paths, and customer service response times.
Outcome metrics: Track the actions that customers take as a result of their interactions with your business like booking a demo, requesting a quote, making a purchase, or subscribing to a service.
The metrics above are the basis of your dashboard, offering insights into various aspects of the customer experience to improve satisfaction and loyalty.
Step 2: Choose the right data sources for your dashboard
Select the correct data sources for your dashboard, including structured and unstructured data. Platforms like ThoughtSpot connect to various data sources, such as customer relationship management (CRM) systems, customer feedback surveys, and data warehouses. This allows your data team to quickly connect and start searching on top of your live data.
For instance, surveys offer direct feedback from customers, reviews provide valuable insights into customer needs, monitoring social media conversations can reveal perceptions of your brand, and tracking data from your CRM systems will give you a real-time view of your business's health and performance.
💡Selecting the right data sources can be challenging—see why “Context is Gold.”
Step 3: Design and create visualizations
Determine the layout and structure of your dashboard while simultaneously creating visualizations of the data. With traditional dashboard tools, creating a visually compelling and insightful dashboard often involves several steps and a fair amount of manual effort. You must outline the layout meticulously, deciding which chart to place where and ensuring that the most important data is prominently displayed. Moreover, adding interactive features like drill-downs can be time-consuming, often requiring custom SQL and scripts.
ThoughtSpot Liveboards provide a modern approach to data visualization and analytics, surpassing the limitations of legacy BI tools. They provide a user-friendly layout that effectively communicates key insights at a glance. This may include various visualizations such as bar charts, line graphs, pie charts, and heat maps, tailored to represent the data. The user experience is enhanced with built-in interactive features that allow users to explore the data in more detail, such as drill-down, filtering, and AI-assisted analysis.
Step 4: Deploy and monitor
Once your dashboard is ready, deploy it to your intended audience. Start by identifying key champions within your organization who can promote the adoption of dashboard. These champions can lead by example and encourage others to embrace the tool. Implement gamification elements like leaderboards and competitions to make using the dashboard fun and engaging. Hold regular training sessions to educate users on how to utilize it effectively.
After deploying the dashboard, it’s crucial to monitor its usage and drive continuous improvement. Establish a regular monitoring schedule, typically on a monthly or quarterly basis. Metrics to consider while monitoring usage include the number of active users, duration of sessions, and frequency of logins. Furthermore, maintaining communication with your champions is essential for sustaining momentum and driving adoption. These deployment and monitoring strategies are applicable to both legacy tools and modern solutions like Liveboards.
Step 5: Continuously improve
Customer needs and business requirements evolve over time, so it's important to continuously monitor and update your dashboard to ensure it remains aligned with your goals and objectives. Regularly review the data, solicit feedback from users, and incorporate new features or visualizations as needed to enhance the value of your customer experience dashboard.
1. Neobank Northmill
Northmill is a Swedish neobank focused on enhancing everyone's financial life by offering personalized banking services built on intelligence. It has set itself apart by using data to build a banking experience that's smart, relevant, and personalized—or as they say, “Digital, yet personal.”
That goal was hindered by Northmill’s legacy BI tool, which left the data team spending endless hours manually building reports. Seeking to harness the full power of their customer data, they decided to look for a robust, future-proof modern data stack and self-service analytics platform.
Today, Northmill analyzes user data to pinpoint the exact steps in the onboarding process where people tend to drop off using ThoughtSpot. These insights led to initiatives that boosted conversion rates by a whopping 30%.
“It is all about being as relevant and personal as possible so users’ personal finance can benefit from the insights.”
2. Canadian Tire
During the early stages of the pandemic, Canadian Tire utilized customer analytics from ThoughtSpot to uncover cross and upsell opportunities within their pets department. By analyzing purchasing behavior, they identified new pet owners as an untapped market.
By developing targeted upselling and cross-selling strategies to pet parents, Candian Tire was able to boost sales by 20%, even as 40% of their brick-and-mortar stores temporarily closed.
3. Levi Strauss & Co
In an episode of The Data Chief, Dr. Katia Walsh, Former Chief Global Strategy and AI Officer of Levi Strauss & Co. emphasized the pivotal role of digital data and AI-augmented analytics solutions in enhancing in-store experiences.
Recognizing the evolving landscape of retail, Levi Strauss strategically leverages business intelligence to personalize and elevate every aspect of the customer journey. This strategic approach, centered around what Walsh calls the "three Cs," underscores the brand's commitment to innovation and customer-centricity.
1. Connections
2. Commerce, and
3. Creation
“Every company today is a data and tech company, whether it realizes it or not.”
Levi Strauss perfectly captures the blend of technology and human touch, creating immersive and tailored experiences that deeply connect with consumers. Through a mix of data-driven insights and intuitive design, Levi's creates meaningful interactions that forge lasting connections with its diverse clientele.
🎧Listen to the full episode here:
Unlocking the full potential of your data can often feel like a daunting task. Legacy dashboard software falls short by not providing self-service analytics for all users, thus placing undue strain on the data team to generate every dashboard and report.
However, with ThoughtSpot, it's a whole different story. Our AI-Powered Analytics, Spotter, drastically reduces the time needed to derive value from your data. What sets ThoughtSpot apart is its unique and intuitive approach to data exploration and analysis—simply ask questions about your data and receive AI-assisted answers, recommendations, and visualizations in return.
Experience how effortless it is to create ThoughtSpot Liveboards. Schedule a demo today.


