


Studies show we understand and retain information better when it's presented visually, making data visualization an essential tool for modern organizations. Data is crucial for optimizing operations and enhancing organizational efficiency. However, without the right tools, it can be overwhelming and underutilized.
Businesses generate vast amounts of data daily—from sales figures to customer interactions and social media engagements—but many business leaders struggle to gain insight from this wealth of information. Data visualization dashboards can solve this problem by harnessing the power of visual representation to transform complex datasets into clear, actionable insights. Why stick to boring spreadsheets when you can leverage the power of visual storytelling?
Table of contents:
A data visualization dashboard is a powerful tool that consolidates and presents data in visual formats such as charts, graphs, and maps. This visual representation allows you to quickly grasp key performance indicators (KPIs) and trends, enabling you to make informed decisions. Think of it as a visual summary of your most critical data points, providing a comprehensive overview at a glance.
For instance, imagine you're a marketing manager tracking campaign performance. Instead of sifting through spreadsheets, a real-time dashboard show you the most updated data on ad spend, click-through rates, and conversion metrics, all in an easily digestible visual format.
1. Enhanced data comprehension
Data visualization dashboards simplify complex information, allowing for a better understanding of relationships and trends. This approach allows you to quickly and intuitively understand patterns, correlations, and trends within the data. Traditional dashboards often present data in static formats like tables or basic charts, making it challenging to grasp intricate connections. This lack of insight can lead to inefficiencies and oversights due to the need for manual analysis across multiple screens.
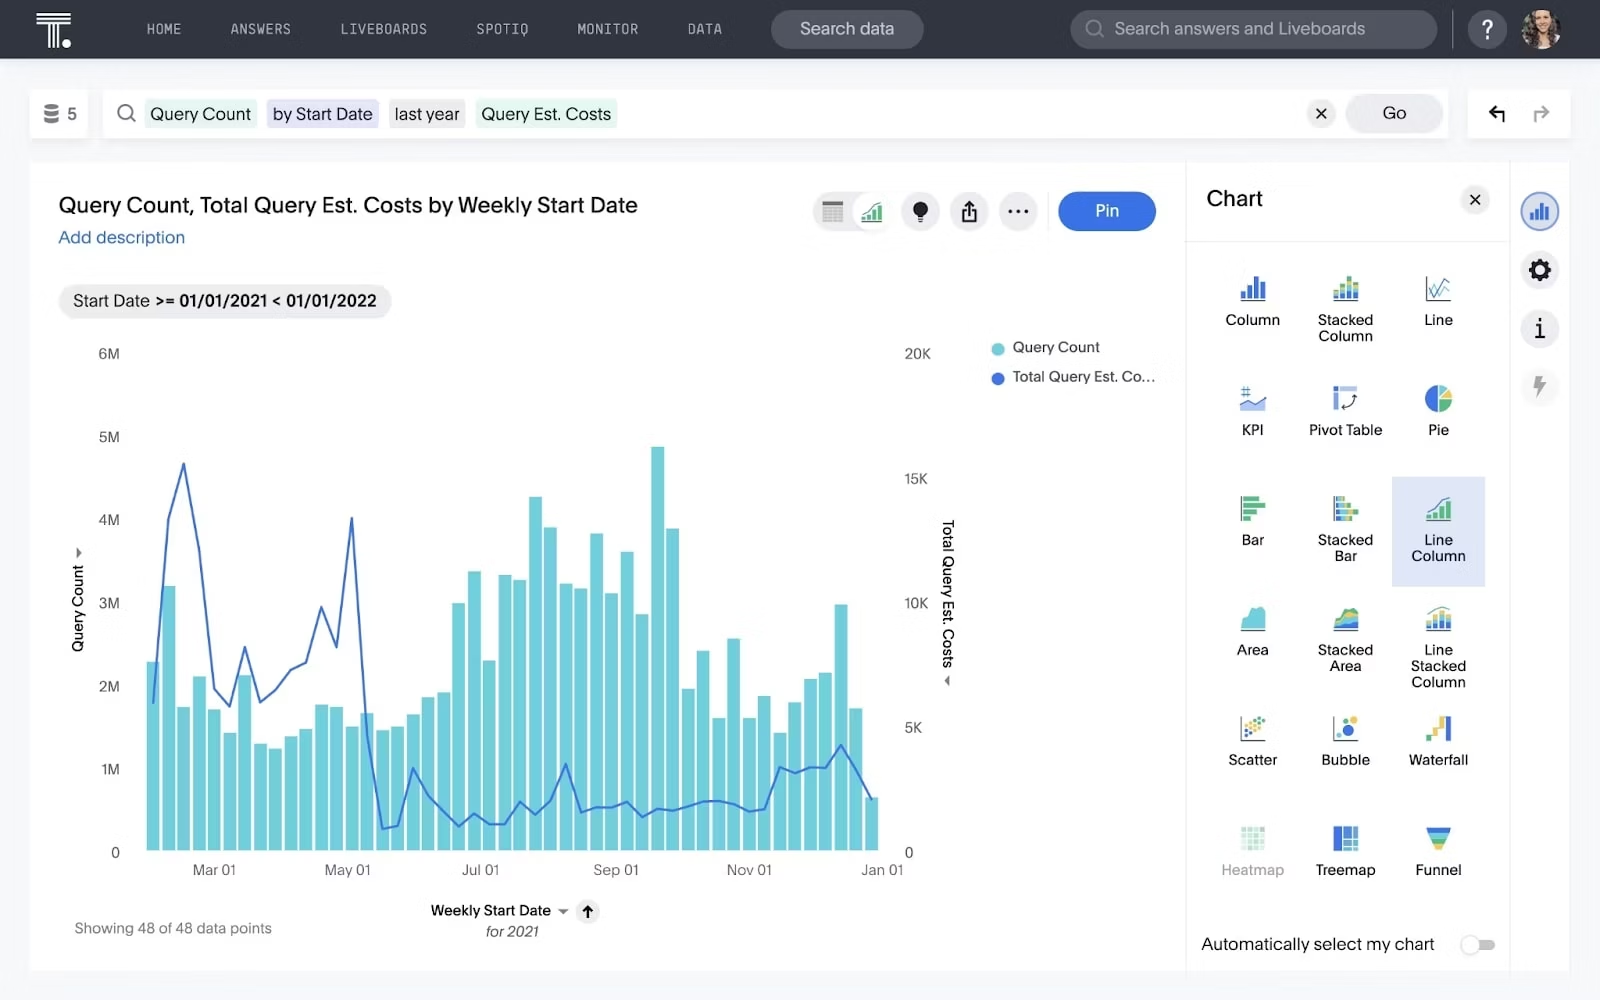
Modern tools like ThoughtSpot provide Liveboards that leverage advanced data visualization techniques to transform complex data into intuitive charts, graphs, and interactive maps.
2. Timely data access
Having timely access to data is crucial for effective decision-making, especially in fast-paced environments where conditions shift rapidly. Real-time insights allow organizations to respond quickly to market changes, customer needs, and operational challenges.
However, most dashboards typically rely on static or periodic data updates, which can result in outdated information and limit your ability to make the most informed decisions.
ThoughtSpot’s interactive Liveboards provide real-time data updates, ensuring decision-makers have access to the most current information available. This real-time capability is crucial for industries such as finance, where market conditions can change in mere minutes, or healthcare, where immediate responses to patient data are essential.
For a real-world example of insight in action, take Fabuwood, a cabinet manufacturing company that leverages Liveboards as its central information hub. With 50 employees actively using ThoughtSpot, this access to real-time insights empowers every member of the company—from executives to frontline decision-makers—to base their actions on data rather than intuition.
3. Interactive data exploration
The ability to interact with data is crucial for dynamic exploration and deeper interpretation. When users engage with data, they uncover insights that might be missed in static views. To fully leverage the power of a data visualization dashboard, advanced interactive features are essential, which you cannot find in most legacy dashboards.
ThoughtSpot Liveboards incorporate interactive elements such as drill-downs, filters, and tooltips, allowing you to explore data dynamically. You can view specific data points, compare trends over time, or analyze correlations between different metrics.
4. Improved decision-making
Data visualization dashboards convert complex information into clear visuals, empowering organizations to take decisive, data-driven action. By presenting data in an easily digestible format, these dashboards facilitate quicker and more informed decisions.
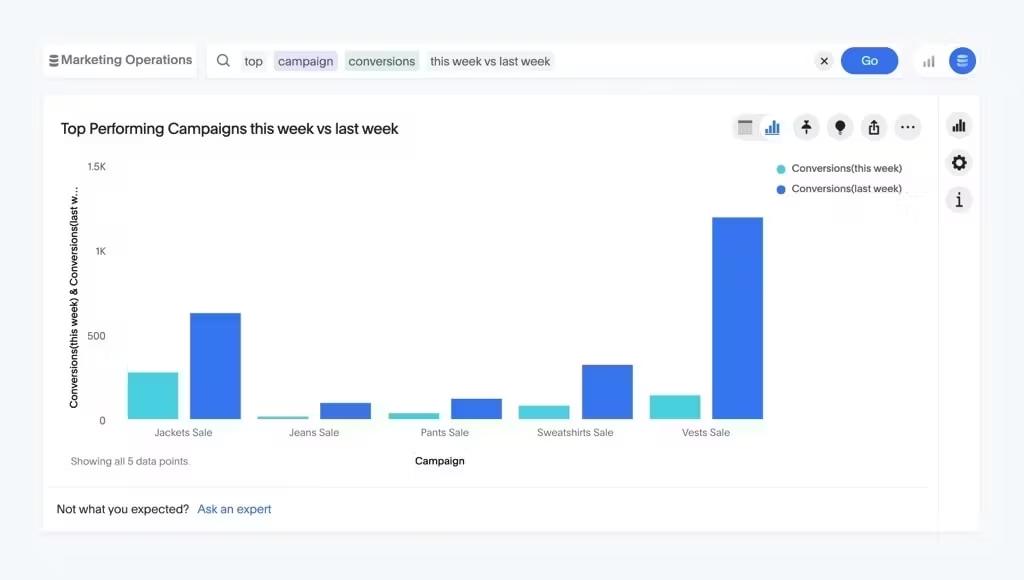
Some traditional dashboards lacking the agility to respond to new information in fast-paced environments and requiring cumbersome manual processes for data updates and analysis. While AI-driven solutions like ThoughtSpot enhance this capability with intuitive features like natural language search. Users can interact with business data, similar to conducting everyday web searches or chatting with a virtual assistant.
5. Mobile accessibility
In today's mobile-centric world, easy access to critical data on the go is essential for effective decision-making. Mobile-friendly dashboards empower users to stay informed and make timely decisions, regardless of their locations. Many legacy dashboards, however, lack mobile optimization, which in turn limits access to important information outside the office.
ThoughtSpot Liveboards are designed for mobile accessibility, allowing users to access and interact with data from any device, anywhere. Whether in the office, on-site, or traveling, decision-makers can stay informed and effortlessly make data-driven decisions.
Financial analytics dashboard
The financial analytics dashboard serves as a comprehensive platform for monitoring and analyzing data crucial for strategic decision-making and financial planning. By turning complex data into easy-to-understand visuals, it helps stakeholders quickly grasp key financial insights. Whether tracking revenue trends, managing expenses, or visualizing cash flow, the dashboard offers real-time information essential for informed decisions.
Key metrics to track:
Revenue analysis: Monitor trends in sales revenue to identify growth opportunities and assess the effectiveness of sales strategies
Expense management: Track and analyze expenses across departments or projects to control costs and optimize budget allocations
Cash flow visualization: Visualize cash-flow patterns to effectively manage liquidity, anticipate financial needs, and ensure timely payments
Financial ratios: Evaluate key financial ratios such as ROI, profit margins, and debt-to-equity ratio to gauge financial health and performance benchmarks
🔍21 financial KPIs and metrics you should track in 2024
Modern Restaurant Concepts uses Liveboards to provide general managers with seamless access to sales and labor data across its national chains. This visibility allows the finance team to simplify budgeting, establish accurate goals, and swiftly analyze sales performance against anticipated forecasts.
As we continue to move more and more data into one reporting platform, we have already been able to focus on deeper data-driven decisions being made at every level
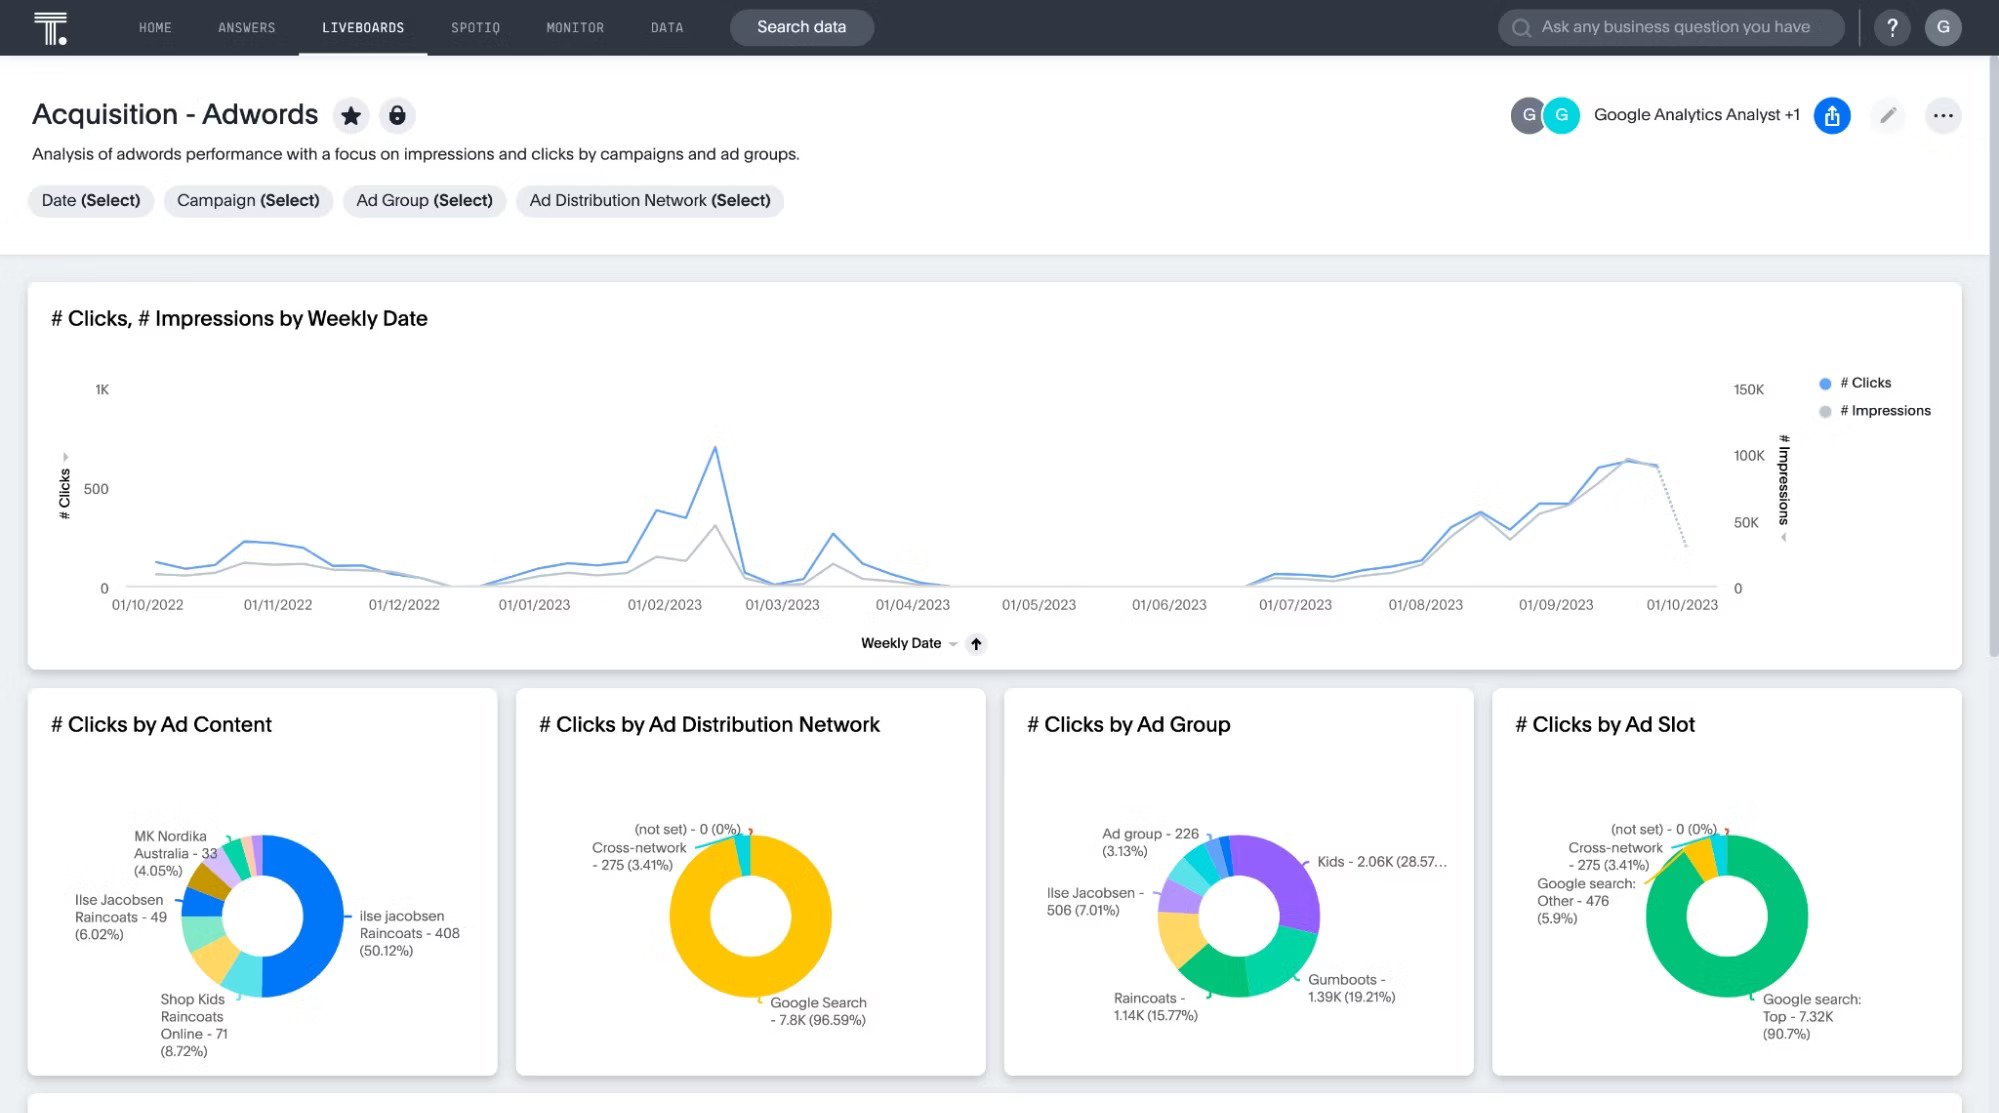
Marketing campaign dashboard
The marketing campaign dashboard leverages data visualization to provide a clear and comprehensive view of your marketing initiatives. By transforming complex data into intuitive charts and graphs, this dashboard offers actionable insights into campaign effectiveness, audience engagement, and return on investment (ROI). With these visual tools, you can easily track performance across different channels, identify trends, and make data-driven adjustments to optimize strategies and maximize revenue generation.
Key metrics to track:
Campaign performance: Monitor metrics such as ad spend, impressions, click-through rates (CTR), conversion rates, and cost per acquisition (CPA) to assess campaign success and adjust tactics accordingly
ROI analysis: Measure the return on investment for each marketing campaign or channel to effectively allocate resources and prioritize high-performing strategies
Customer segmentation: Analyze customer demographics, behaviors, and preferences to tailor marketing messages and improve targeting accuracy
Social media analytics: Track engagement metrics, sentiment analysis, and audience feedback from social media campaigns to refine content strategy and enhance brand perception
🔍15 marketing KPIs and metrics to track in your dashboard
Healthcare analytics dashboard
The healthcare analytics dashboard utilizes data visualization to enhance patient care outcomes, operational efficiency, and healthcare delivery. By presenting clinical and operational data in clear and actionable visual formats, this dashboard empowers healthcare administrators and providers with insights that support informed decision-making and improve patient experiences.
Key metrics to track:
Patient metrics: Monitor metrics such as patient wait times, bed occupancy rates, treatment outcomes, and patient satisfaction scores to optimize care delivery and patient flow management
Staff performance: Evaluate healthcare provider productivity, adherence to clinical protocols, and patient interaction metrics to ensure quality care and operational excellence
Resource allocation: Optimize resource utilization, including staffing levels, equipment availability, and facility utilization to improve efficiency and reduce operational costs
Clinical KPIs: Analyze clinical data such as disease prevalence, treatment efficacy, and patient demographics to support evidence-based care, enhance treatment protocols, and improve patient outcomes
🔍 15 healthcare KPIs & metrics you should track in 2024
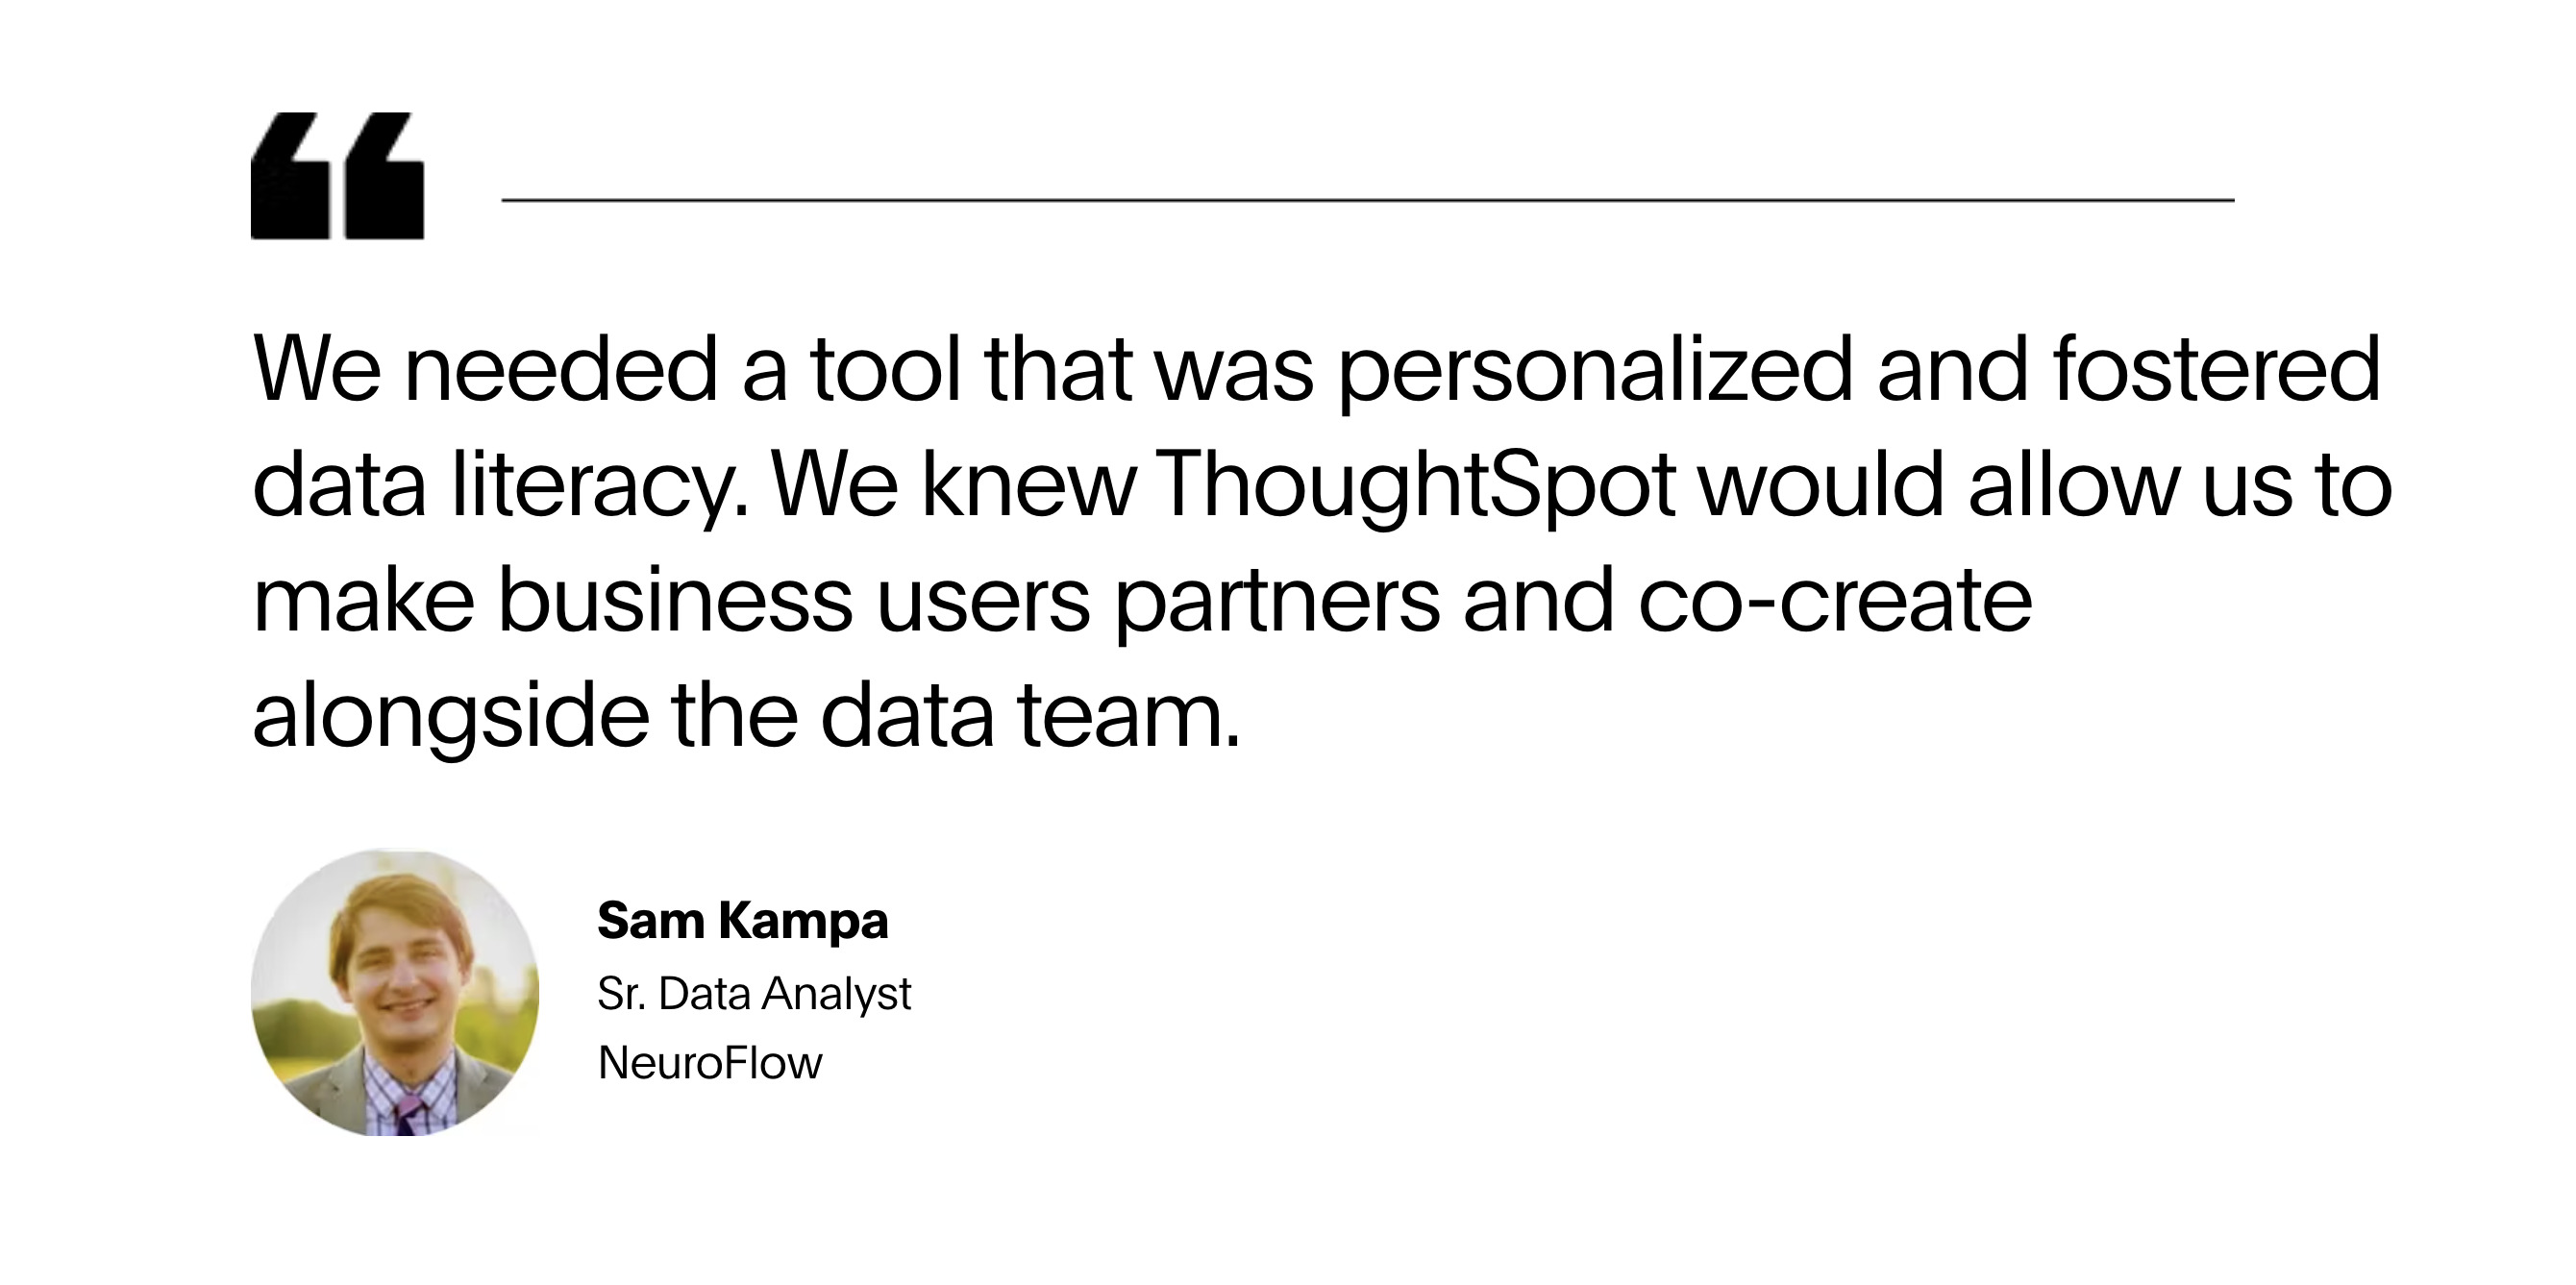
ThoughtSpot is helping NeuroFlow, a company dedicated to improving mental health outcomes, and reshaping the delivery and adoption of integrated healthcare. Its intuitive search-based interface and powerful analytical capabilities empowered everyone in the organization to access data and effortlessly build and share Liveboards.
Sales performance dashboard
The sales performance dashboard provides sales teams and managers with a holistic view of sales metrics, allowing users to monitor performance, identify trends, and make data-driven decisions to drive revenue growth and achieve sales targets.
Key metrics to track:
Sales metrics: Monitor metrics such as sales revenue, units sold, average order value (AOV), and sales pipeline status to assess sales performance and forecast future revenue streams
Product performance: Analyze top-selling products, market share by product category or region, and customer acquisition costs (CAC) to prioritize sales efforts and optimize product strategies
Sales forecasting: Predict future sales trends based on historical data analysis, market trends, and customer insights to anticipate demand and adjust sales strategies proactively
Regional analysis: Compare sales performance across different regions or territories to identify geographical opportunities, market trends, and regional variations in customer preferences
🔍 Top 16 sales metrics and KPIs to track in 2024
Real-time insights are crucial for making informed decisions. ThoughtSpot offers dynamic and interactive data visualizations that deliver insights right when and where you need them.
Here are several ways ThoughtSpot Liveboards quickly deliver value:
SpotIQ utilizes AI-assisted analytics to uncover hidden insights.
Verified dashboards establish data governance and uphold quality standards throughout the organization.
Connectors effortlessly transmit data to your business team when required, eliminating the need to build and maintain integrations.
Data on-the-go facilitates real-time data tracking on mobile devices, empowering you to make data-driven decisions anywhere and at any time.
Don't settle for static spreadsheets when you can visualize your data's potential. ThoughtSpot's Liveboards offer a window into real-time insights, empowering you to lead with confidence and clarity.
Unlock actionable intelligence and stay ahead in today's fast-paced business environment–take a product tour today.


