


As an online retailer, you face a growing array of customer expectations—more flexibility, greater personalization, and a cohesive experience across all channels. This point is driven home by a recent report from PWC, which shows 73% of customers view their experience as a crucial factor in their purchasing decisions.
To keep a pulse on evolving customer behavior, online business leaders are turning to e-commerce dashboards. These business dashboards are essential for identifying important customer trends, recognizing patterns, and making accurate sales forecasts. In this guide, we explore the ins and outs of e-commerce dashboards so you, too, can create and fine-tune your own.
Table of contents:
An e-commerce dashboard is a visual interface that helps store owners, managers, and marketers track and analyze the performance of their e-commerce operations. They collect data from various sources in a business intelligence platform and display relevant key performance indicators (KPIs), metrics, and trends, allowing you to monitor the health of your business and make smarter, data-driven decisions.
1. Better insights into customer behavior
Accenture research shows that 65% of customers are more likely to shop with a retailer if they feel remembered, recognized, and receive relevant recommendations. With e-commerce dashboards, you can analyze customers' past purchase history and engagement levels to identify relevant trends and patterns. This high-level vantage allows you to assess campaign performance and make necessary adjustments.
Moreover, with modern dashboard solutions like ThoughtSpot, you can create interactive Liveboards that facilitate a hands-on approach, empowering users to monitor KPIs in real-time, customize visualizations, and tell great data stories.
Companies like Northmill use ThoughtSpot’s Liveboards to visualize real-time customer data and create more personalized banking experiences for their customers. For example, by analyzing massive amounts of user data, they were able to identify areas for improvement in the onboarding process, leading to a notable 30% boost in conversion rates.
“It is all about being as relevant and personal as possible so users’ personal finance can benefit from the insights. It can be getting a notification of a discount deal at your favorite cafe or a tailored offer to lower the cost of your insurance.”
2. Improved sales performance
With e-commerce dashboards, you gain a concise and accessible overview of various sales-related data points, allowing you to monitor performance and drive revenue. Whether you’re comparing month-on-month sales growth or making decisions regarding resource allocation, e-commerce dashboards provide a visually intuitive snapshot of your store's sales health.
AI-powered analytics solutions like ThoughtSpot can further elevate your sales performance. By leveraging interactive Liveboards and natural language search, you can simply ask questions about your e-commerce sales data and get AI-powered answers and visualizations. This level of granularity allows you to pinpoint inefficiencies and capitalize on emerging opportunities.
💡Dashboards are Dead. Yes, we said it. See why business leaders are choosing Liveboards over static dashboards.
3. Enhanced inventory management
If inventory at your online store runs low, you might need to pay rush fees or expedited shipping fees to restock quickly enough to meet your customer obligations. To avoid such costly scenarios, you can harness the power of e-commerce dashboards to keep a pulse on important e-commerce KPIs—such as inventory turnover ratio, cost per item, stockout rate, and return rate. Monitoring performance over time can help you make informed decisions about inventory restocking and logistics, leading to faster order fulfillment times and lower stockout costs.
With ThoughtSpot’s SpotIQ, you can take your inventory management to the next level. The "what-if" scenario helps you analyze historical sales data and current performance metrics to anticipate future demand for goods. This analysis will help you develop proactive strategies to navigate changing market conditions effectively.
See how Canadian Tire was able to grow sales by 20% during the pandemic by forecasting demand with ThoughtSpot.
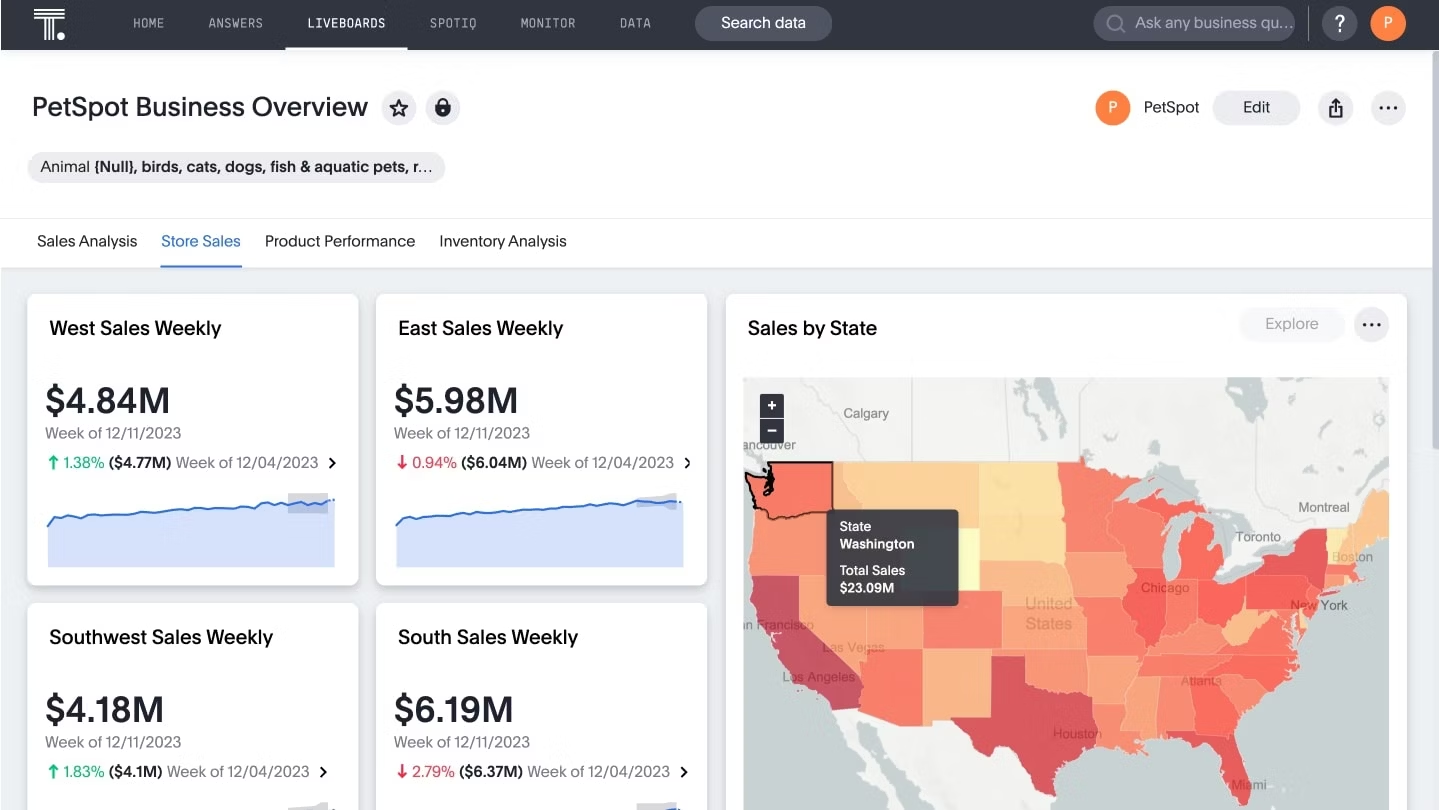
1. Online store performance dashboard
An online store performance dashboard provides a visual representation of various sales and finance KPIs, such as sales growth percentage, total revenue, quantity sold, average order size, and return on investment (ROI). The dashboard draws data from a variety of sources, such as websites, customer relationship management (CRM) systems, and mobile apps to help you evaluate the effectiveness of your core business functions and aid in strategic decision-making.
2. E-commerce KPI dashboard
KPI dashboards are typically designed for product managers and business leaders who want to track KPIs related to a specific function or an important project. Leveraging e-commerce KPI dashboards helps you develop a brief understanding of the drivers that influence performance. For instance, with ThoughtSpot’s AI-Powered Analytics, you can perform a one-click analysis to uncover driving factors and anomalies behind key metrics and visualizations. Such insights can help you pinpoint functional areas that need further attention and implement measures to improve project performance.
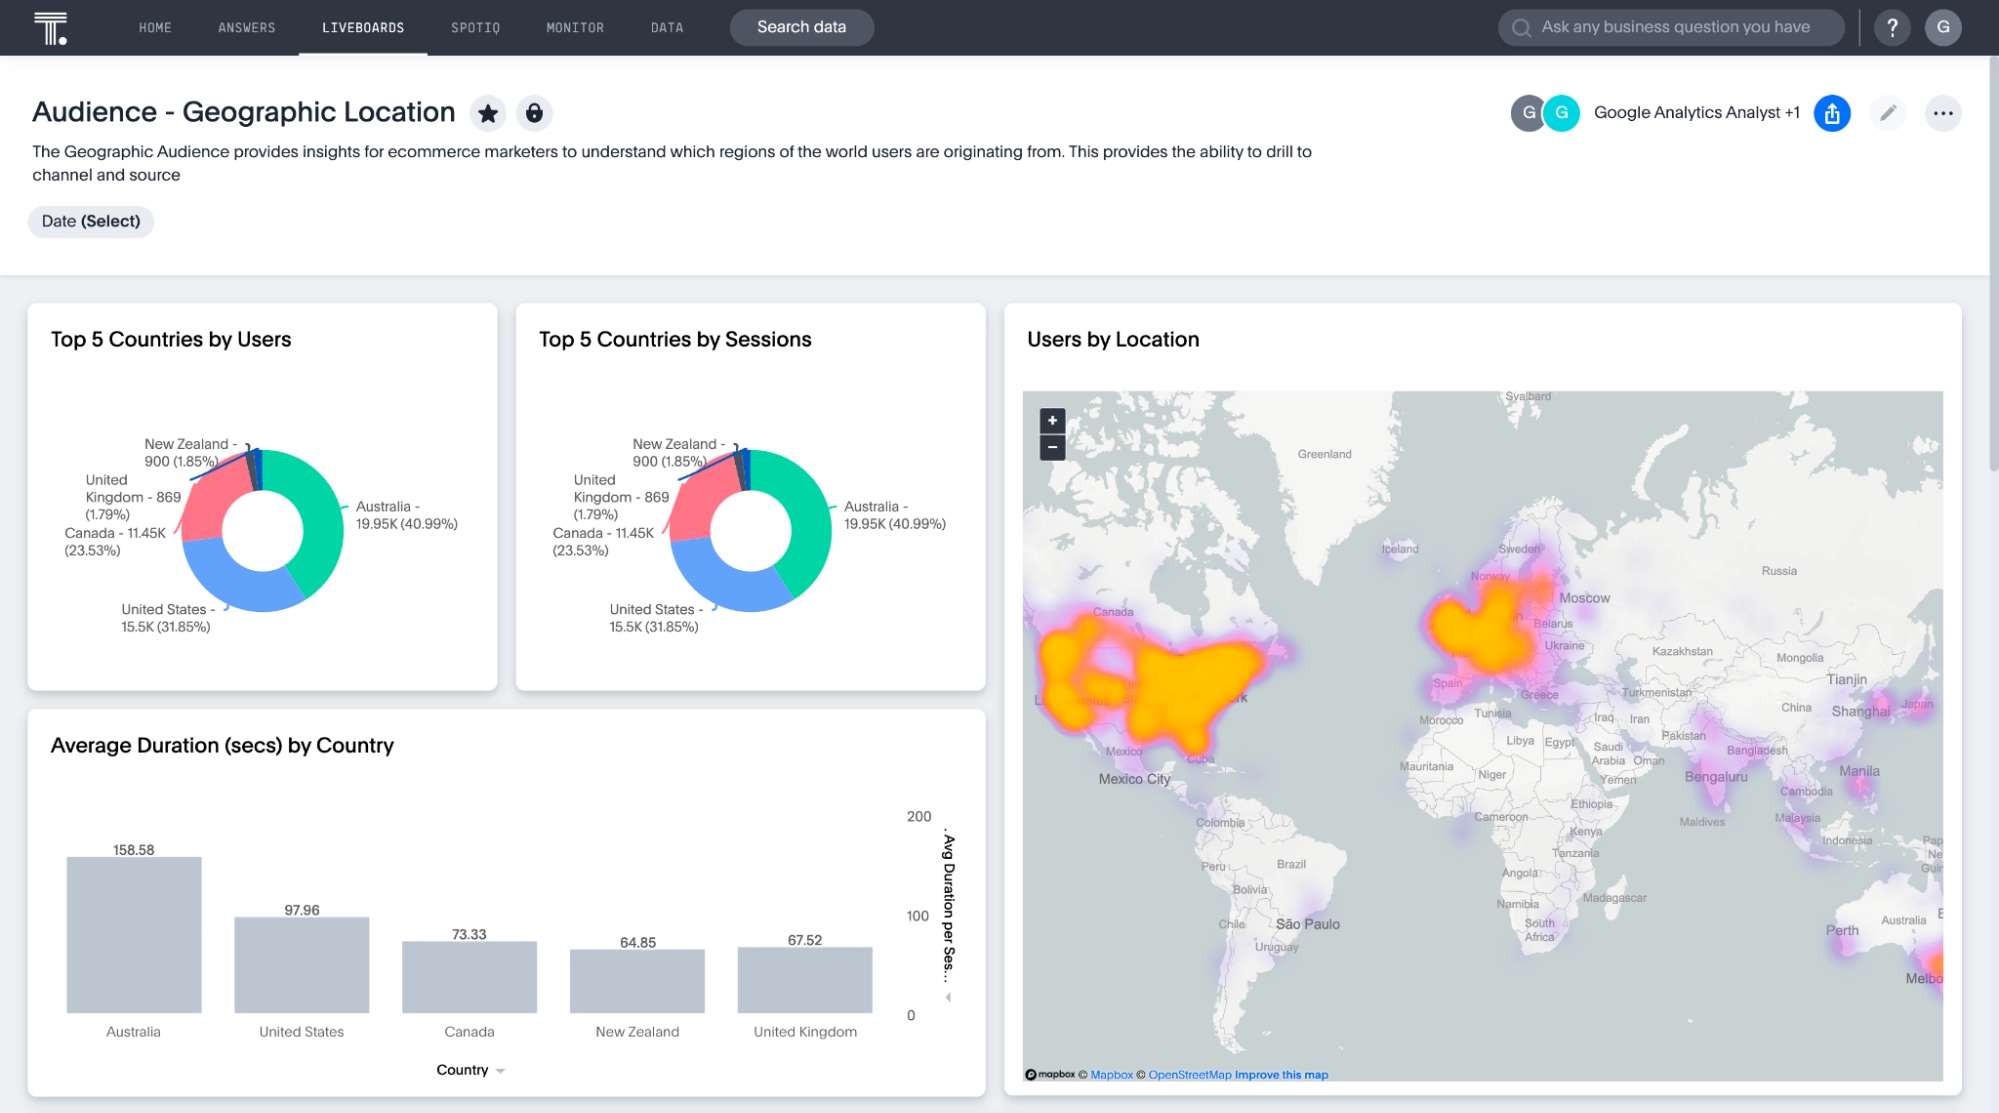
3. Web analytics dashboard
This type of e-commerce dashboard offers a comprehensive overview of your website performance. It includes metrics such as load time, server response time, overall traffic, bounce rates, and page session. Tracking these metrics helps you understand the user’s digital journey and take improvement measures such as bridging content gaps and creating marketing assets that drive traffic and conversions.
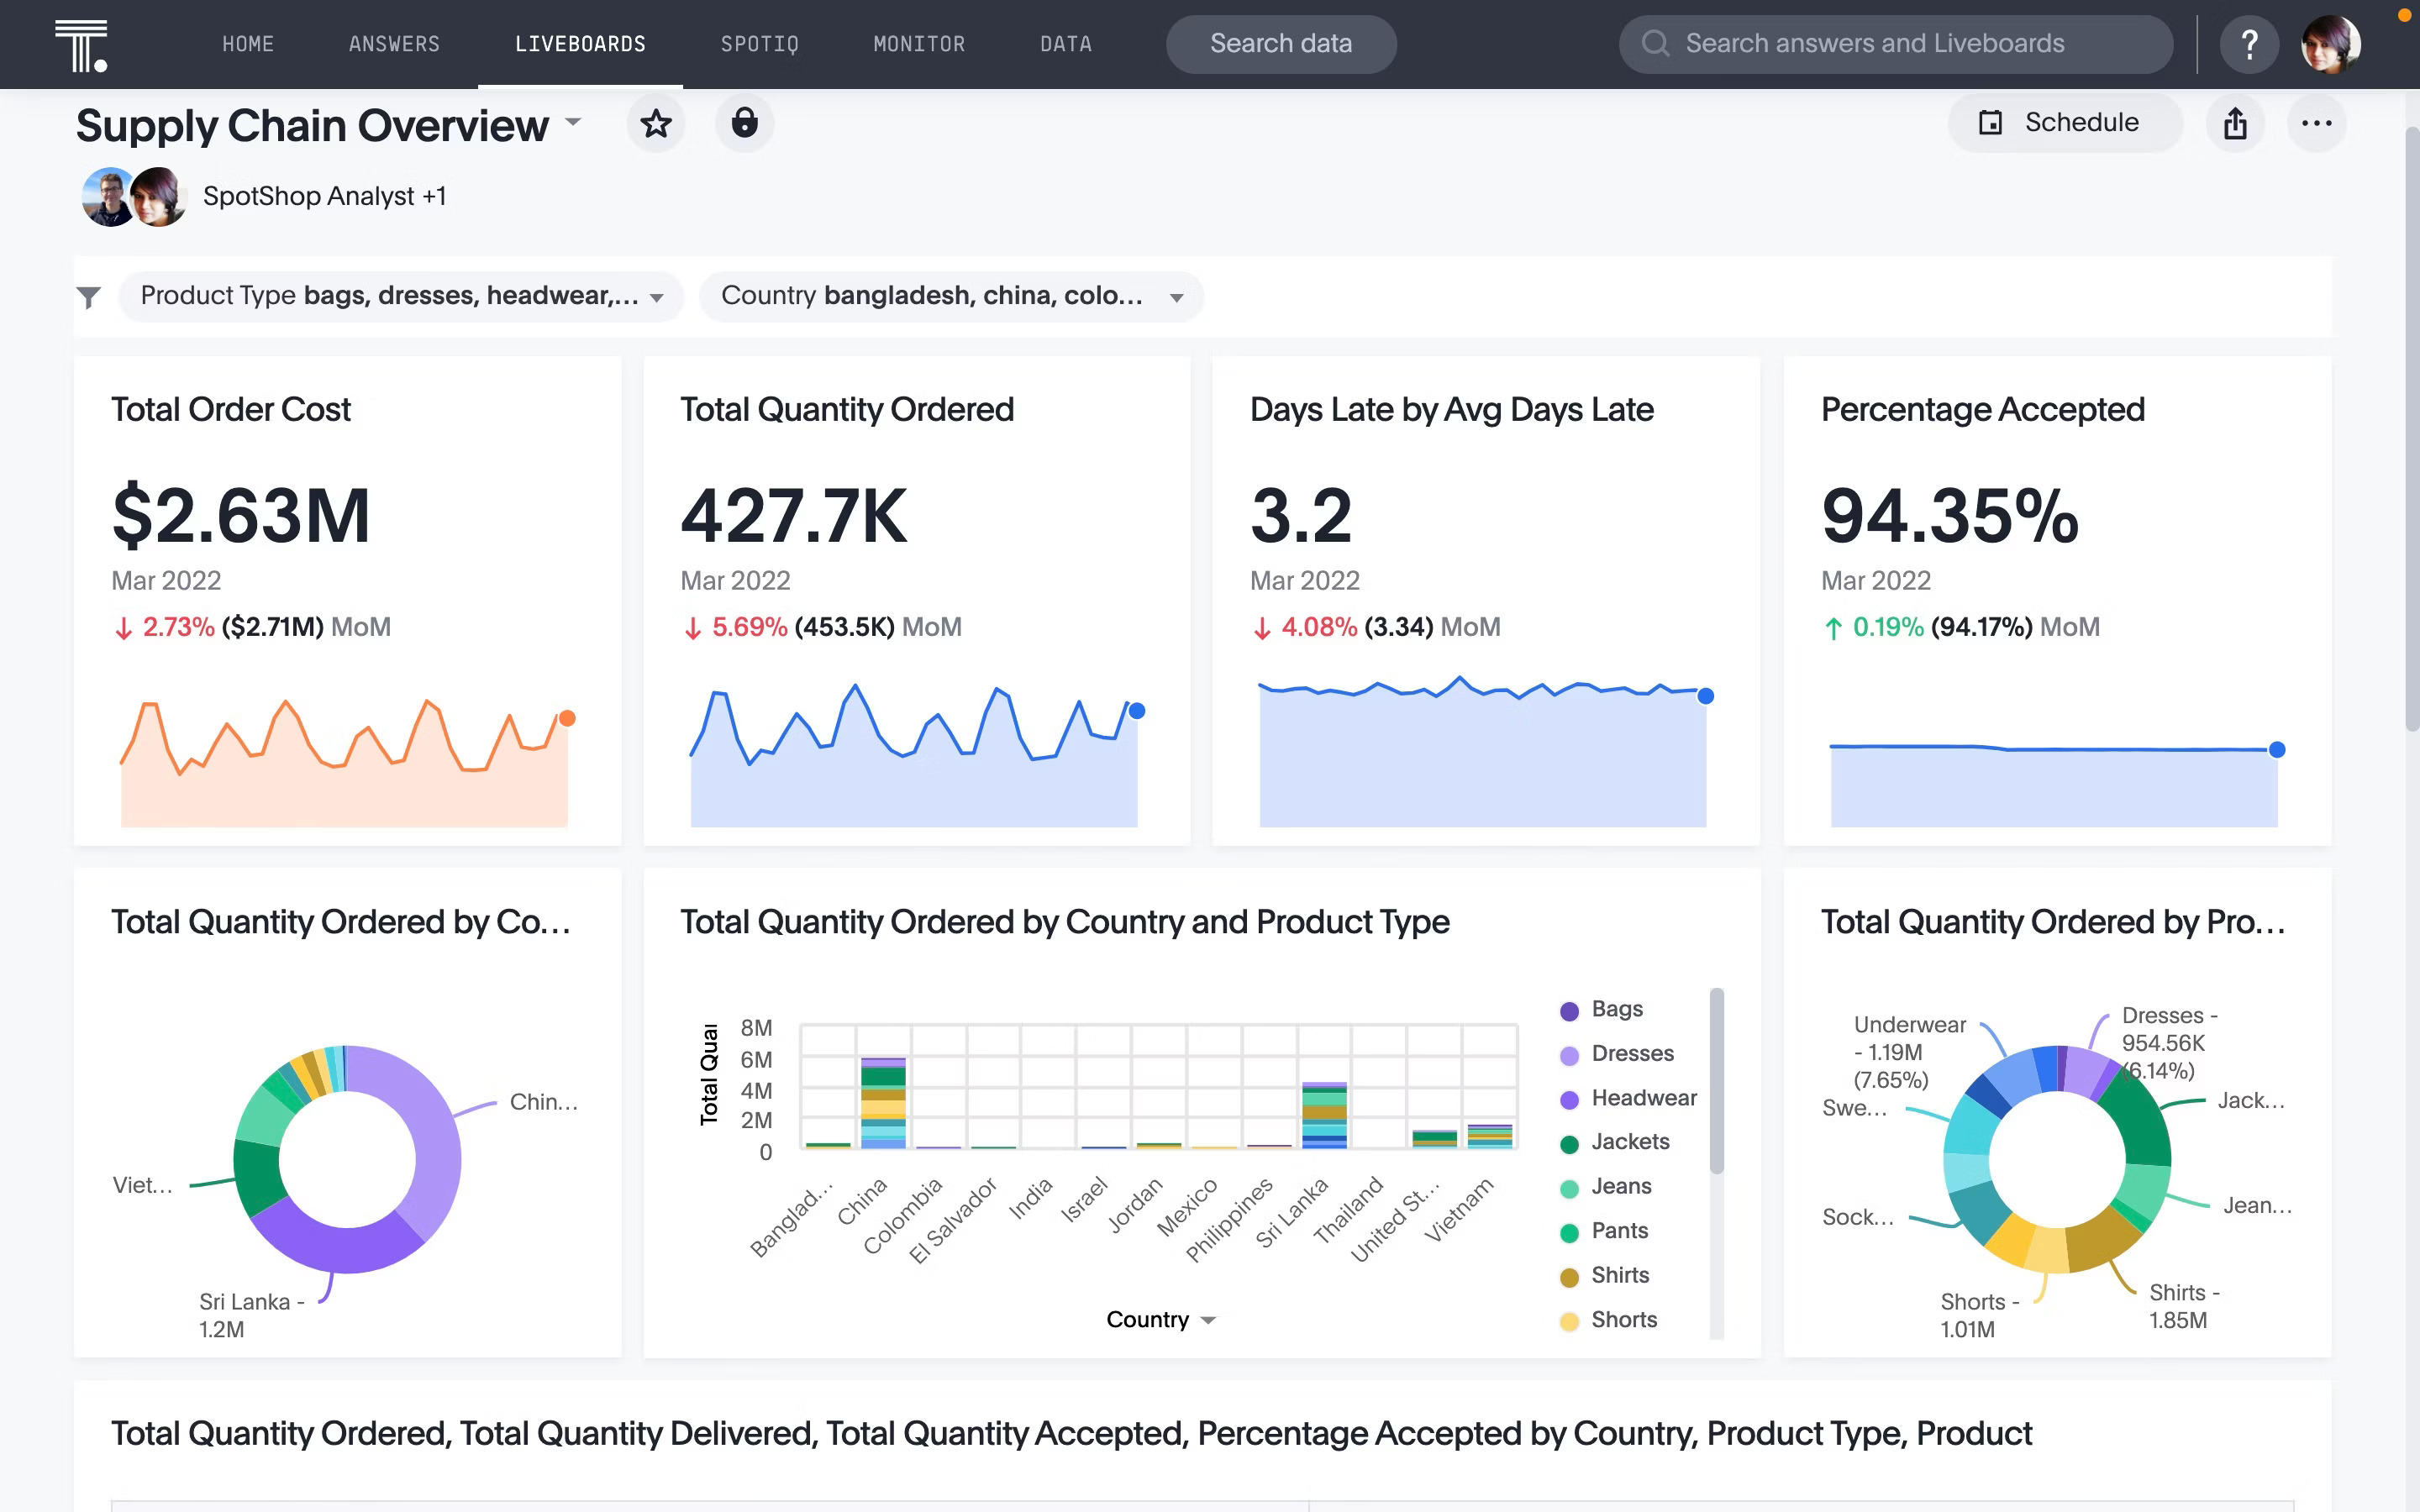
4. Supply chain dashboard
Effective supply chain management is crucial for online businesses to maintain competitiveness and boost customer satisfaction. A supply chain dashboard is designed to track and analyze KPIs that help online retailers measure the effectiveness of their supply chain operations. It serves as a guiding light to help reduce lead times, evaluate supplier performance, and ensure a seamless flow of products from suppliers to customers.
You might have a great online store, but that’s not enough to attract and retain customers. Consumers are more sophisticated than ever. They have a greater understanding of what they want and expect a smooth online shopping experience. A well-designed e-commerce dashboard will help you better understand your customers while streamlining your operations. However, legacy dashboard software, with its clunky interfaces and stale insights, often isn’t up to the task.
ThoughtSpot empowers you to analyze, explore, and share insights however you want to drive actual business outcomes. Our GenAI-powered search experience allows anyone on your team to search for insights the way they would ask questions to their favorite search engine.
See why top-tier companies such as CVS, PetSmart, and Staples trust ThoughtSpot as their go-to choice for driving sales. Schedule a demo today.


