


According to Gartner, organizations that offer personal, professional, and strategic stability to their workforce observe a 59% rise in employee engagement.
To unlock the true potential of your workforce and enhance job satisfaction, HR leaders require real-time insights into employee performance—something static dashboards and legacy platforms cannot offer. Interactive dashboards move beyond basic reporting and offer actionable insights.
Finding insights is just the first step. With this guide, you’ll see real-world HR dashboard examples to create contextual data stories for effective communication and employee empowerment.
Table of contents:
An HR dashboard is a data visualization tool that allows HR leaders and business users to track, visualize, and analyze HR metrics and KPIs. By combining data from multiple sources with your business intelligence solution, you can explore hidden insights, create data stories, and build KPI reports that optimize workforce management.
The success of any HR strategy does not solely depend on employee engagement. You should also consider how you drive innovation, business value, and operational excellence. HR dashboard reporting empowers you to track the progress and impact of each of these initiatives. Here’s how:
1. Find actionable insights
With HR dashboards, you get up-to-date information about what’s affecting employee performance so you can create immediate action plans. From bridging the skills gap to reducing attrition, the increased visibility helps you make informed decisions about improving different HR functions and meeting diverse staffing and resourcing needs.
Let’s take a look at ADP for instance. In an episode of The Data Chief, former CDO of ADP, Jack Berkowitz, shared how the company is using analytics to bridge the pay gap and become a more data-driven business.
In the episode, Jack shared that while analyzing national payroll data around military members and veterans, they found a significant pay gap. Thanks to the insights, they created SaaS application that allows businesses to analyze compensation disparities. Since the launch, they’ve noticed a significant uptake in using the tool resulting in nearly $2 Billion in equity gap closures among their customers. This shows how important it is to unearth insights from data and utilize them to create value for your business.
2. Create contextual data stories
With an AI-Powered Analytics platform like ThoughtSpot, you can transform raw data into contextual data stories to convey complex information in a graphical format for better understanding. By weaving insights from your HR dashboards into your narratives, you can create a data story that captures the viewers' attention and informs them about workforce trends, talent management programs, or policy changes.
Hear it from Alana Roesler, End-to-End Data Flow Architect at Schneider on how she uses ThoughtSpot to uncover real-time insights from data and drive digital transformation in HR:
3. Align HR strategies with business outcomes
Gartner research shows that only 32% of HR leaders state that their HR strategic planning process is fully integrated with the business planning process. Organizations should go beyond traditional review processes and adopt a data-driven approach. By using HR analytics software, you can combine data from multiple sources, visualize it, and monitor KPIs, you can find trends, patterns, and anomalies to inform better decisions for workforce planning—now and in the future.
4. Manage the workforce effectively
By tracking critical KPIs related to workforce planning, attendance, and employee engagement, HR leaders can proactively address challenges and enforce policies that lead to a conducive workplace.
An interactive BI dashboard also allows you to drill into specific data points and filter information, enabling a deeper analysis. With such advanced capabilities, you can better gauge the level of engagement, identify drivers and barriers, and implement strategies to enhance overall employee satisfaction and commitment.
5. Drive learning and development
In the age of Gen AI, prioritizing employee development has never been more important. And this starts by identifying skills gaps. With an HR dashboard, you can see the distribution of skills across the organization and identify areas where specific skills may be lacking. These insights can help you develop specific training programs that empower individuals to perform better and propel organizational growth.
More reading: Discover 5 powerful ways to use people analytics in HR
While the benefits of an HR dashboard are clear, seeing custom HR dashboard examples will help you explore its different capabilities.
1. HR executive dashboard
An HR executive dashboard provides HR executives with a comprehensive overview of key HR metrics and KPIs that directly align with the organization's strategic objectives and long-term goals. The dashboard consolidates data and presents it visually through bar charts, tables, and graphs, enabling executives to quickly identify trends, areas of concern, and opportunities for improvement within the organization's workforce.
2. Recruiting dashboard
This dashboard gives HR professionals, especially hiring managers, a clear understanding of the entire recruitment process, from new hires to cost-per-hire. You can monitor and analyze recruitment-related KPIs to optimize the company’s talent acquisition process, reduce time-to-fill, and enhance the quality of hires.
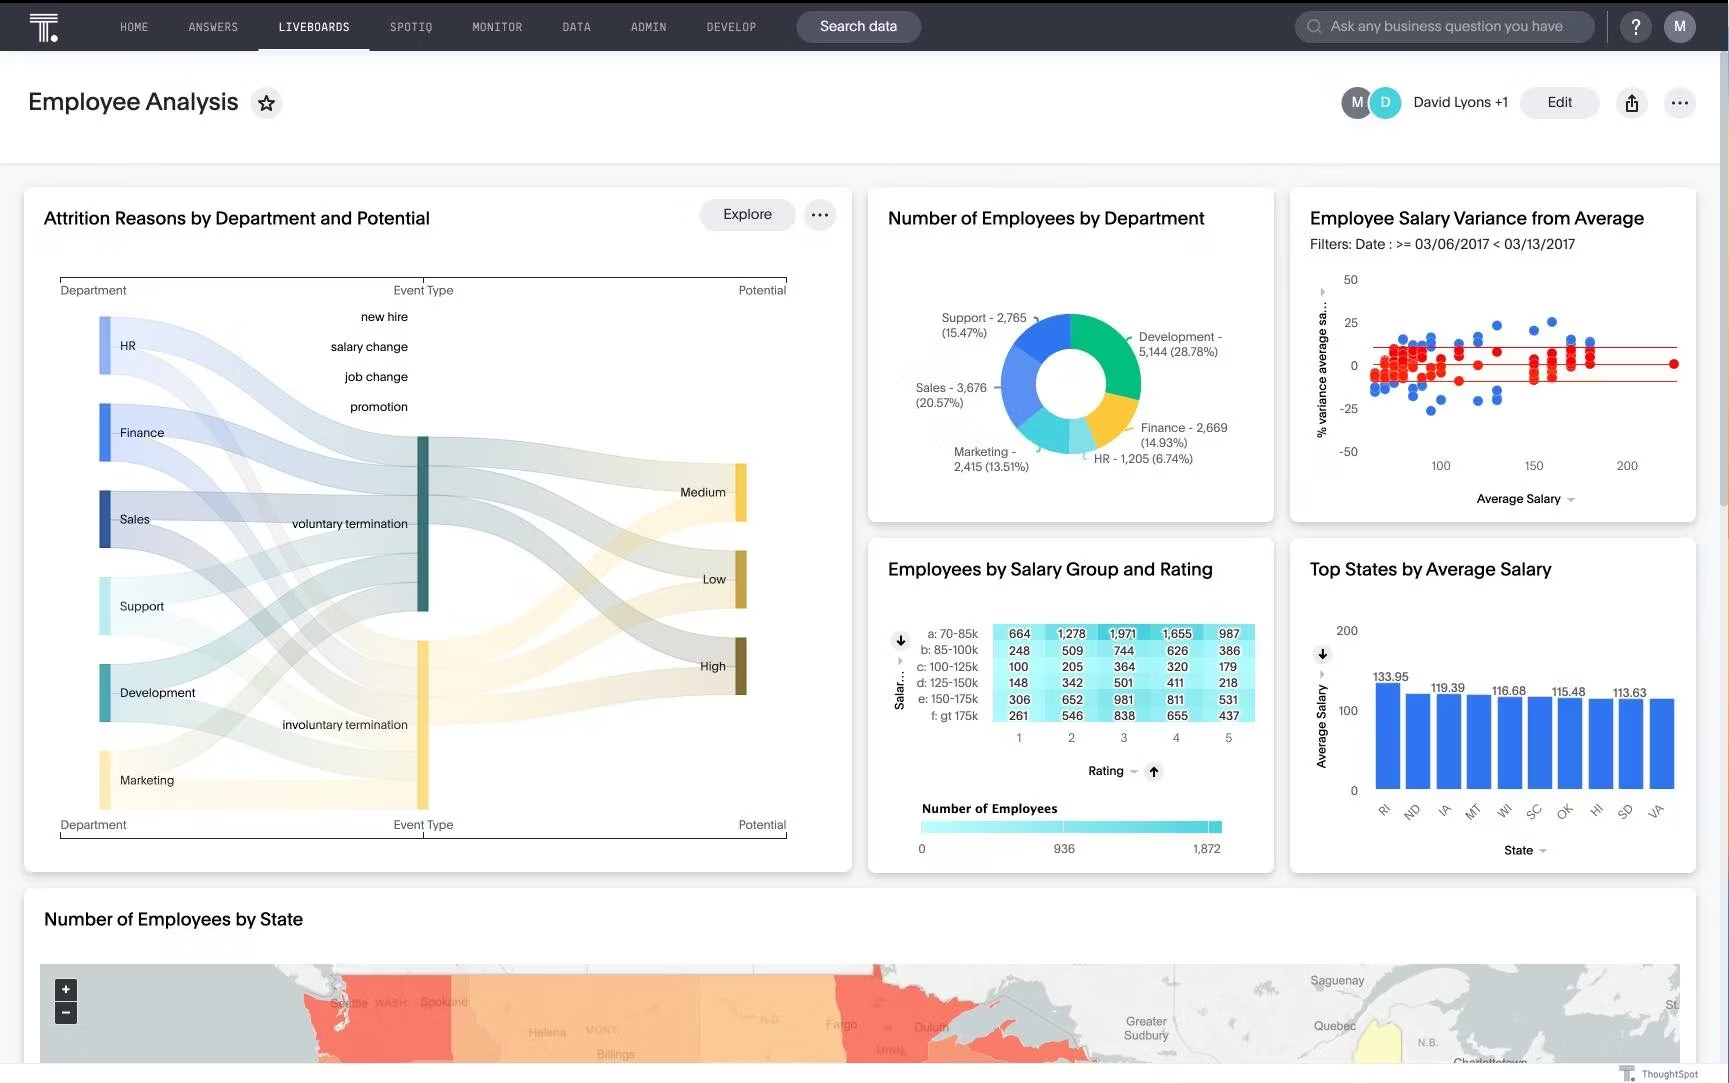
3. Employee performance dashboard
An employee performance dashboard offers a real-time view of KPIs related to individual or team performance within an organization. They empower managers and the HR team to analyze data and make data-driven decisions. Through the dashboard example below, you can understand which department has the highest attrition rate, number of employees by state, and salary gaps.
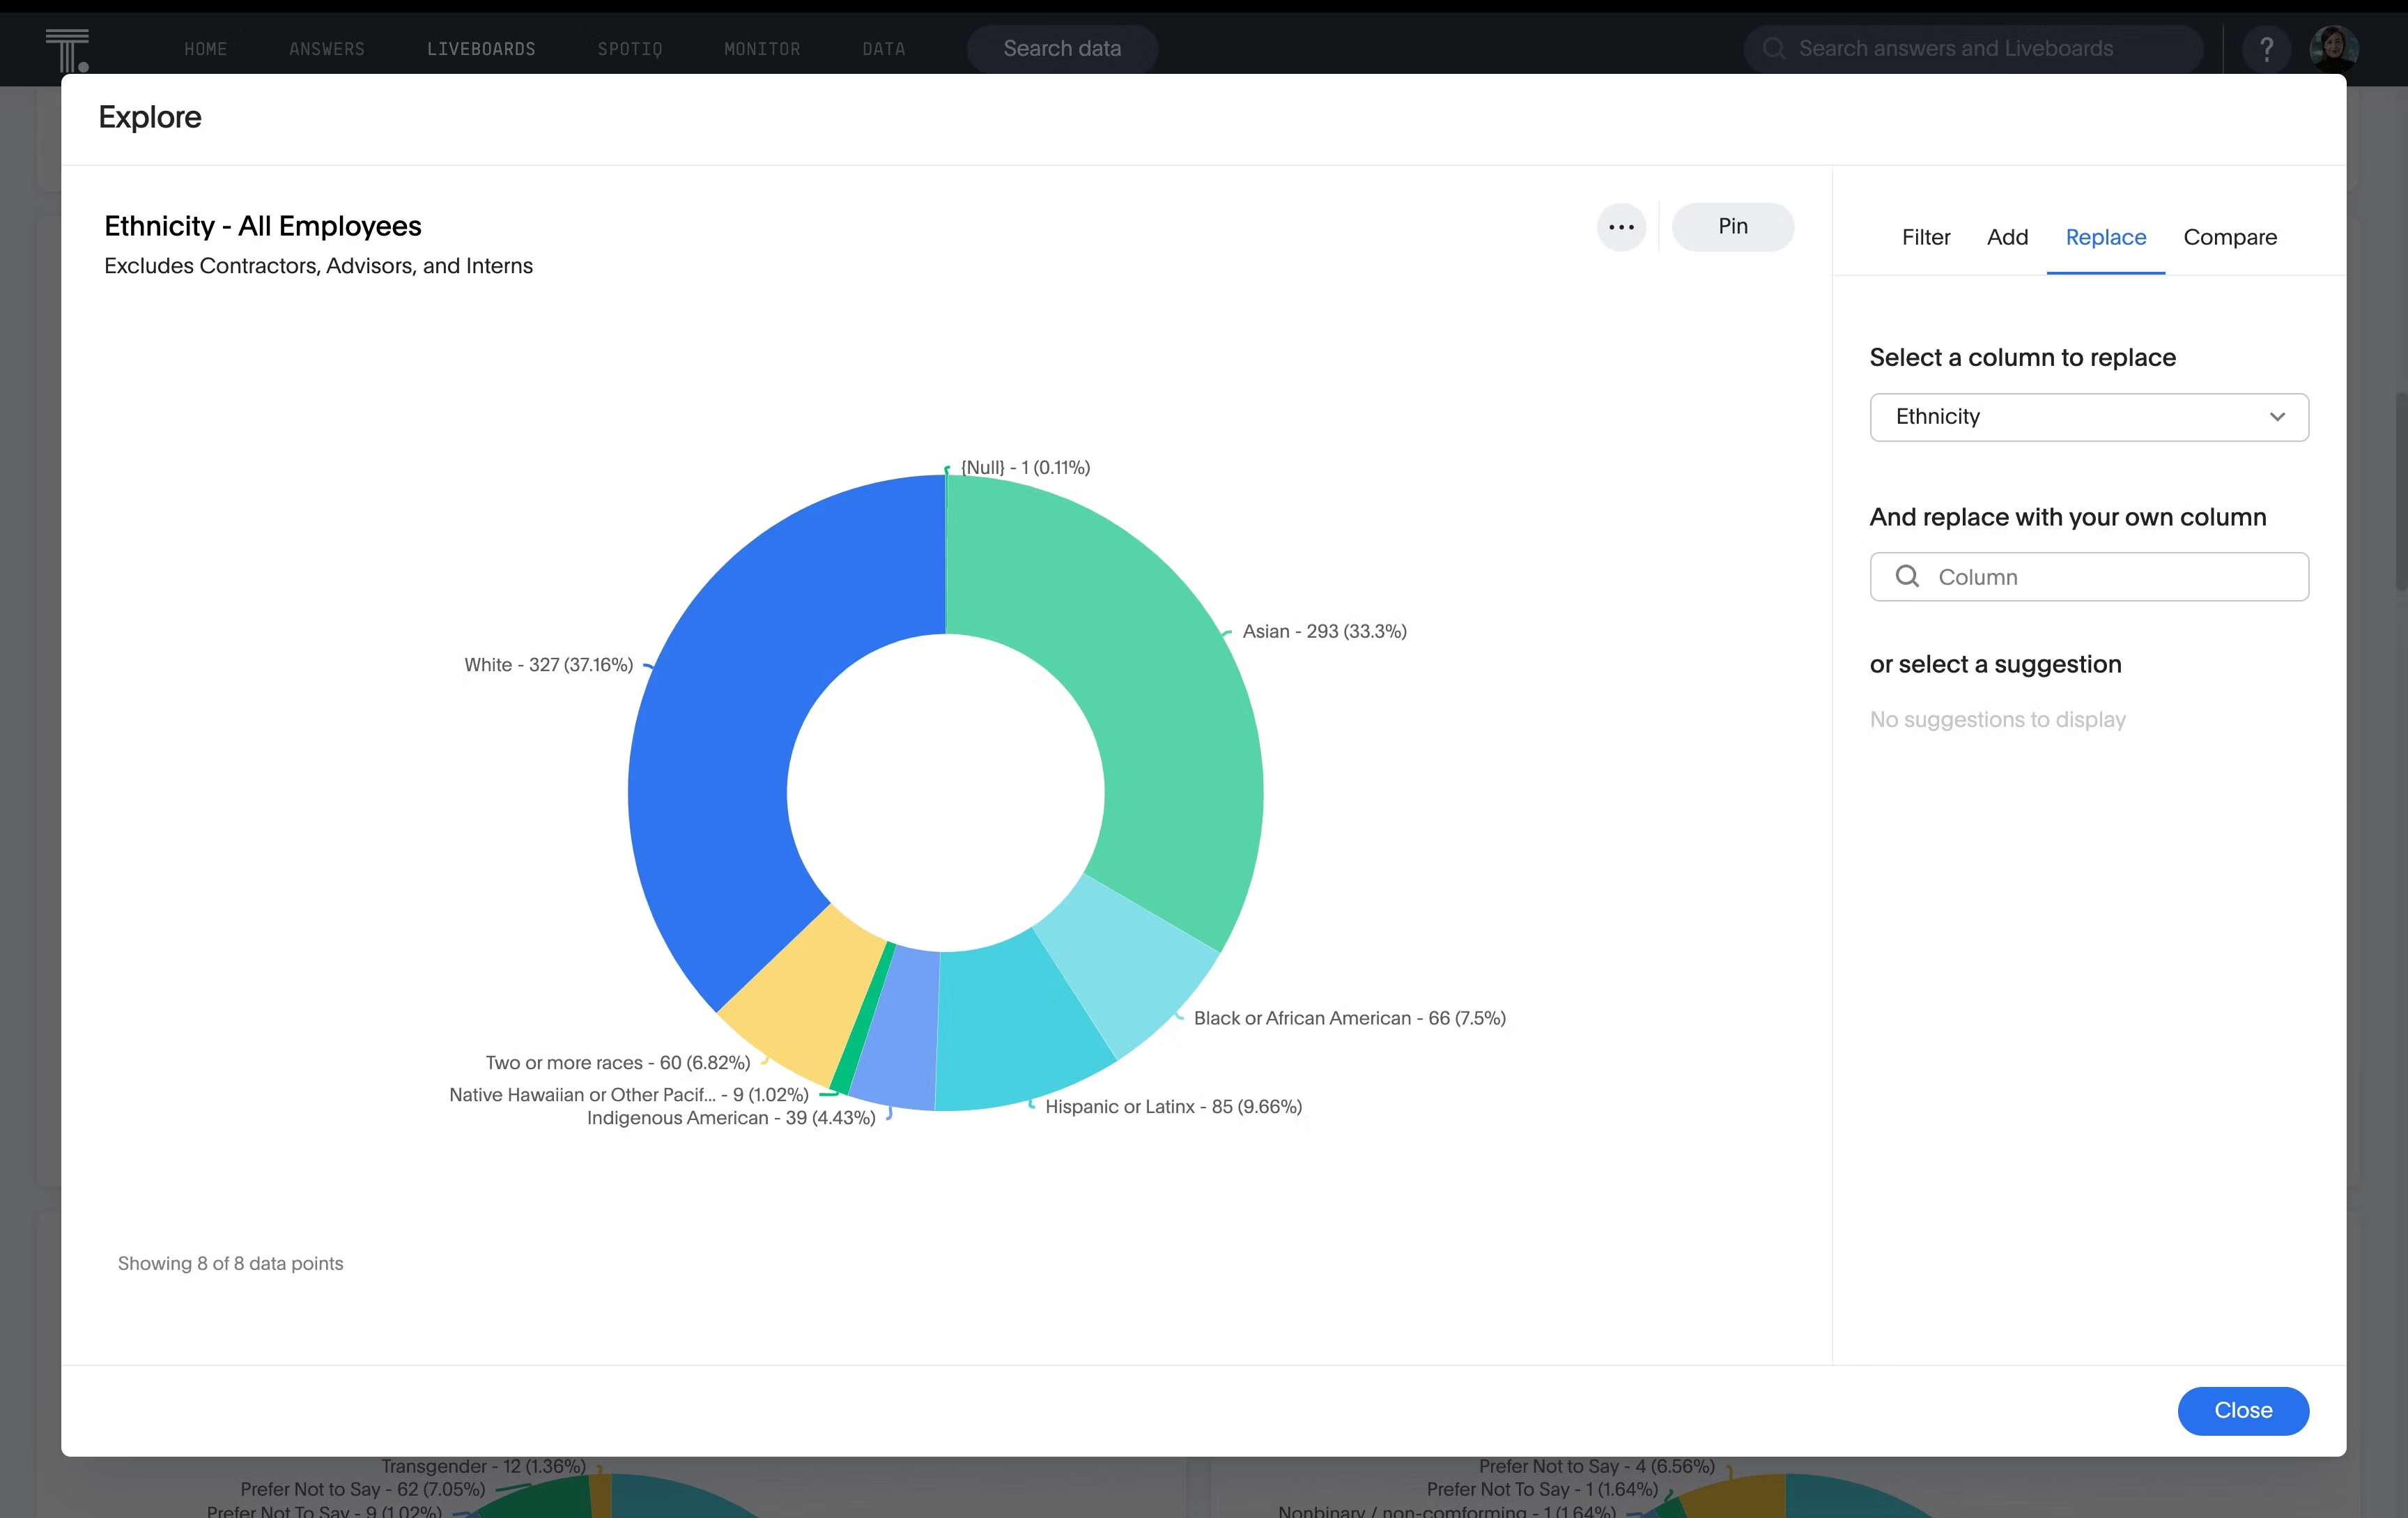
4. Workforce demographics dashboard
This HR dashboard example showcases key data related to employee characteristics, helping HR professionals, executives, and other relevant stakeholders understand the demographic composition of their workforce. Insights from the dashboard can help you improve business functions, such as talent acquisition, workforce management, and diversity.
5. Employee development dashboard
Employee development dashboards with interactive visualizations allow your HR team to gain actionable insights into employee training and development initiatives. It focuses on tracking and analyzing all initiatives aimed at boosting employees' skills, capabilities, and overall growth.
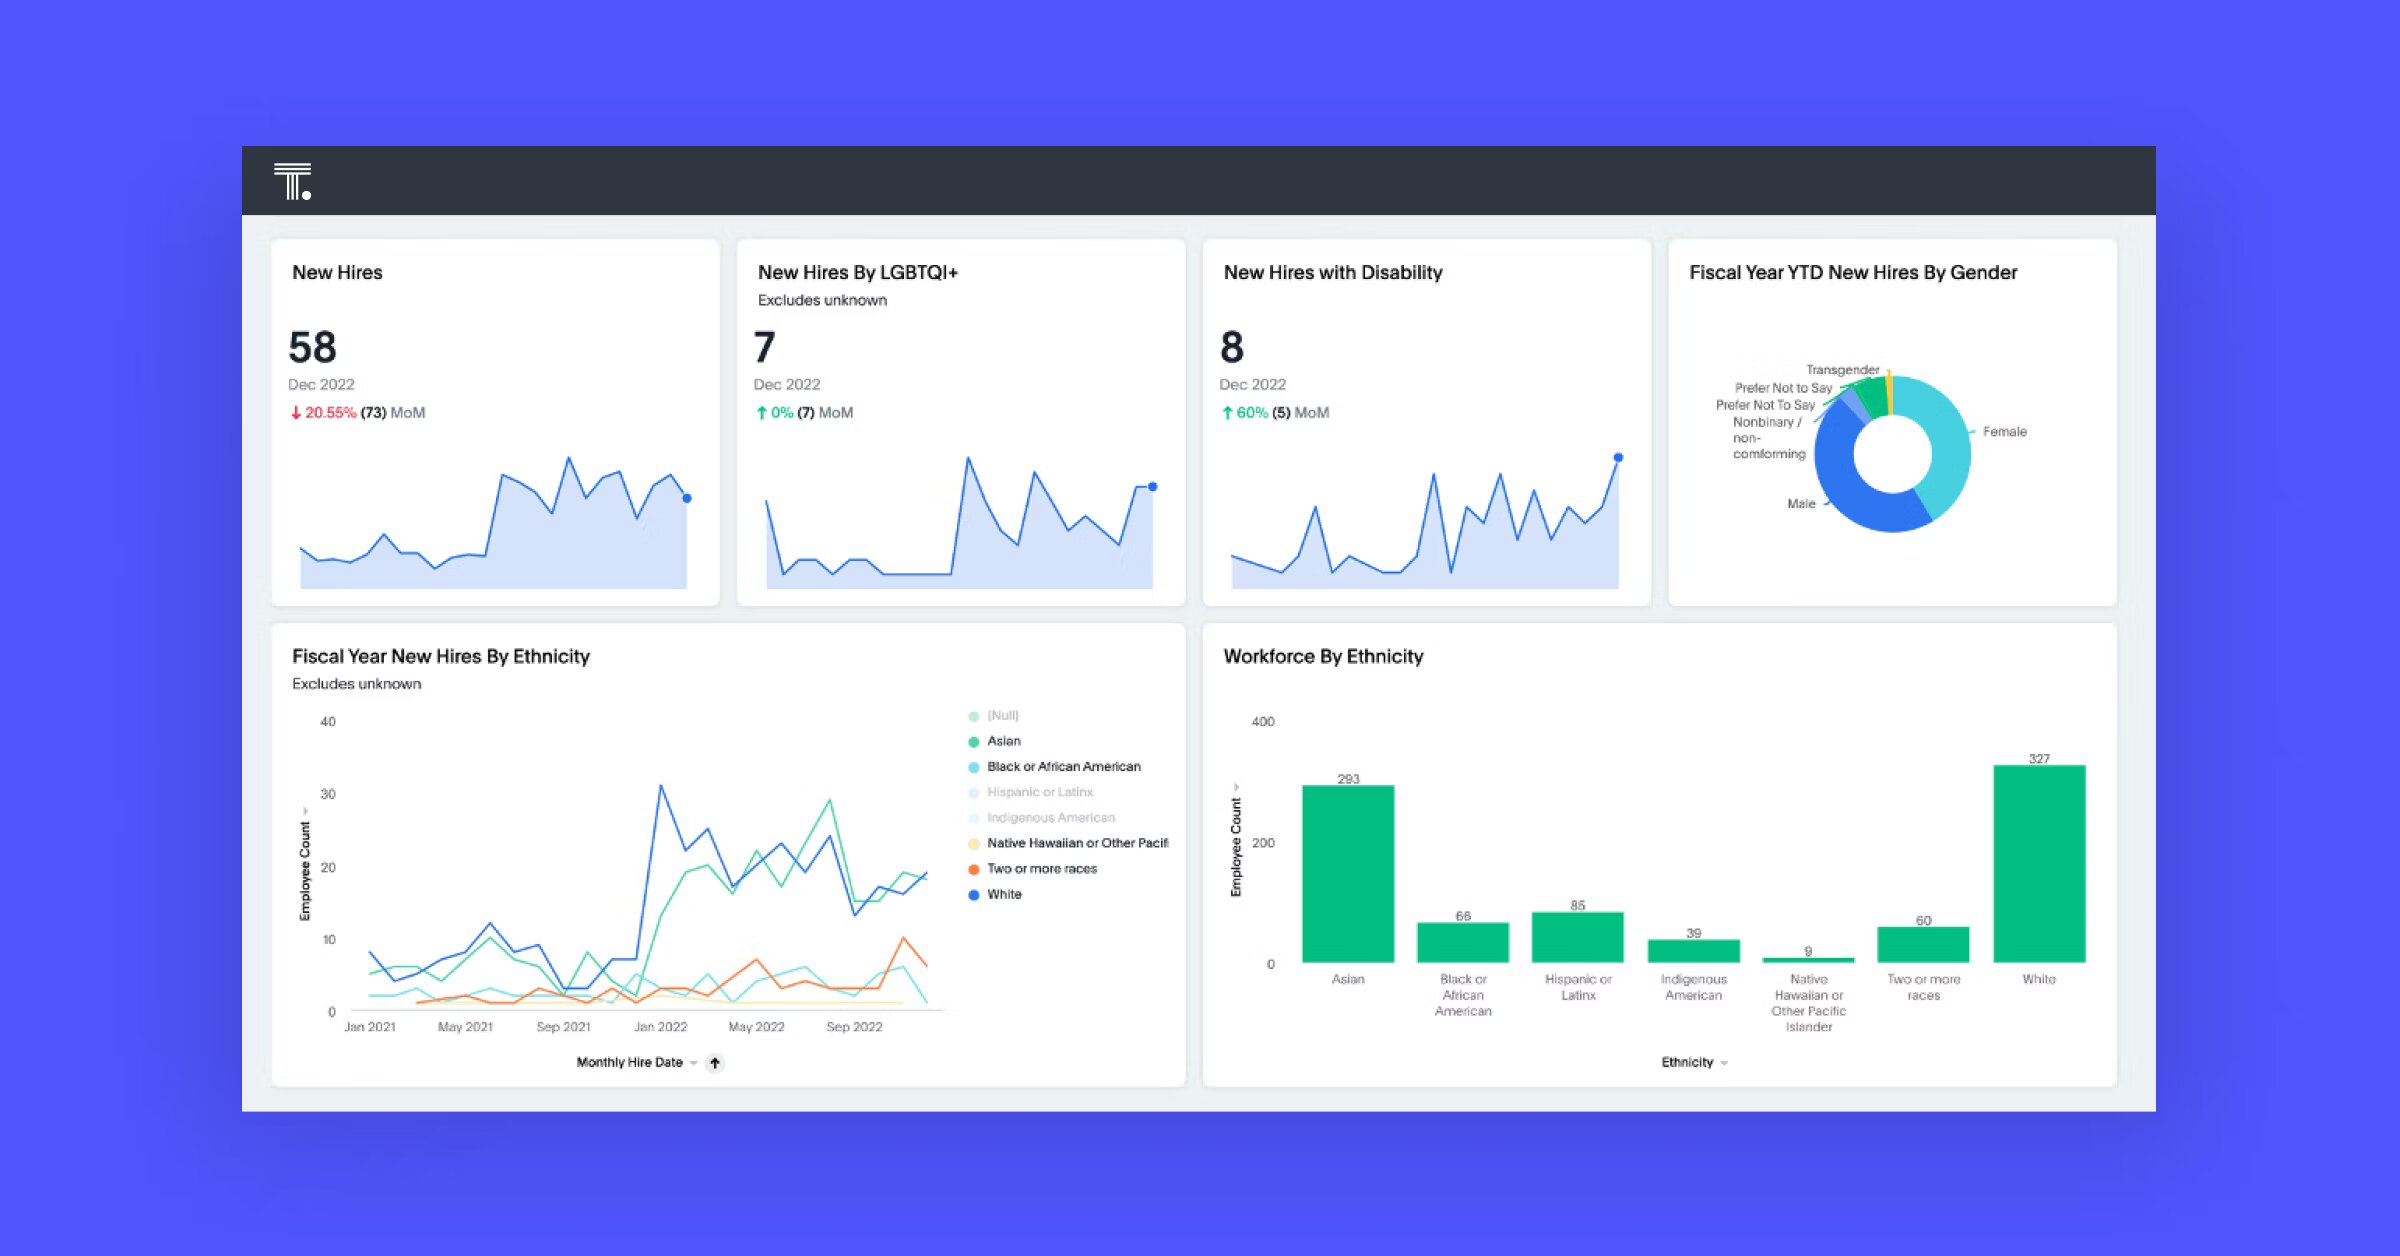
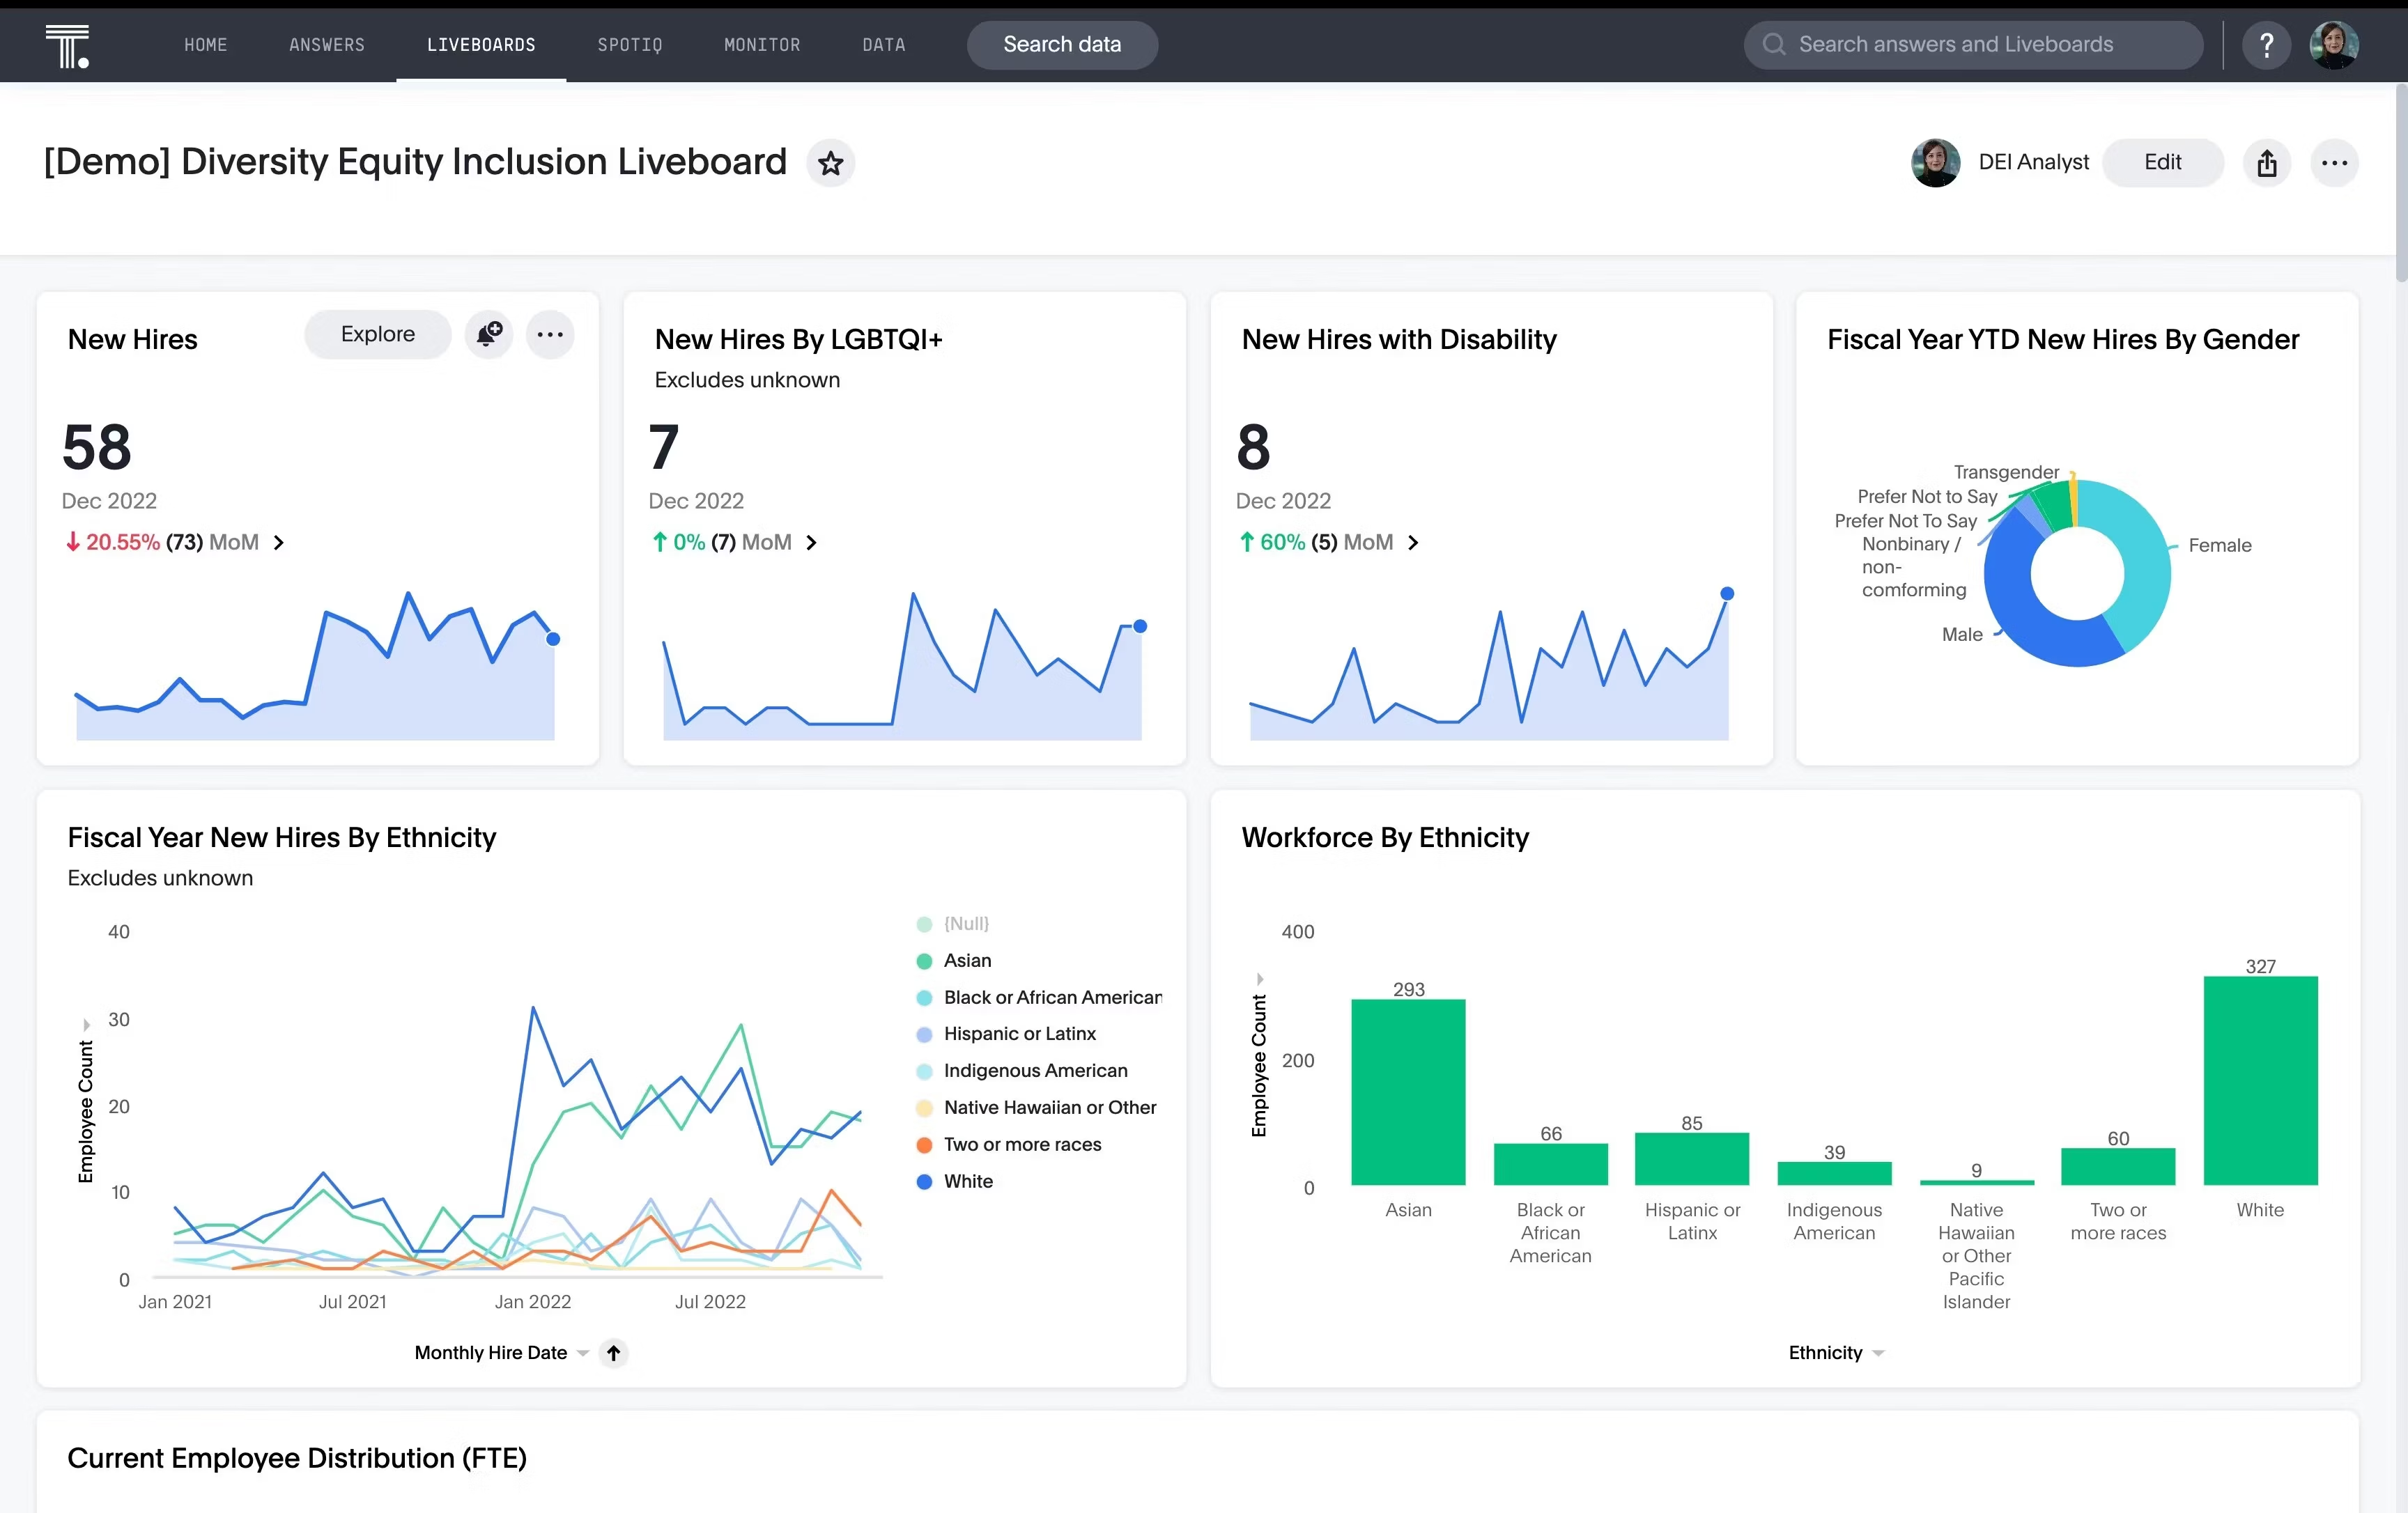
6. Workforce diversity dashboard
A workforce diversity dashboard enables organizations to monitor their diversity and inclusion efforts, understand the success of their DEI strategy, and track campaign progress over time. It is a powerful tool for HR leaders to foster transparency and accountability to create an inclusive environment for their workforce.
Designing dashboards is more than just making everything look aesthetic. It requires a deep understanding of your audience, business goals, and how you want to communicate your findings. To ensure that you create engaging data stories, here are five best practices that will help you design best-in-class dashboards:
1. Identify your audience and define clear objectives
The key to creating engaging dashboards is knowing who the dashboard is intended for and understanding the insights you want to gain. For instance, executive leaders want to track KPIs related to strategic HR activities. That’s why you should design an HR executive dashboard with relevant KPIs to help stakeholders gain real-time updates and gather their key takeaways.
2. Choose the right visualization tool
With the right data visualization tool, you can do more than just look at static charts. It allows you to seamlessly share insights, leverage drill-downs to find hidden insights and utilize AI-augmented analytics to spot anomalies. Select a visualization tool with real-time data monitoring capabilities, interactive filters, AI-Powered Analytics, and customization features. This will enhance your data exploration and data storytelling capabilities.
3. Keep the layout simple and interactive
Adding too many design elements can make your visualizations distracting and hard to digest. Since we, as humans, have limited attention spans, you should keep your dashboard layout clutter-free and opt for simplicity. Also, it is essential to keep the color palette minimalistic and use clear labels and descriptions to make insights easily accessible.
4. Select relevant metrics
Select the most relevant KPIs and metrics that align with your business outcomes. Consider the metrics that provide actionable insights and contribute to strategic decision-making. Common HR KPIs include employee turnover rates, time-to-fill for open positions, training effectiveness, and diversity metrics.
5. Test and iterate
Test the functionality and usability of your HR dashboard before deploying it to end-users. Take relevant feedback from HR professionals, managers, and other stakeholders to identify areas for improvement. Iterate the design based on user feedback to enhance its effectiveness.
At the end of the day, the success of your organization depends on your people. Building live dashboards with an AI-powered business analytics platform like ThoughtSpot leads to increased visibility and real-time decision-making. Our modern, sleek Liveboards enable your team to find granular, actionable insights within minutes—not days or weeks.
See for yourself how ThoughtSpot’s AI-Powered Liveboards can fulfill your data needs with a free demo.


