Marketing means nothing if you can’t prove the value of your efforts—the real-time impact each strategy in play is having on your business. In today’s modern business world, the measure is just as important as the message. Every marketing leader needs a solid grasp of what’s happening across all team functions, and that’s where the marketing dashboard comes into play.
I know what you’re thinking: Aren’t you the one who said dashboards are dead?
And you’d be right. Dashboards are dead, static, out-of-sync time capsules collecting dust and draining resources. That’s why we prefer Liveboards, but more on that later. For now, let’s take a closer look at what’s traditionally referred to as the marketing dashboard to see how you can make the most of your data.
What is a marketing dashboard?
A marketing dashboard is a visual representation of key performance indicators (KPIs) and relevant data about or connected to your company’s marketing efforts.
If you’re in the marketing world, you’re likely already using a number of workplace apps that feature embedded analytics and dashboards. Consider your customer relationship management software (CRM), website analytics tool, social media or search engine advertising platform, etc.—they all have built-in dashboards that tell you relevant information to your ongoing campaigns. A marketing dashboard, however, usually collects various pieces of marketing information in a business intelligence platform to give users a single, cohesive view.
Why are marketing dashboards important?
These marketing dashboards are important because they give you a holistic view of your past and ongoing campaigns. According to Google, leading marketers are 72% more likely to invest in quality and/or volume improvements of the first-party data they capture. That’s because this information empowers you to make decisions about which strategies are most effective. But when your data stays siloed in these applications, it limits the breadth of insights you are able to obtain and apply across your entire organization.
Now, imagine if you were able to connect your Google Analytics, LinkedIn ads, and Salesforce metrics to understand how each prospect interacts with your business along every step of the conversion funnel to tell a real data story about how prospects engage with your brand. You could then apply these insights to understand content gaps, invest in strategies that are the most successful, and gain a more holistic picture of your target audience.
This example shows just how valuable a marketing dashboard can be, empowering your entire marketing organization to make more data-driven decisions. But in order to achieve these results, you first need to understand how to build an effective marketing dashboard.
Key features of effective marketing dashboards
There is no shortage of data visualization tools on the market. And while the ability to visualize data is important, it’s not everything.
Key features and functionality you’ll need to look for to have effective dashboards:
1. Live data
In today’s digital world, your go-to-market strategy is being played out in real-time. If you're using old data, you could be wasting an entire day of ad spend before you realize the strategy isn't working. Or, consider a prospect downloads a bottom-of-funnel asset—your follow-up should be personalized and instantaneous. In either case, these data delays are having a direct impact on your bottom line.
Because every second counts, your team needs access to up-to-date data so they can make informed decisions in the moment. If your data lags, your team will lose trust—reverting to instinct-based decisions and leaving money on the table.
2. Customization
Think about the workplace apps you use in marketing every day. Many of those dashboards are static and standard. But your team deserves more than a one-size-fits-most approach. Your marketing strategies are unique. In order to gain real insights, you need a dashboard that can flex to fit your ever-evolving needs.
Perhaps a particular KPI is important one quarter, and the next it’s not. Or maybe you start a new campaign that you want to be front-and-center today, but it changes tomorrow. Say you need a different data visualization to effectively analyze the results, or you want to customize the look and feel to reflect the brand of your stakeholders. Flexibility isn’t just a nice-to-have, it’s a must-to-work.
3. Integration
Although those workplace apps don’t always have the best data visualization for your analytics, they still have vital data that should be a part of your marketing analysis. That’s why it’s vital that your dashboard can easily integrate with other tools.
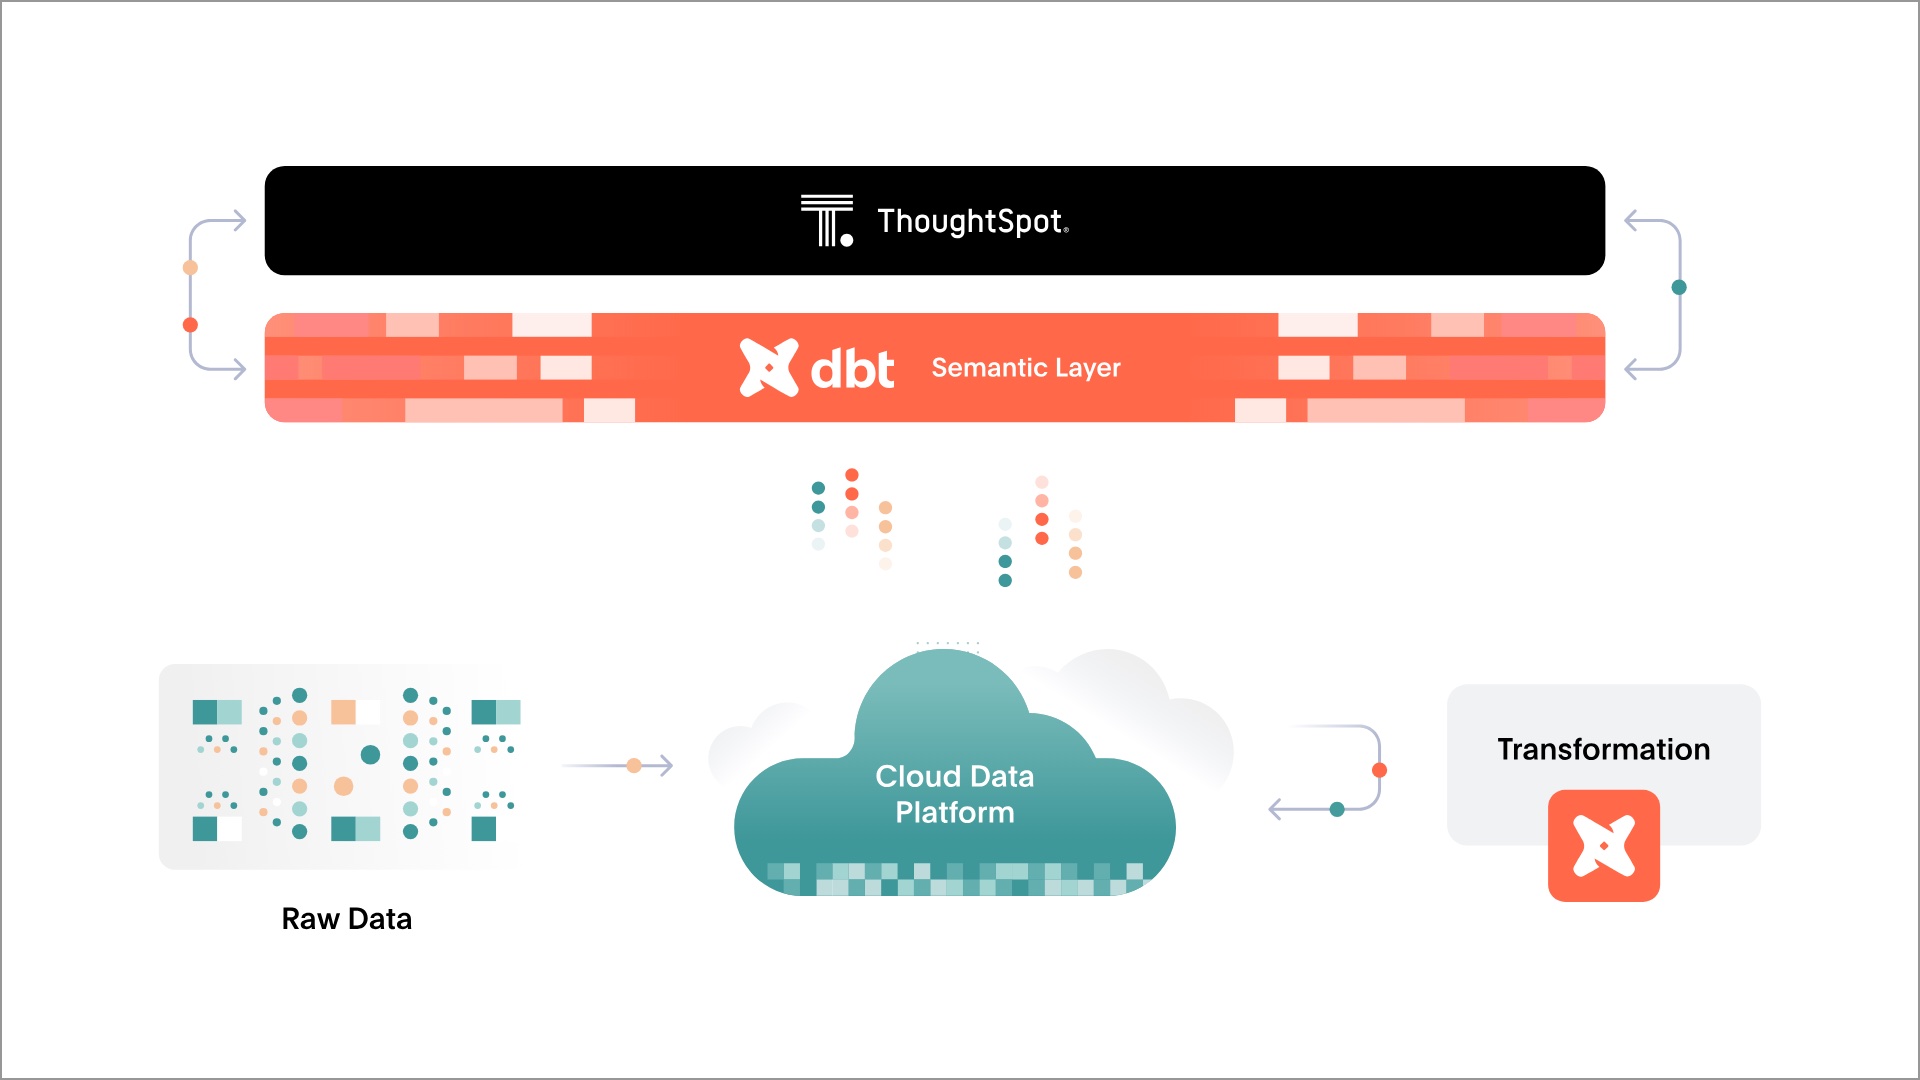
Consider your data catalog tools, like Alation and Atlan. Many companies use these tools to store valuable metadata and context that gives users confidence in their data. By seamlessly pulling data to and from ThoughtSpot and the other tools in the modern data stack, your team can have a singular view of the full data ecosystem, giving them the confidence they need to make real-time, data-driven decisions.
4. Actionable
Your BI solution should also be able to push relevant insights into your workplace tools where your team is working. Consider you’re using your dashboard to find a list of high-intent marketing contacts. Your BI solution should allow you to trigger another system, such as a HubSpot, Marketo, or Salesforce, so you can send an email that includes a coupon to purchase.
It’s not just about pushing data into your workplace tools—it’s about creating a closed data loop. Once an insight is found, it should be pushed back into the data source so that appropriate actions can be taken. By moving from data, to insight, to action, and back to the underlying data source, you avoid the pipeline or waterfall.
5. Interactive
Have you ever looked at a chart and then thought, “I wish I could see the event that triggered this spike in site traffic” or “I wonder how many leads from this event actually converted into sales?” Chances are your dashboard may be able to answer your first question, but what about your next one? We’ve all felt that frustration when you run into a dead end where the prebuilt dashboard no longer has the answer. This is why interactivity is a must-have feature for your marketing dashboard.
You need a modern, interactive data visualization that is built to help you answer the next question and the next—without having to go back to your data team and request a new dashboard. The ability to filter and drill endlessly into your data is a key feature that enables you and your team to make data-driven decisions.
6. AI-augmented
Last, but certainly not least, a modern dashboard should empower users to understand the insights, not just see a pretty picture. While I believe that every marketer should have some level of data fluency training, 31% of businesses in a Harvard Business Review survey found that employees still lack the skills to make appropriate use of technology-enabled insights.
AI helps by helping you ask the questions you didn’t know to ask, and find the insights you didn’t know existed. By empowering users to find anomalies and insights hiding in your data, you can unlock new opportunities, tap into a wealth of increased productivity, and give every person on your team the ability to take advantage of the insights that are otherwise hiding behind the dashboard.
9 marketing dashboard examples and best practices
Like we said, every marketer is different because every campaign, every company is different, too. So while there is no one size fits all, here are some of the most common marketing dashboards and how to make the most of them.
1. CMO dashboard
Similar to your digital marketing reporting dashboard, a CMO dashboard will also offer high-level insights. However, these insights should also be tied into overall business goals—not just that of the marketing team.
2. Digital marketing dashboard
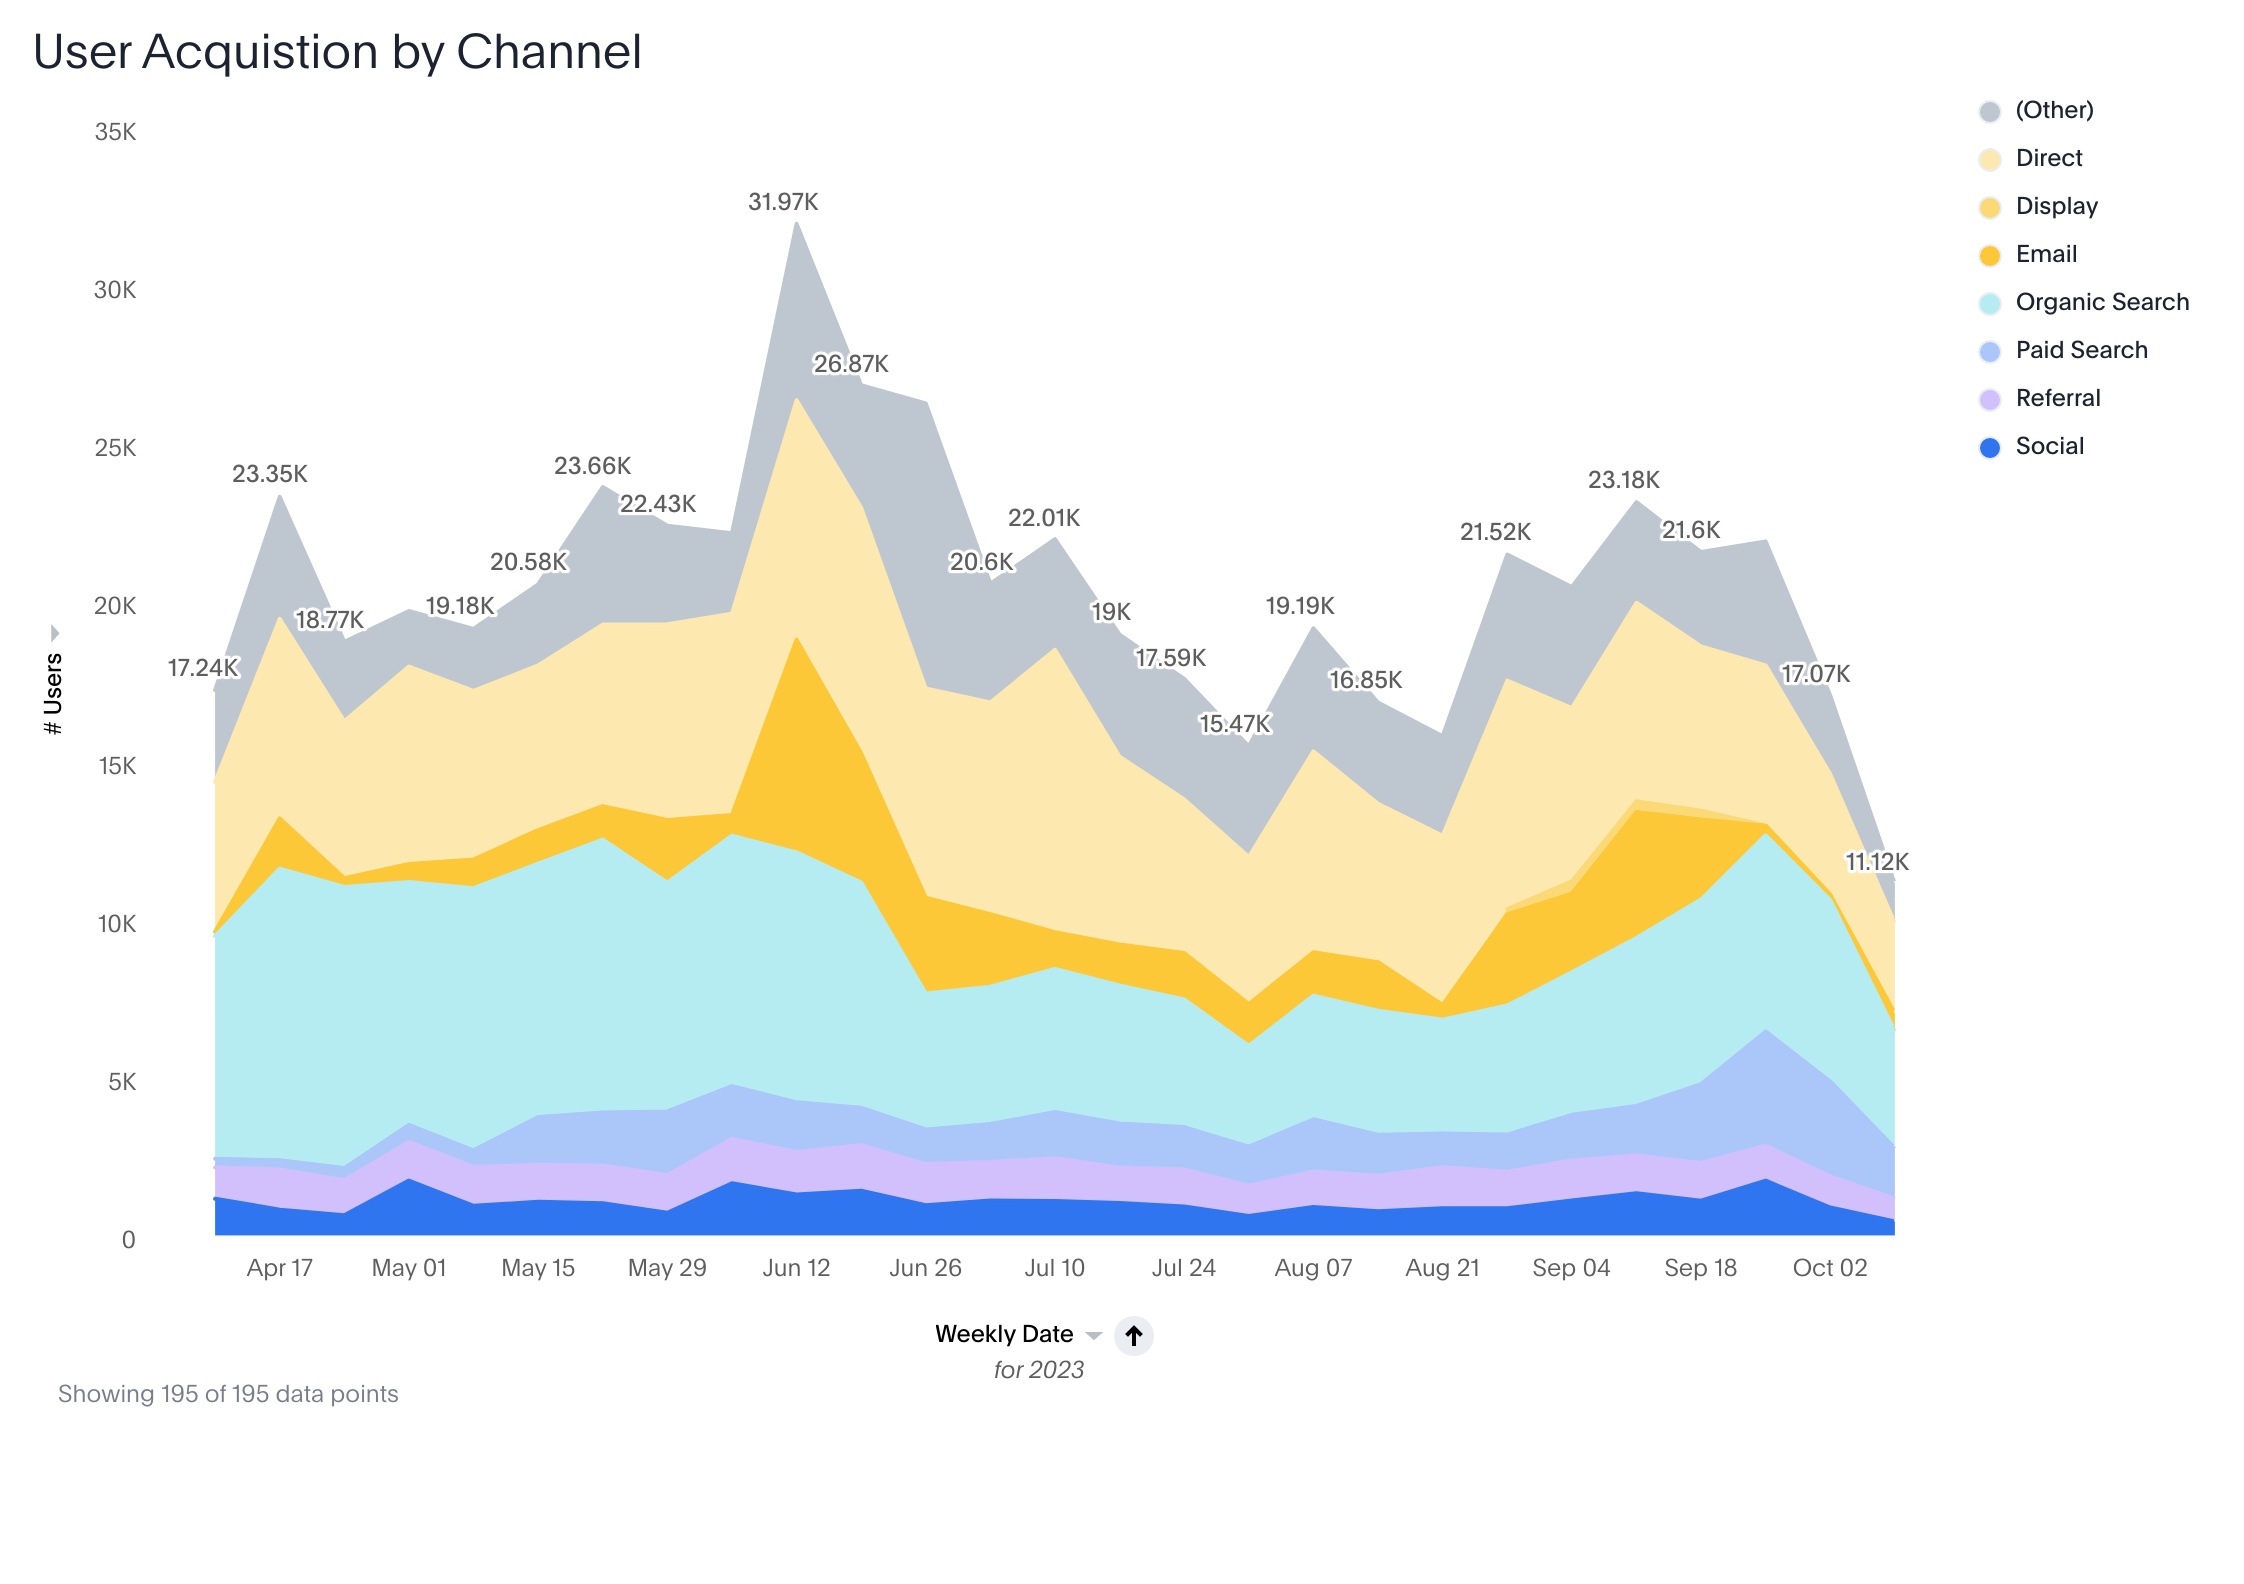
Your digital marketing dashboard should be a visual representation of all of your digital marketing efforts and KPI—think website, social media, email, advertising, etc. This high-level, at-a-glance vantage should give leaders the visibility they need while also allowing them to drill down into areas of interest.
3. Web analytics dashboard
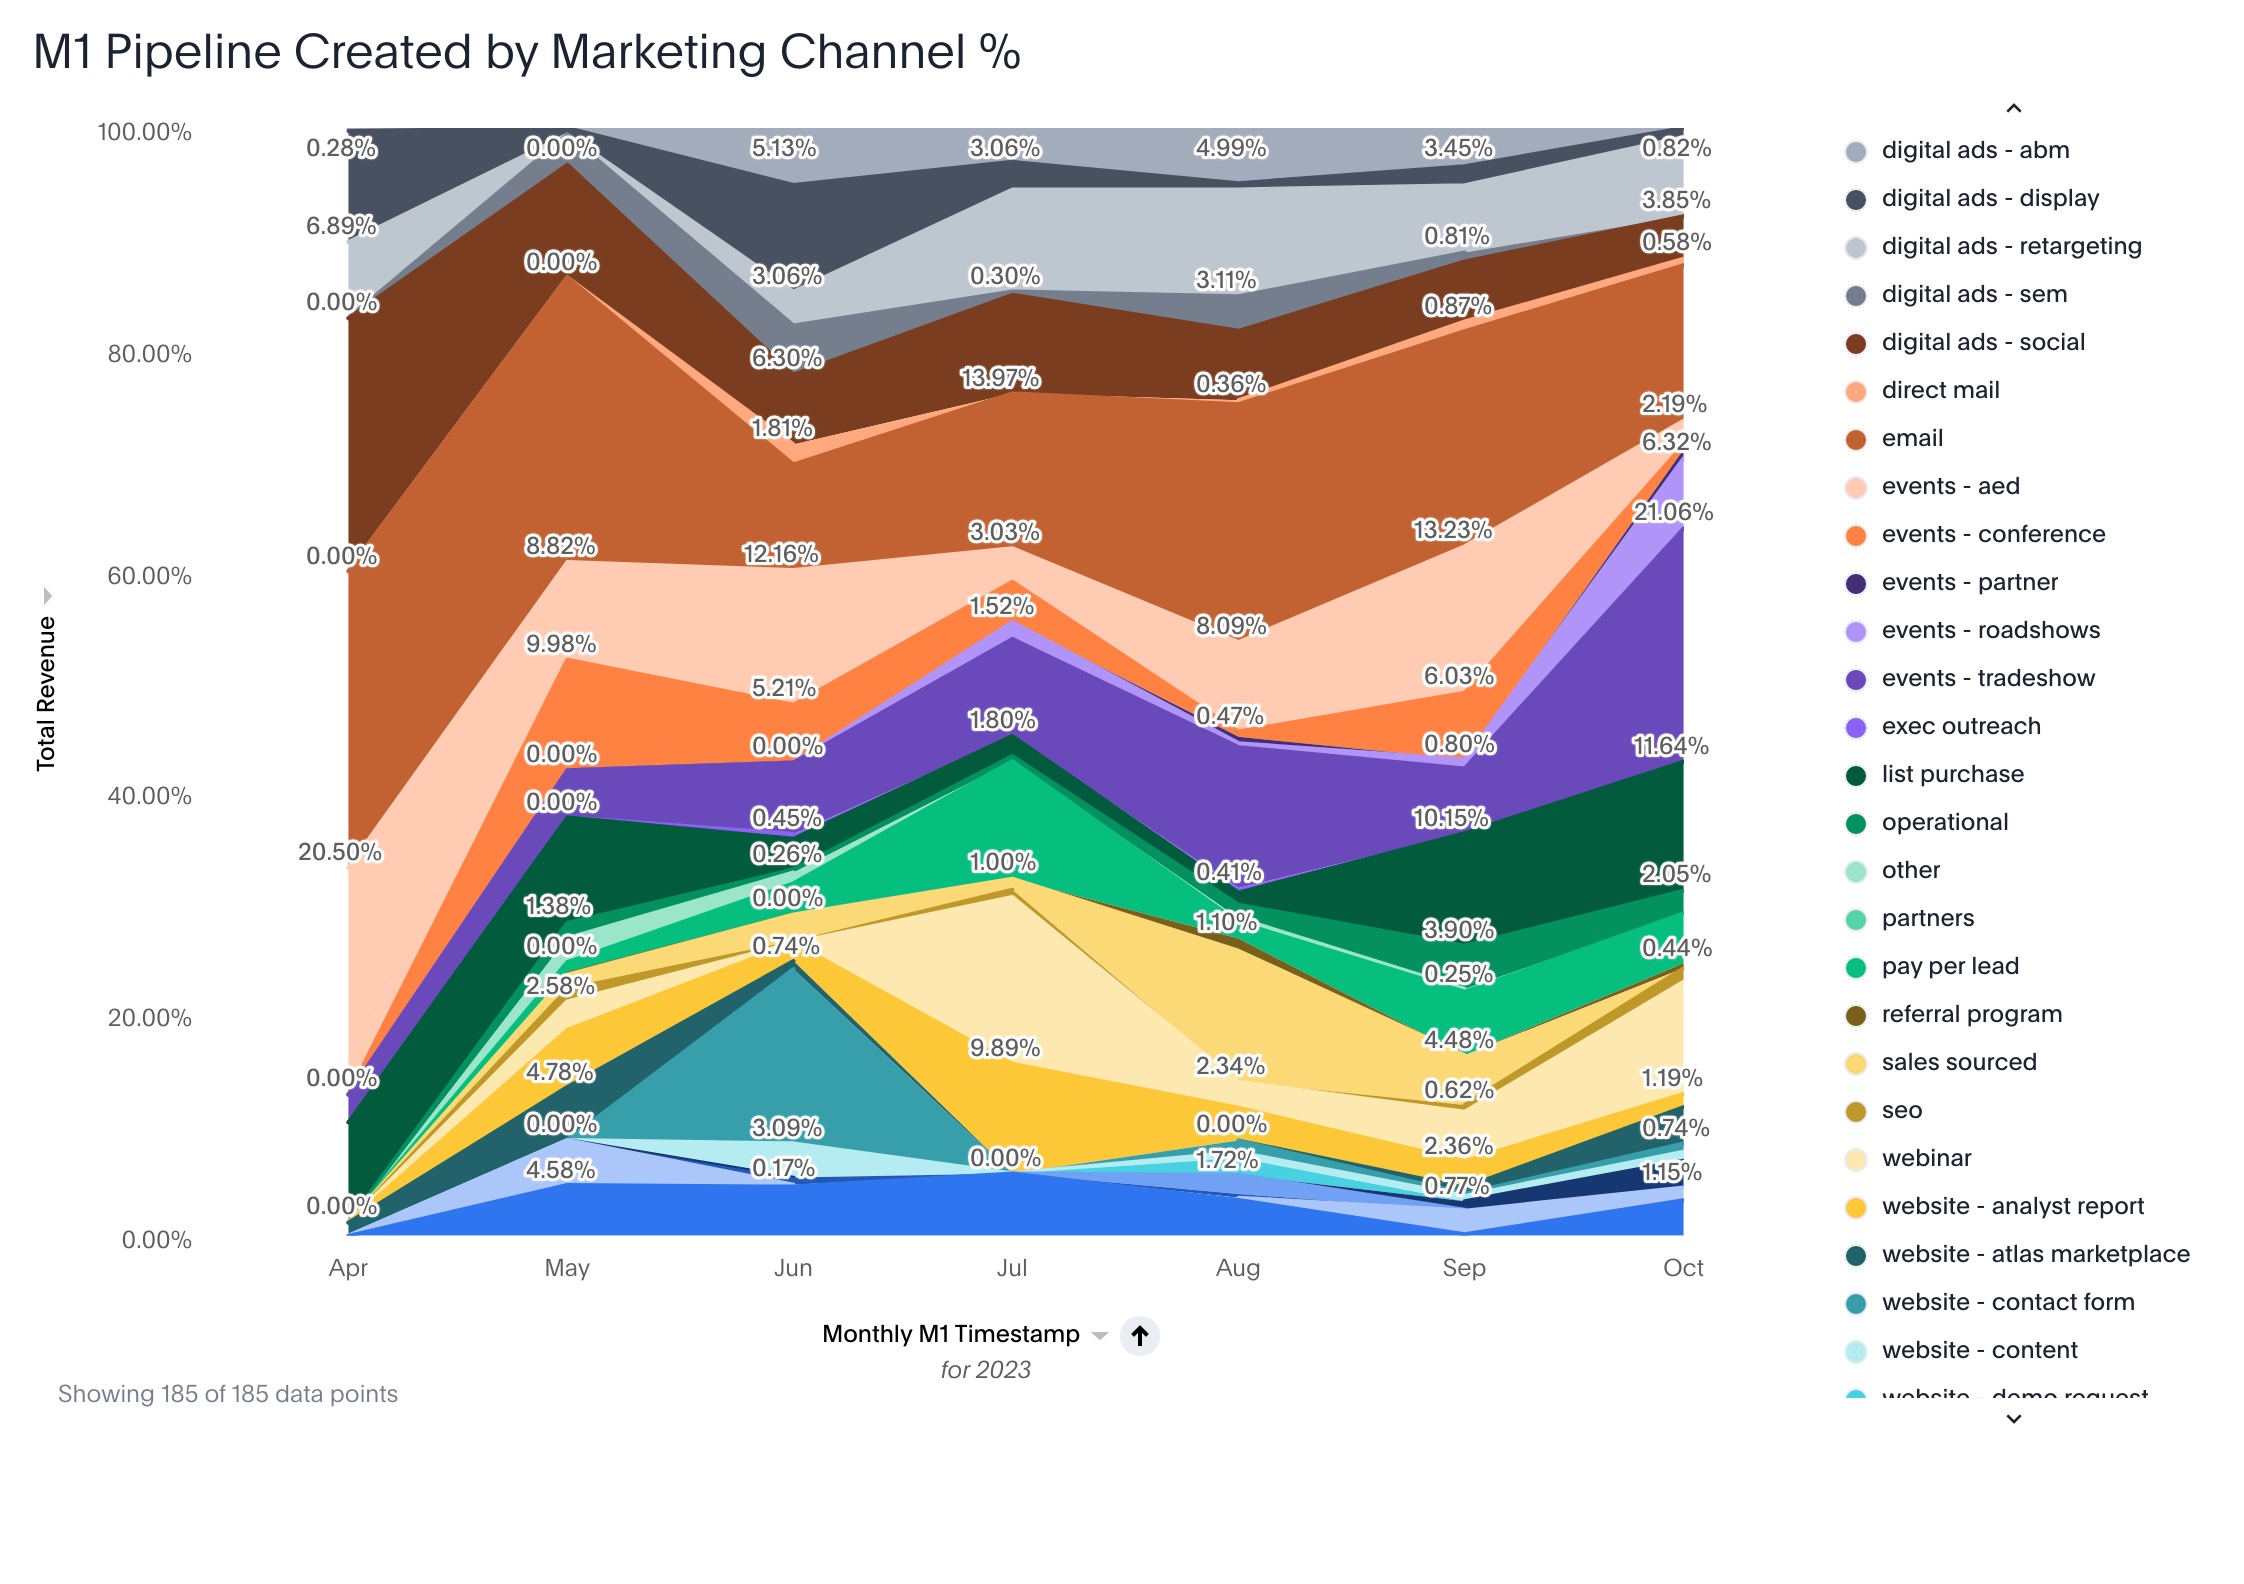
A web analytics dashboard will include data from Google Analytics, perhaps your website itself, and you may also include a profiling tool that gives you more visibility into your website visitors. With all of this data combined in one place, you can start to paint a picture of how prospects and current customers interact with your website.
4. E-commerce dashboard
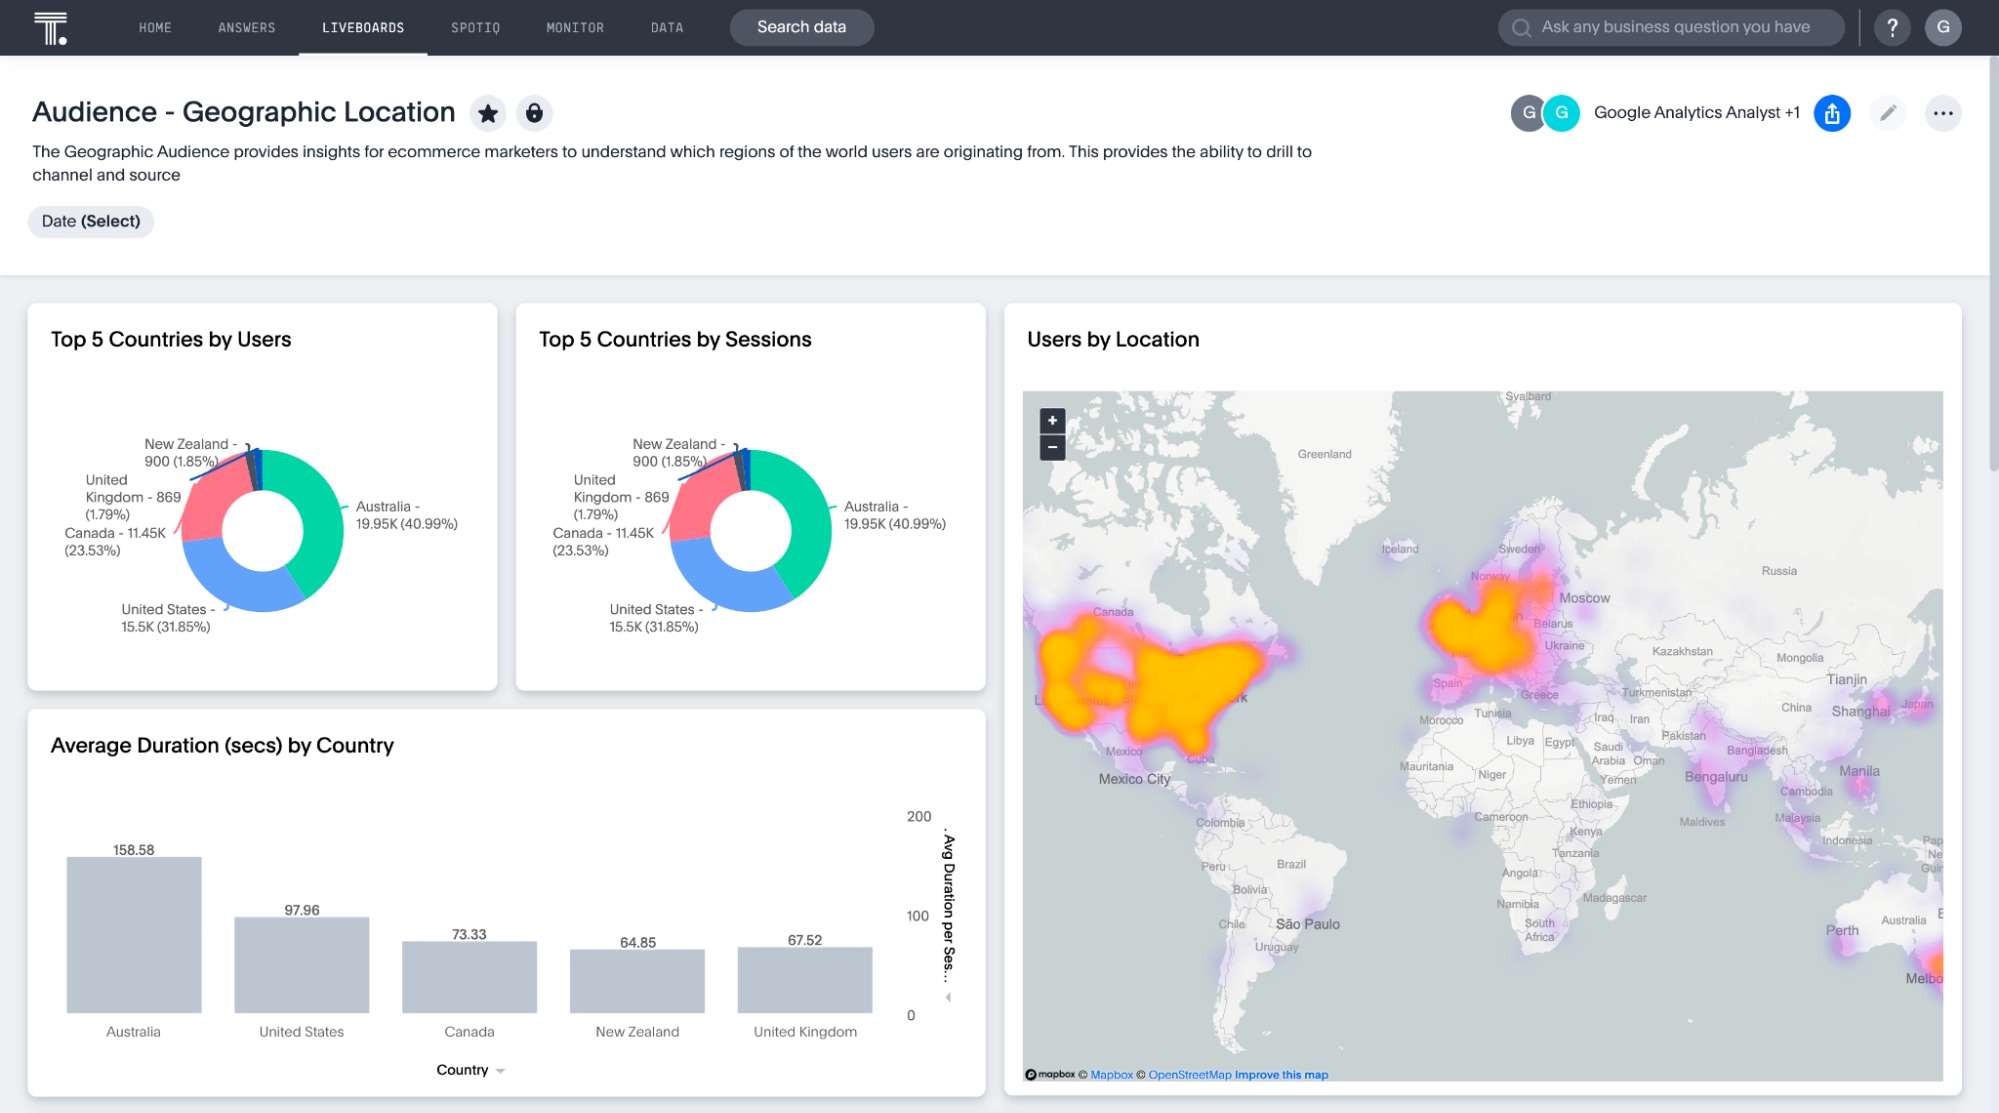
E-commerce dashboards provide online retailers with a snapshot of their sales operations and performance. It typically displays critical e-commerce KPIs and metrics like sales revenue, conversion rates, customer acquisition costs, and inventory levels, which helps you monitor and optimize your online sales strategies and operations.
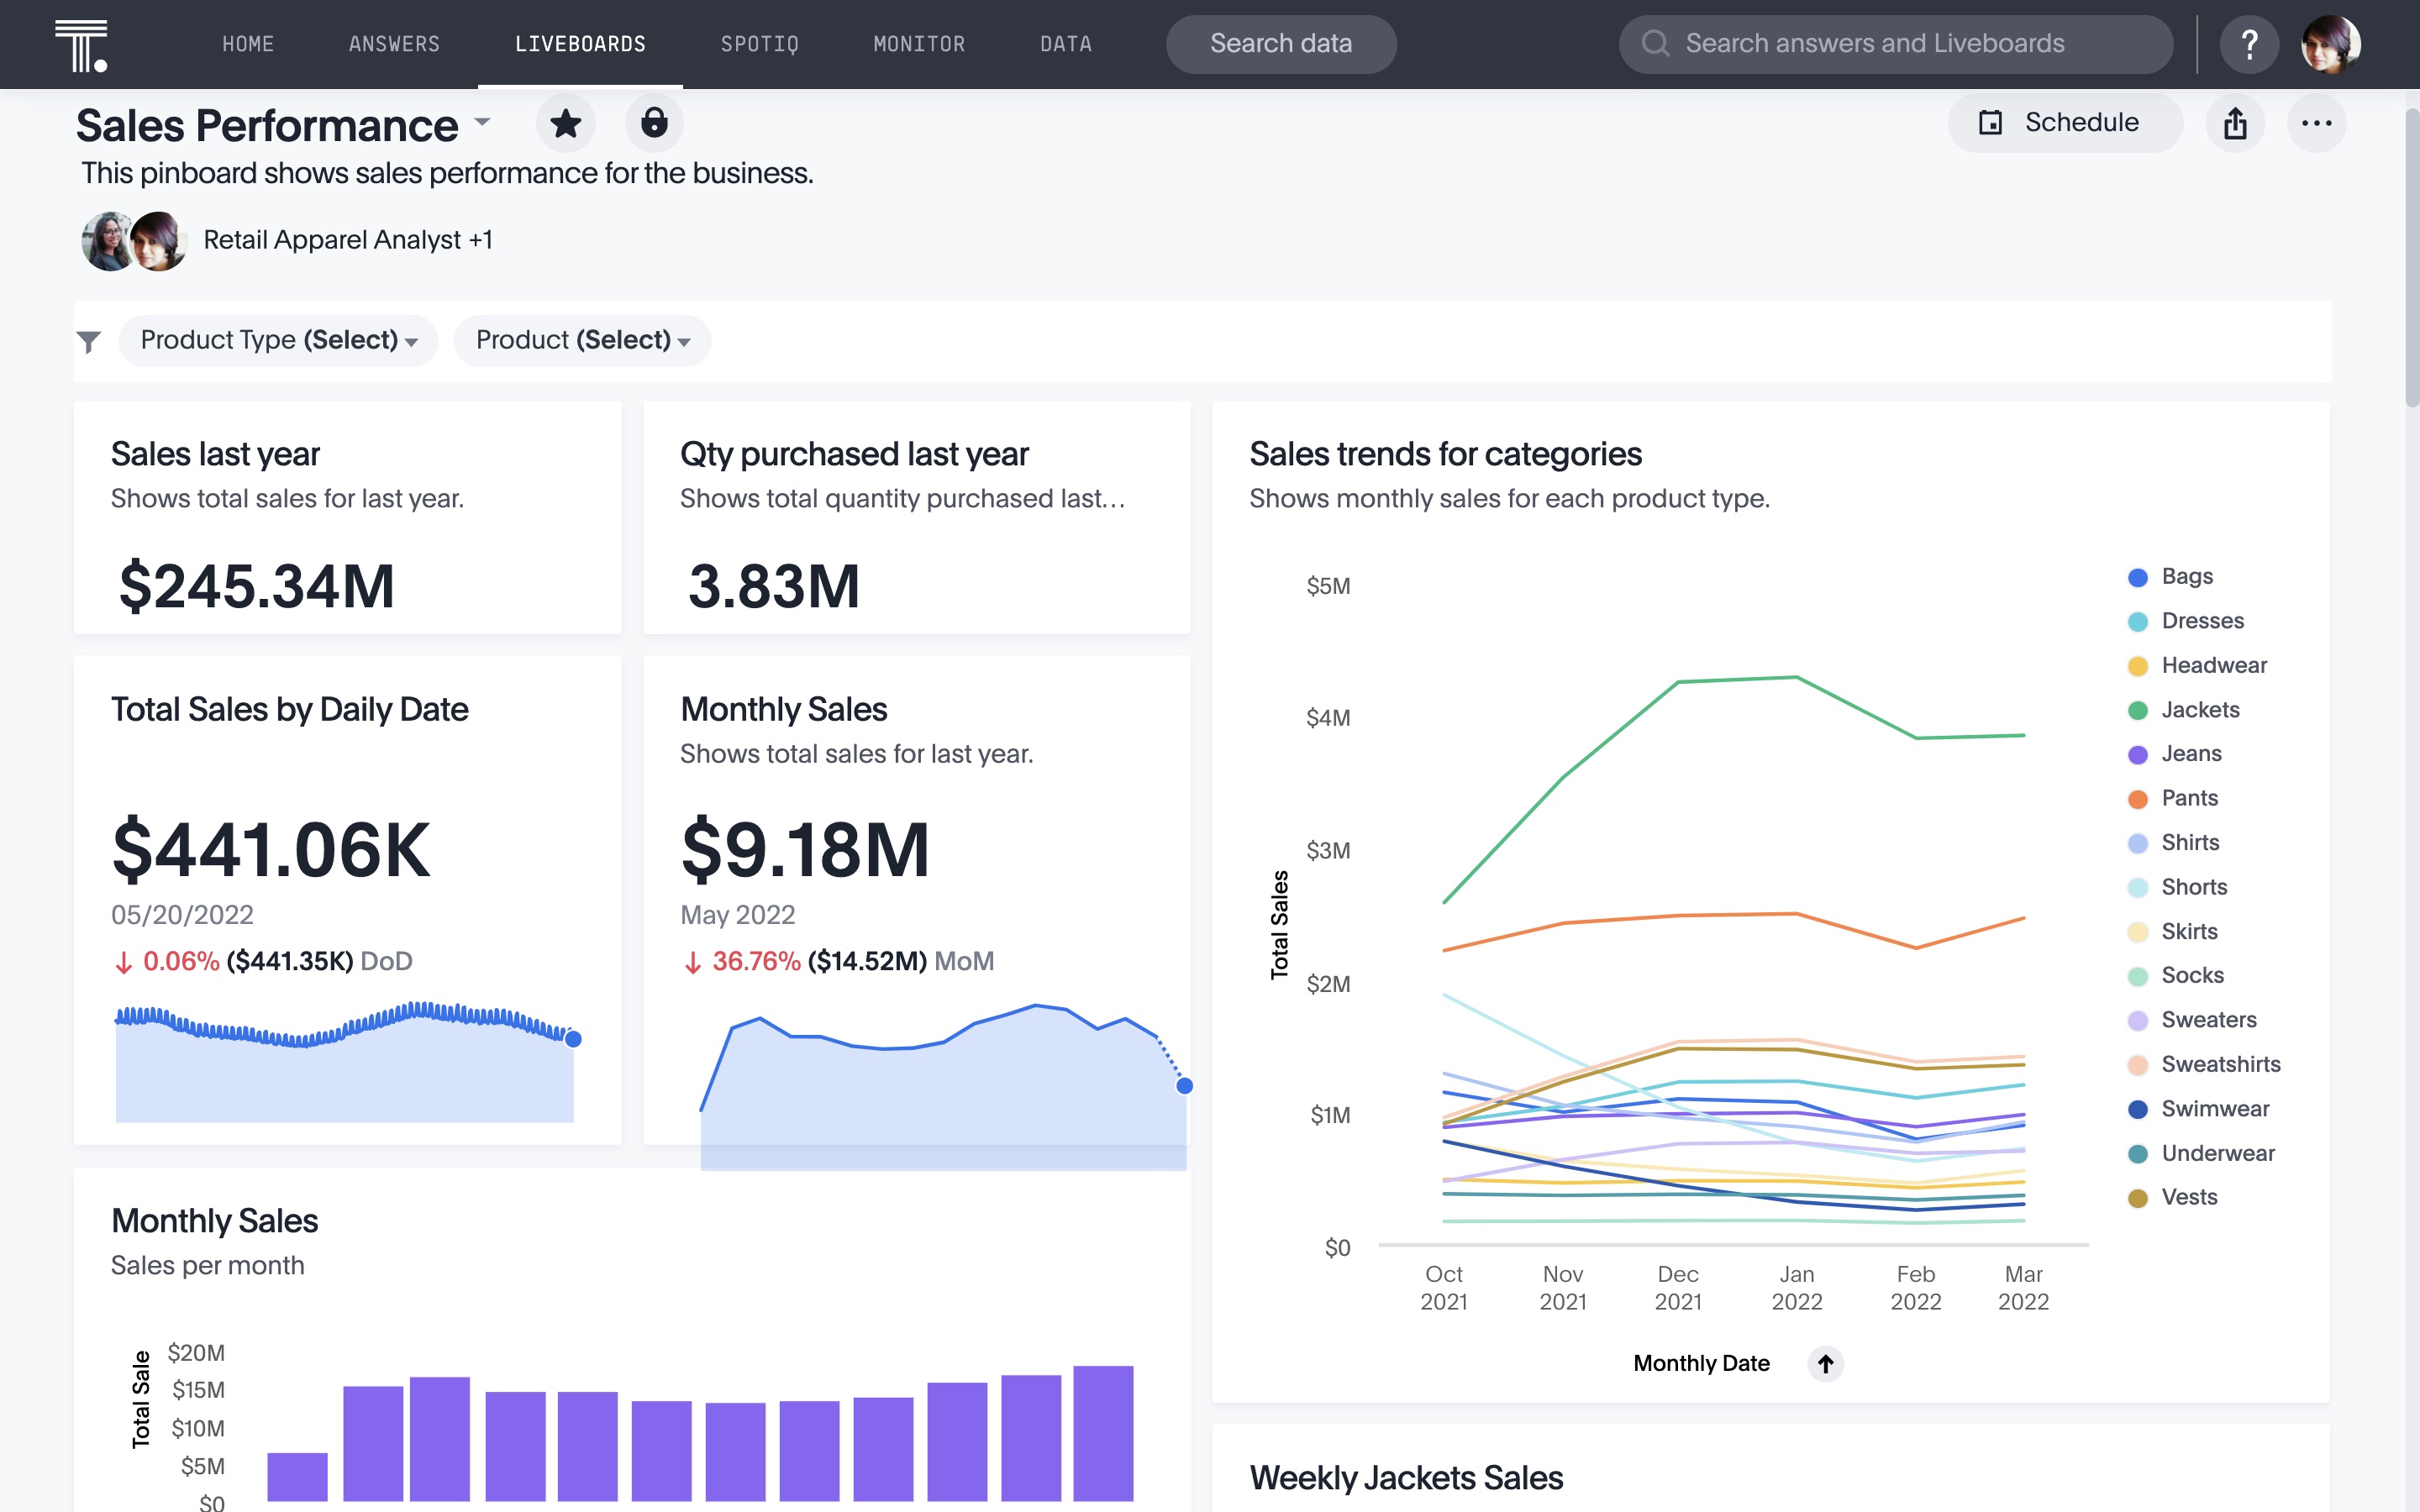
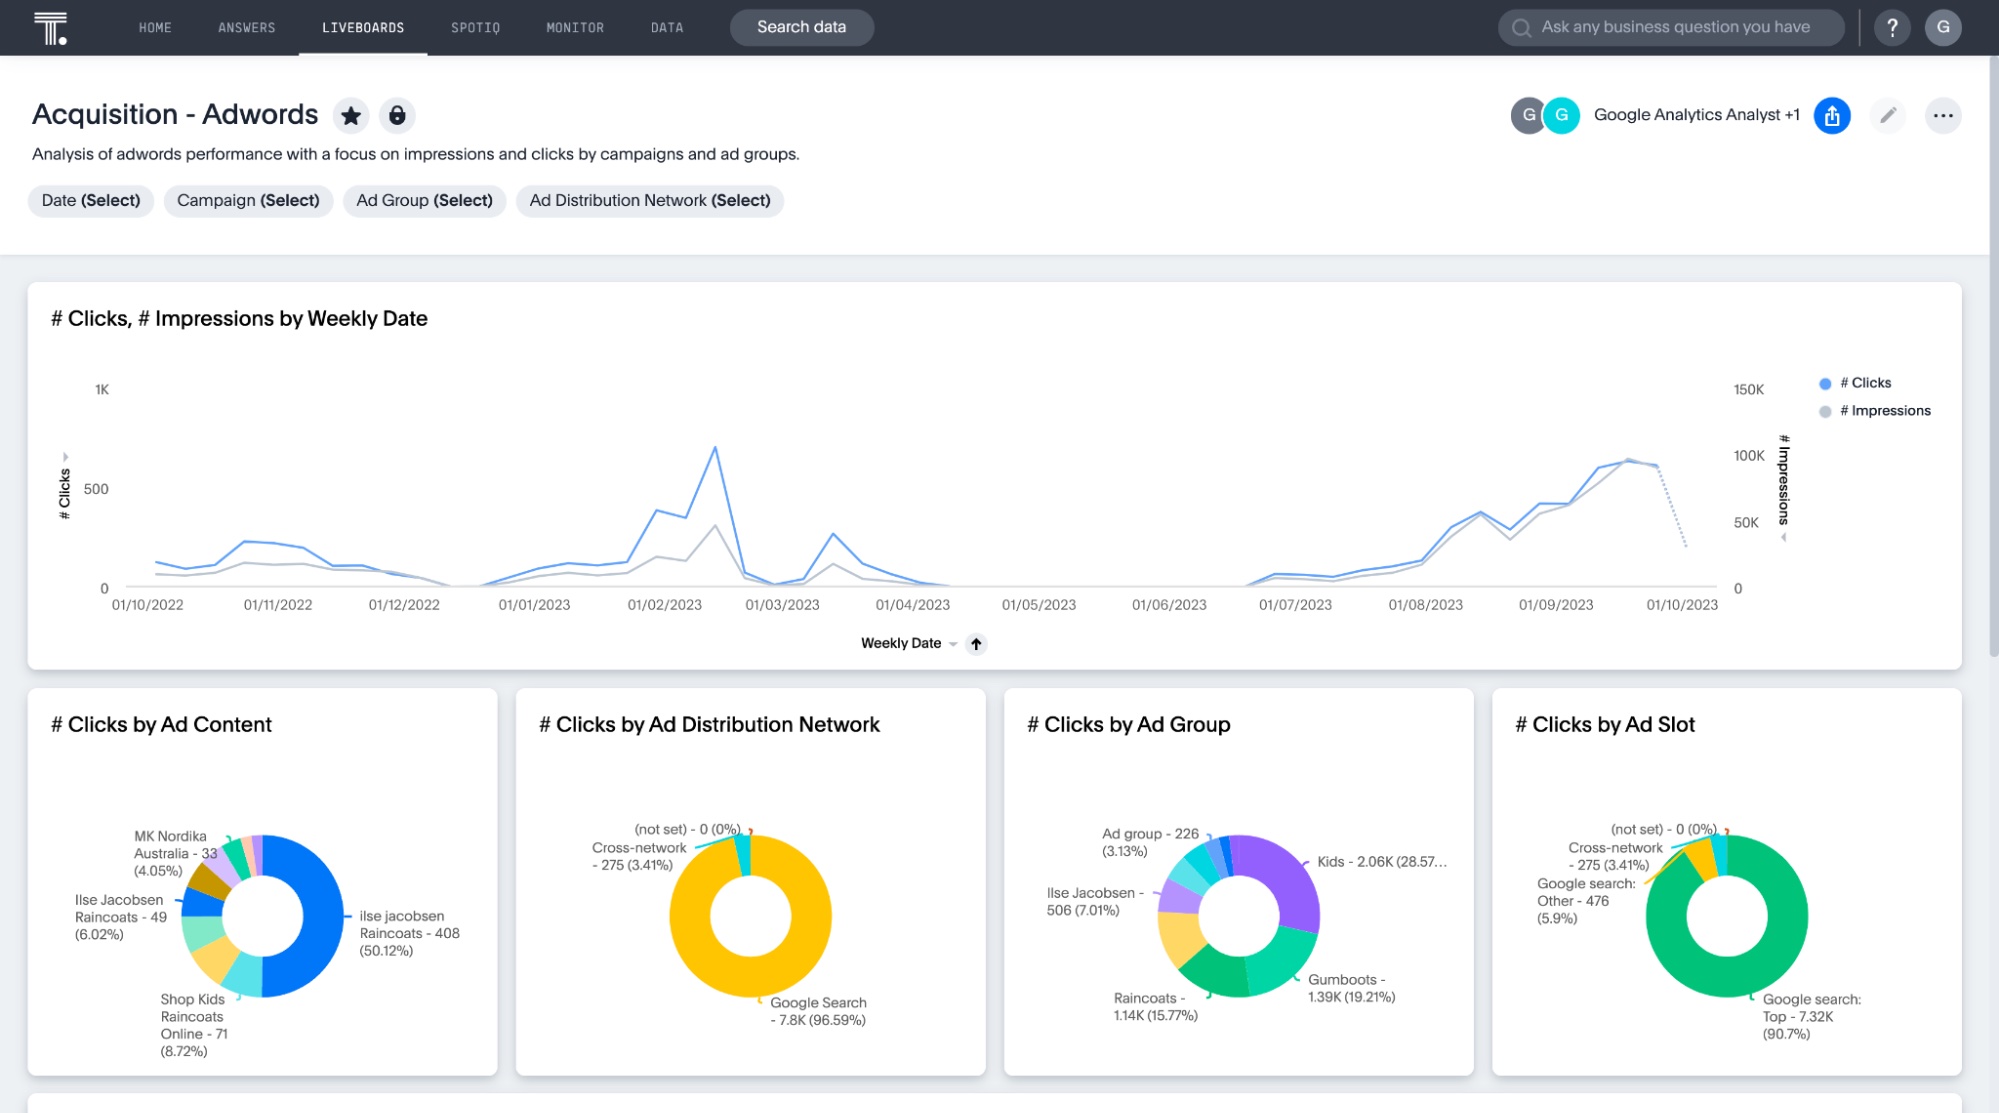
5. Google Ads dashboard
For many marketing teams, Google Ads is a driving force for demand generation. However, those pay-per-click Adwords can get pricey, and quickly. To ensure your ad budget stays aligned, it’s smart to have a dedicated dashboard just for your Google ads.
6. Email performance dashboard
Email marketing dashboards have been a long-time favorite tool for marketers to nurture and inform both customers and prospects. If you’re regularly writing and sending emails, it’s important to understand how they are performing from both a high and granular level of detail.
7. Social media dashboard
Your social media accounts are a valuable tool to drive awareness and website traffic for your business. Your dashboard allows you to gain a better understanding of which content is the most performant across platforms.
8. Social media ads dashboard
LinkedIn Ads and Facebook Ads are two popular social media advertising channels that many marketers use. By creating an integrated dashboard, you can understand the performance of those ads and how that traffic translated into tangible ROI for the business.
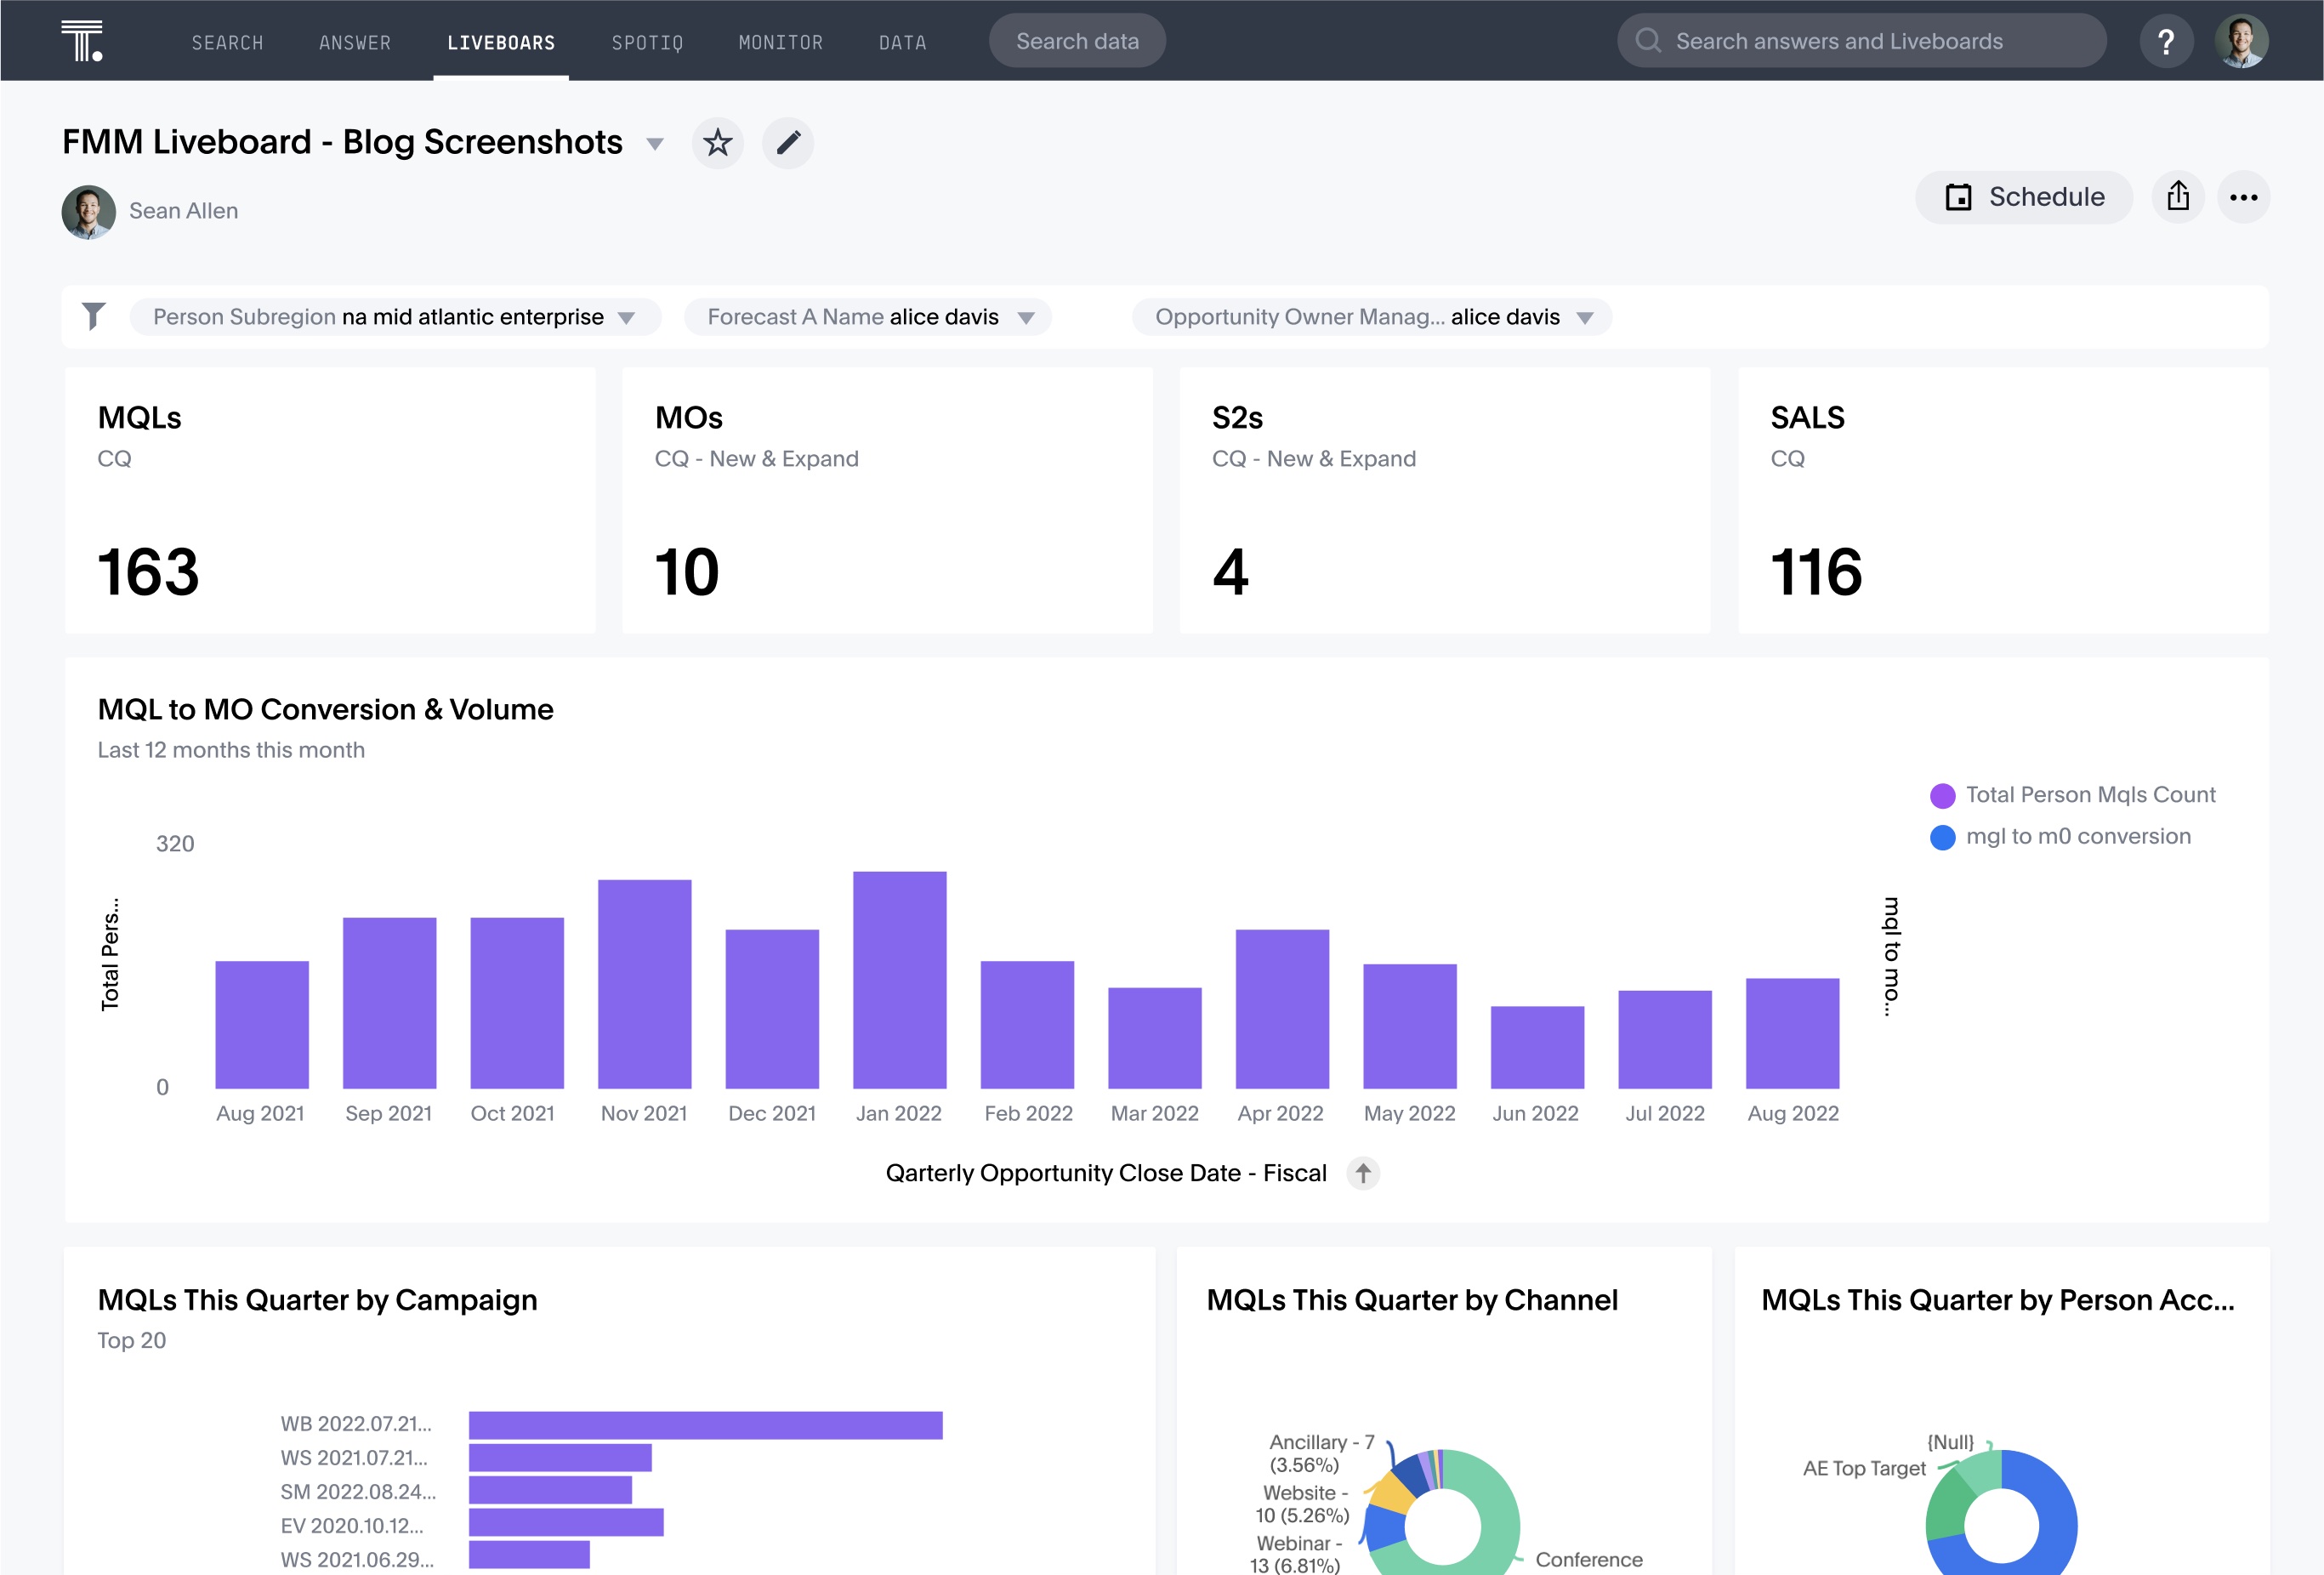
9. Marketing performance dashboard
Your marketing performance dashboard is likely a combination of all of these—providing a detailed view of how each channel is performing. Take a look at this marketing dashboard example.
How to implement marketing dashboards in your business
Step 1: Define your goals
In his article, How to create a BI dashboard, ThoughtSpot’s SVP of Business Operations, Kaushik Patel, talks about the value of proper planning before you start a new dashboard. Here’s his advice:
“[Defining your goals] should be a collaborative process between you and your stakeholders. It isn’t complete until the objectives are clearly defined and agreed to by both the data team and the end consumers.” Kaushik Patel, SVP of Business Operations at ThoughtSpot
Step 2: Choose the right tools
Your insights are only as impactful as your BI solution is engaging. By that I mean, you’ll only find value in your data if it’s connected, accessible, and engaging. There’s a reason we’ve been saying Dashboards are Dead for years now. To get the key features you want in a marketing dashboard, you’ll need to upgrade to a more modern dashboard software—one that’s real-time, interactive, and created for sharing, embedding, and data storytelling.
You need a Liveboard.
Step 3: Start collaborating with data
Once your Liveboard is in place, it’s time to take full advantage of the data insights you have at your fingertips. Drill down into the data, filter to find what’s most relevant, and unlock AI-powered insights. However, collaboration applies to more than the data itself; it also means collaborating with your team.
Show your team how to use your Liveboard to find value, encourage them to explore and identify insights, highlight successful examples of data-driven decision making, and find new ways to introduce data into your current workflows. For example, run your team meeting using Liveboards, set up notifications to slack or other channels using ThoughtSpot Monitor, and bring the power of your real-time Liveboards into your Google Slides presentations.
See how easy it is to connect your data and start finding invaluable insights with Liveboards—schedule a 1:1 demo today!


