


A survey by Pigment found that 89% of finance leaders are facing this challenge every month. It’s huge, isn’t it? Reports like this underscore the critical need for reliable, real-time information to drive informed decision-making and avoid logistical pitfalls. Gone are the days of outdated monthly reports and complex spreadsheets. It's time to harness clear, actionable insights that enhance operational efficiency and strategic planning.
By transforming complex financial data into actionable insights, revenue dashboards can empower you to make informed decisions quickly and effectively.
Table of contents:
A revenue dashboard is a visual interface that consolidates critical financial metrics and data points that directly affect your revenue, giving you real-time insights into your business's performance. Think of it as the command center for your financial data. Instead of piecing together information from various sources, you get a unified, easy-to-understand view of your revenue streams, expenses, and profitability.
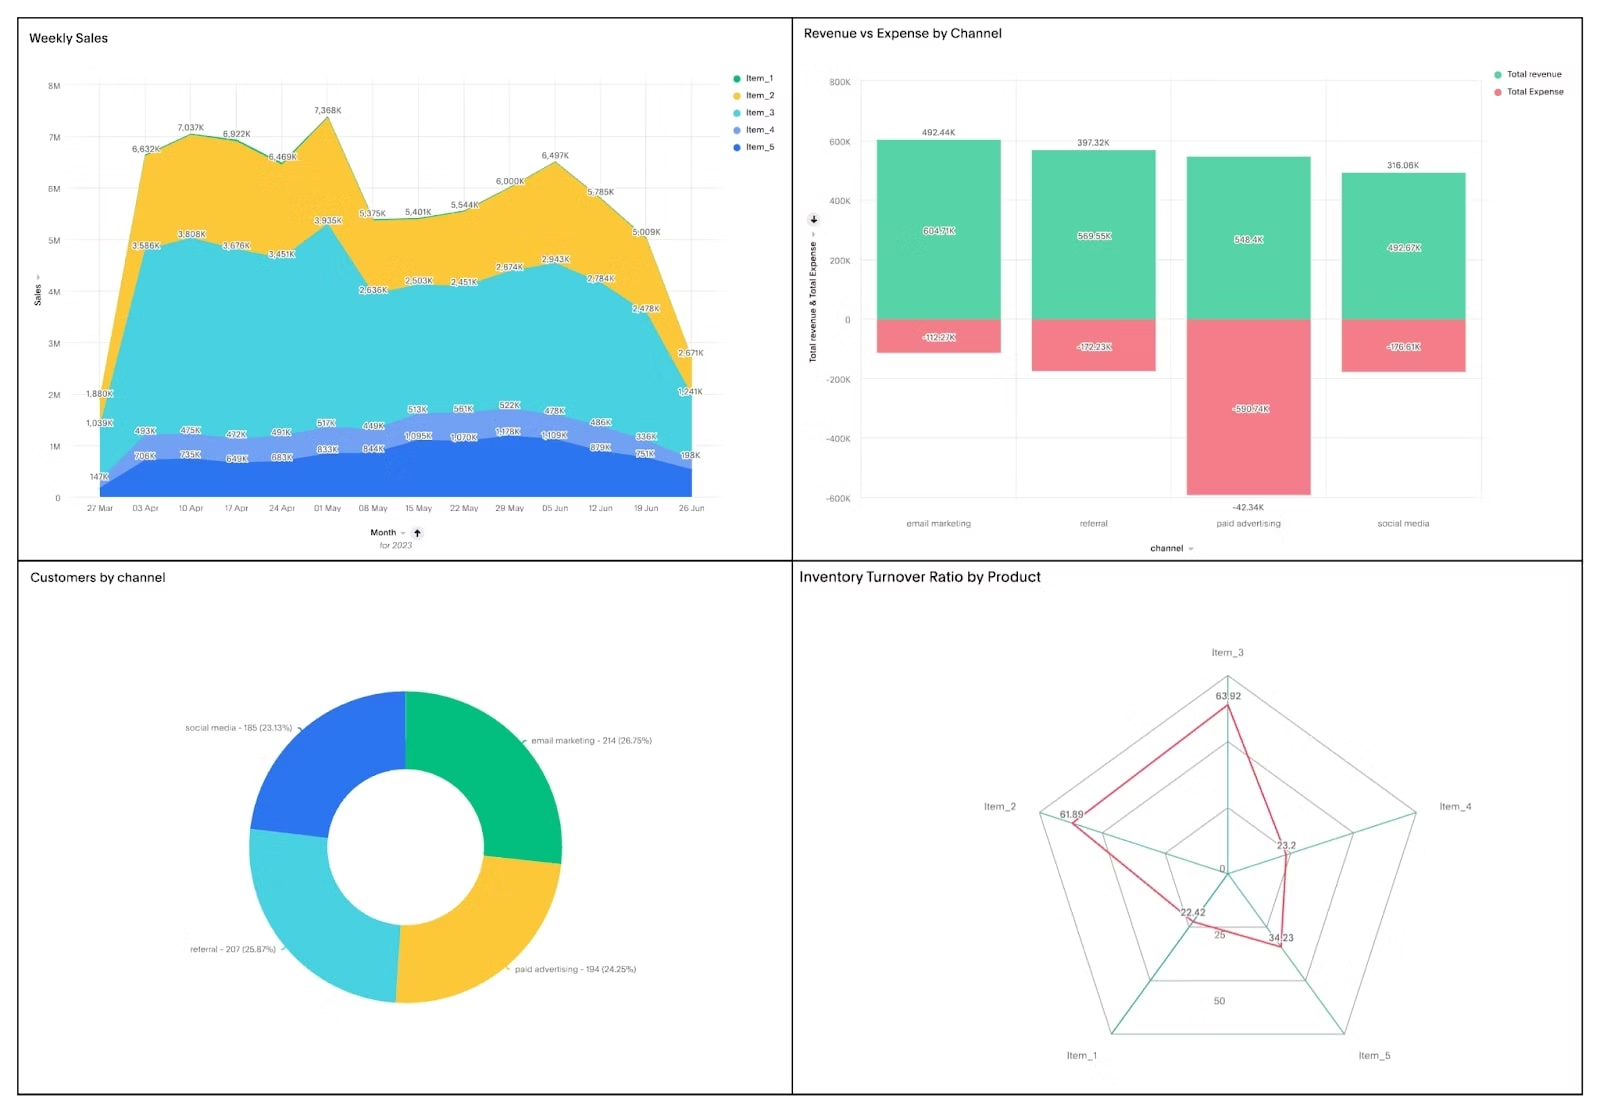
For example, picture you're the CFO of a growing e-commerce startup. With a revenue dashboard, you can instantly see your daily sales figures, monitor customer acquisition costs, and track inventory turnover—all on one screen. This visibility allows you to quickly assess which products are driving revenue, identify any operational inefficiencies, and make informed decisions to optimize your financial strategy.
1. Comprehensive financial insights:
Revenue dashboards offer consolidated views of critical financial metrics such as sales revenue, profitability margins, and cost analysis based on historical data.
Taking it one step further, the real-time analytics solution ThoughtSpot enhances this financial visibility with its Liveboards. These living dashboards continuously update revenue metrics, sales performance, and market trends ensuring stakeholders always have access to the latest insights for real-time decision-making.
2. Visual data representation:
By presenting complex financial data through intuitive charts, graphs, and key performance indicators (KPIs), revenue dashboards enhance data interpretation and analysis. These visual representations simplify the presentation of key trends, variances, and performance indicators across different business units or regions.
Liveboards allow interactive engagement with data through drill-down capabilities, filters, and customizable views. This advanced visualization enables you to explore granular revenue data, dynamically analyze trends dynamically, and uncover actionable insights on demand.
3. Collaborative decision-making:
Traditional dashboards offer consolidated views of critical financial metrics, which help stakeholders monitor performance trends and make informed decisions.
With Spotter, as your AI Analyst, users can effortlessly query revenue data and receive immediate insights. These instant insights foster a more dynamic and collaborative environment where teams can track progress, adapt strategies, and make cohesive, data-driven decisions together.
4. Predictive analytics:
Revenue dashboards primarily focus on historical data, providing valuable insights into past performance. However, they’re limited in their ability to forecast future trends. They often require manual analysis to generate predictive insights.
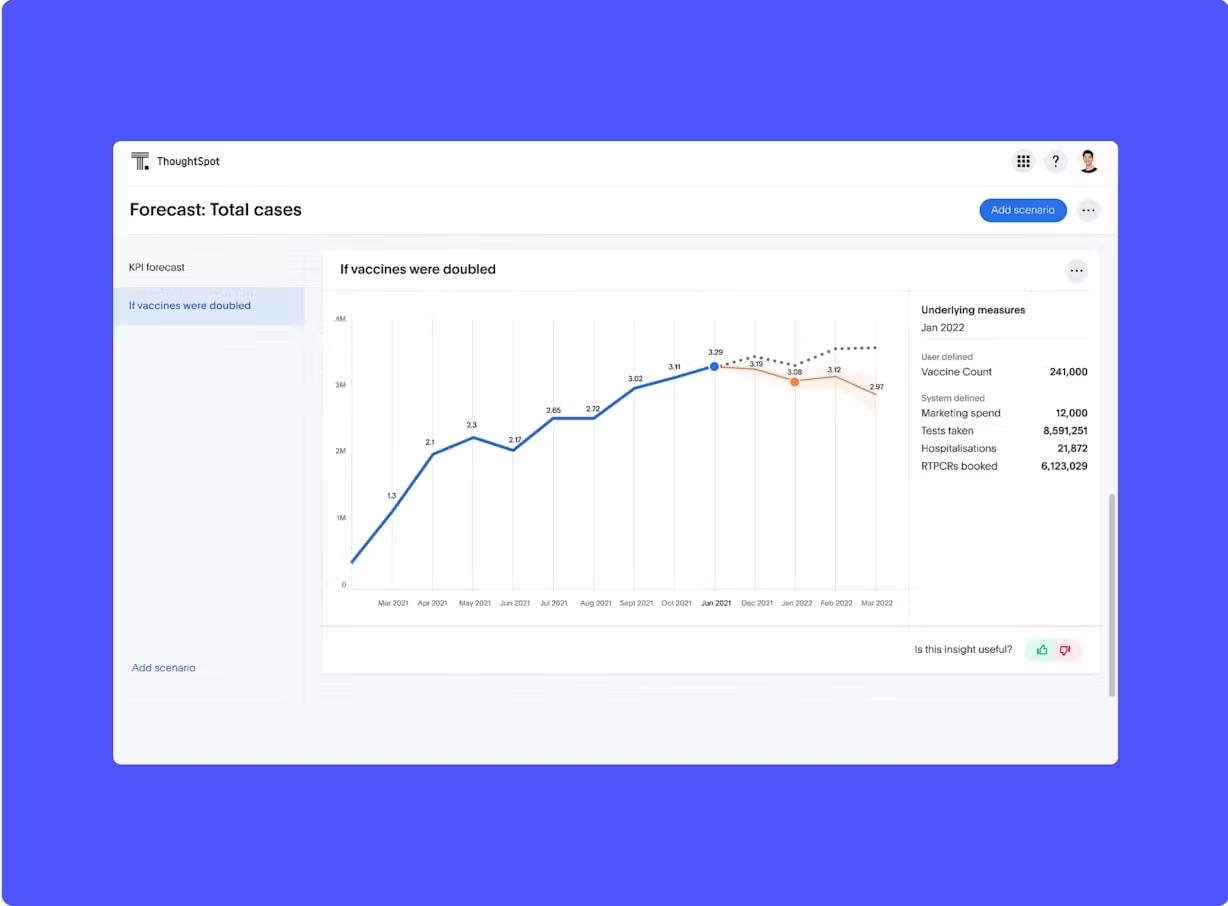
ThoughtSpot’s SpotIQ takes insight discovery to the next level. With advanced machine learning capabilities, SpotIQ automatically analyzes data to uncover hidden patterns and correlations. The “what-if” scenario exploration further enhances strategic planning by simulating various business scenarios based on real-time data analysis.
5. Better communication:
Revenue dashboards help clearly and effectively communicate with stakeholders by presenting visually engaging reports. These reports make it easy to share complex financial insights with executives, investors, and other key stakeholders, fostering transparency and trust.
Liveboards enhance this capability by seamlessly integrating real-time revenue data for boardroom presentations with Present mode. Additionally, Liveboards connect with tools like Excel and Google Suite to automatically update live data in presentations, eliminating the need for manual updates before team meetings.
1. Sales performance dashboard
By leveraging a sales dashboard, sales teams can monitor their performance against targets, identify top-performing products or regions, and forecast future sales trends. Whether optimizing sales strategies or allocating resources effectively, this revenue dashboard example is a vital tool for driving revenue growth and achieving sales objectives.
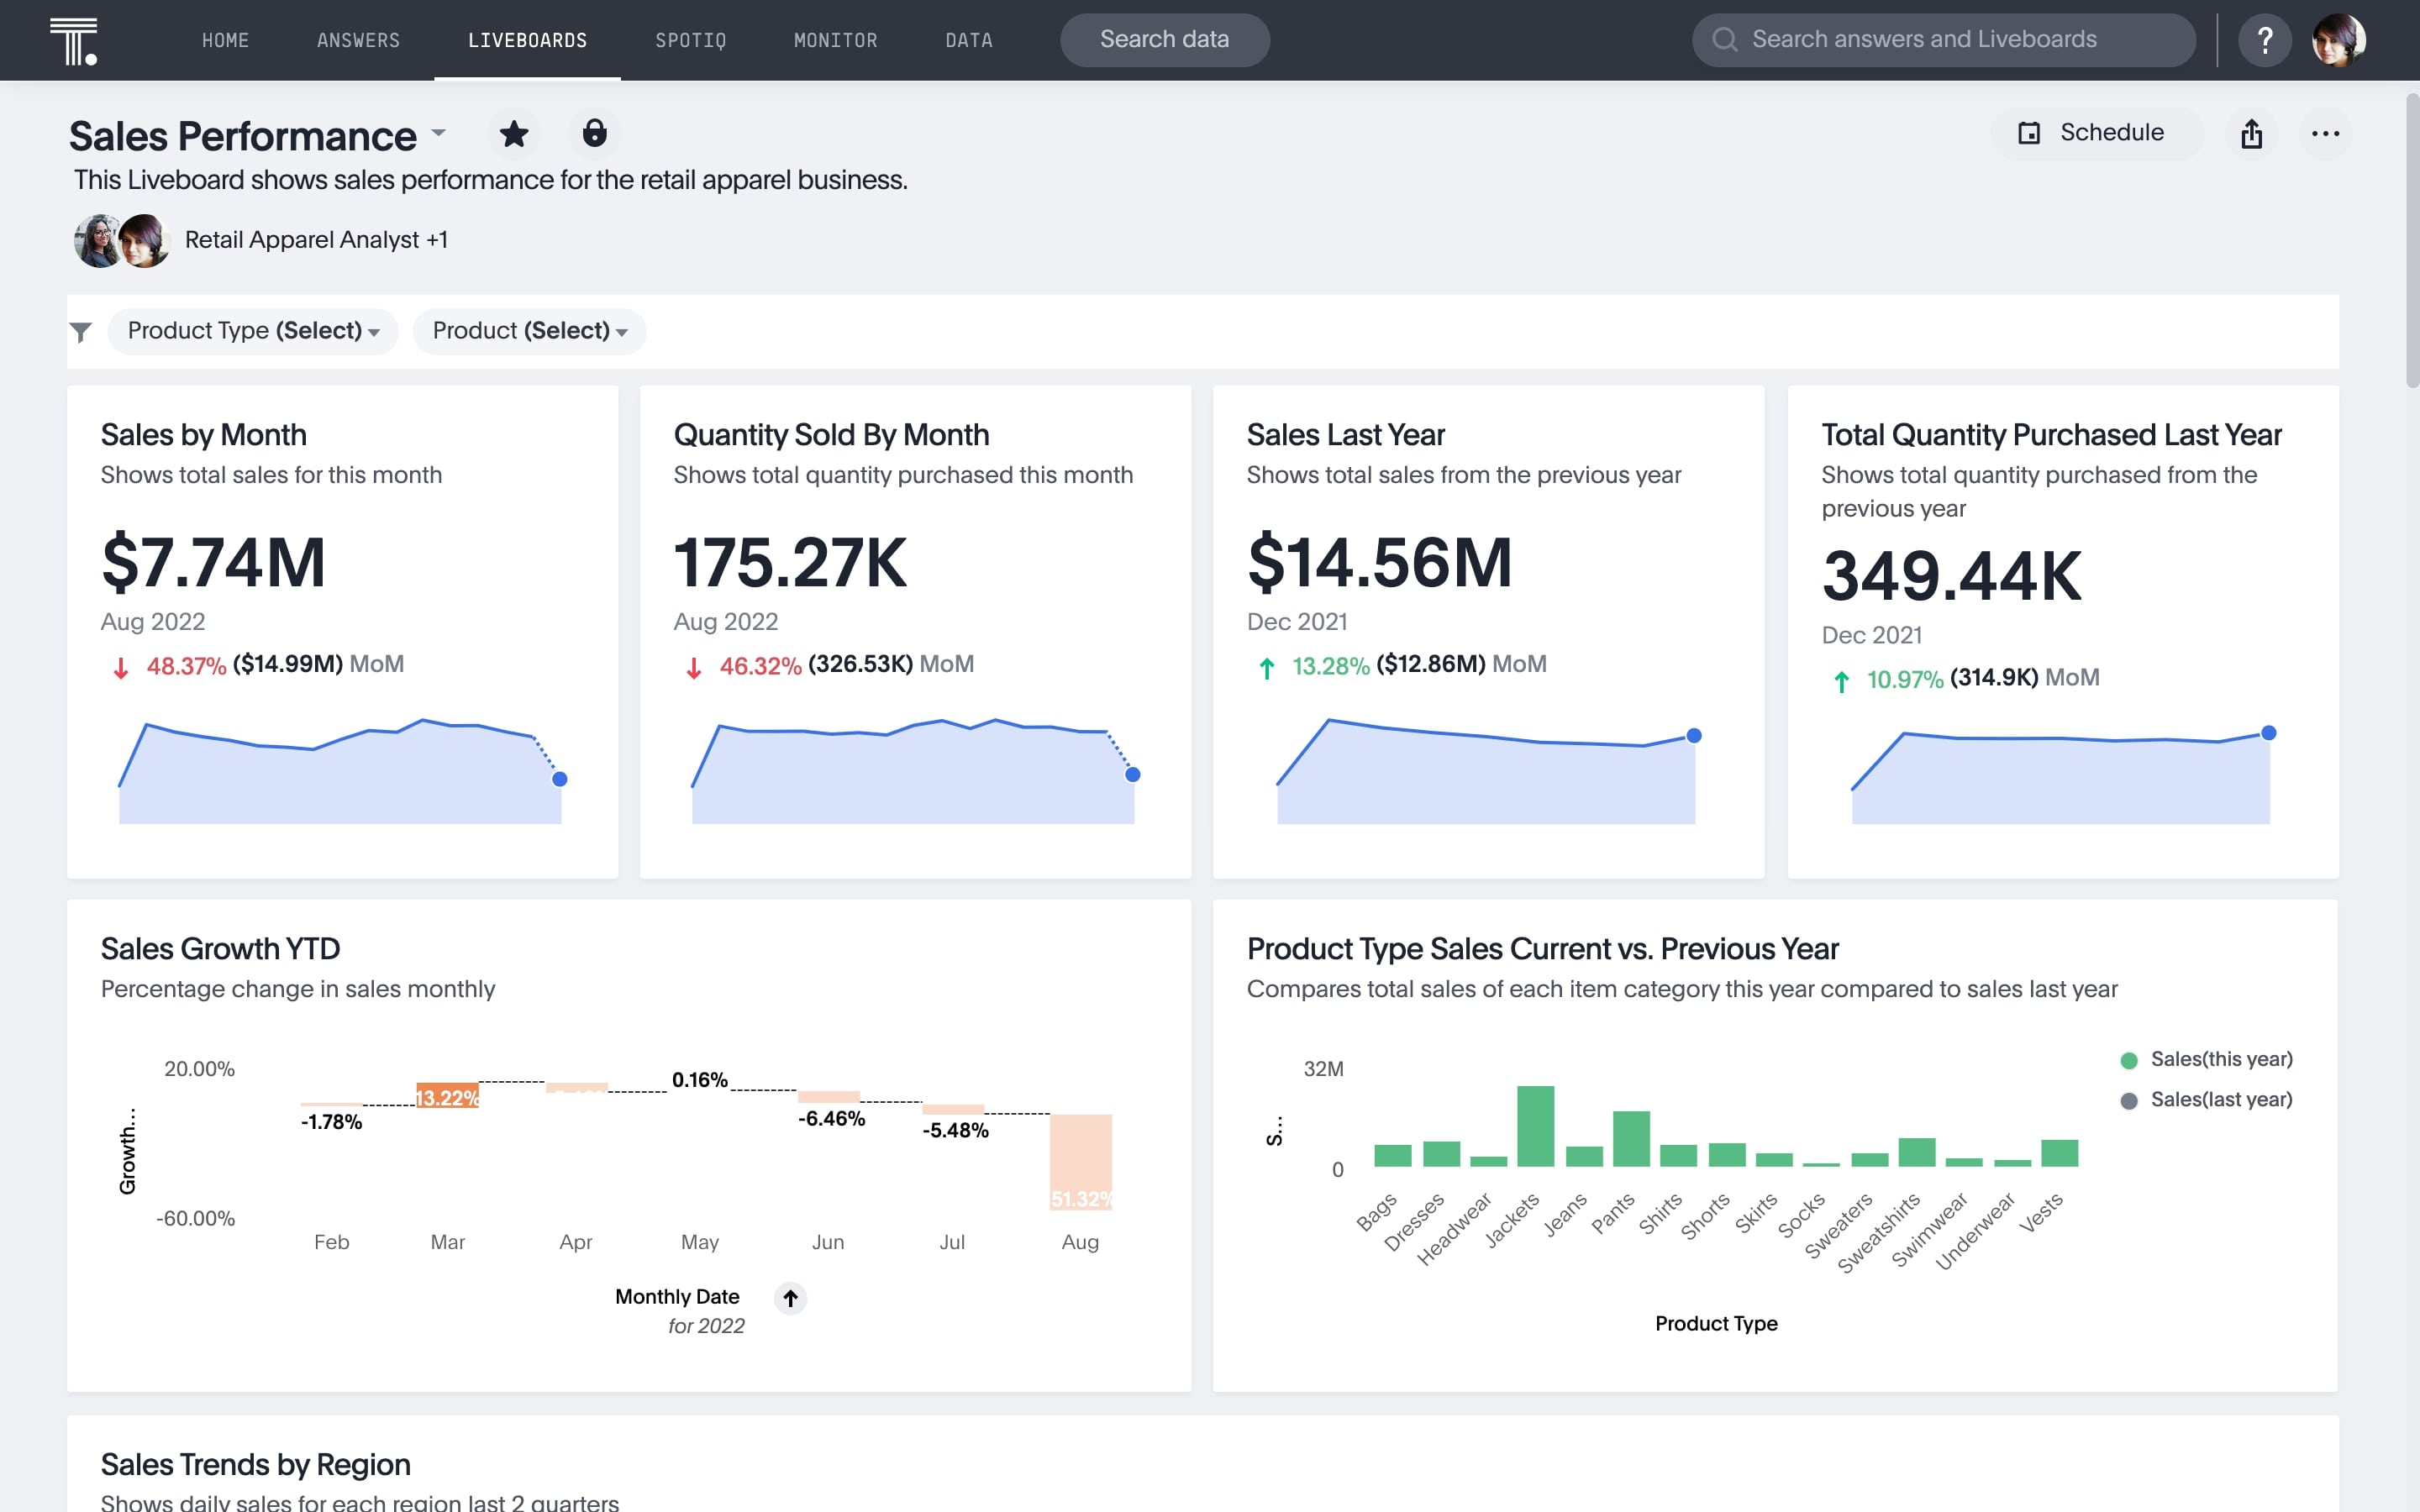
For example, cabinet manufacturer Fabuwood's executives sought real-time access to sales data. They leveraged a user-friendly business intelligence (BI) tool to sort data by product type, location, customer, and sales representative. Today, the Sales Liveboard serves as Fabuwood's central information hub, ensuring real-time sales data is easily accessible to everyone through ThoughtSpot.
Important KPIs to track:
Sales revenue: Tracks total revenue generated from sales activities
Units sold: Measures the quantity of products or services sold
Average order value (AOV): Calculates the average value of each sales transaction
Sales pipeline status: Provides insights into the stages of the sales process and conversion rates
🔍 Top 16 sales metrics and KPIs to track in 2024
2. Profitability dashboard
A profitability dashboard analyzes critical financial metrics, Finance teams use them to monitor financial health, identify cost inefficiencies, and optimize pricing strategies to enhance profitability. Whether conducting cost analyses or forecasting financial performance, this dashboard plays a crucial role in driving sustainable business growth and improving overall financial outcomes.
Important KPIs to track:
Profit margin: Calculates the percentage of revenue that remains after deducting costs
Cost of goods sold (COGS): Represents the direct costs attributable to the production of goods sold by a company
Operating expenses: Tracks the ongoing costs of running a business, excluding COGS
Net profit: Measures total earnings after deducting all expenses from revenue
Gross profit margin: Evaluates the profitability of goods sold, calculated as a percentage of revenue
3. Revenue cycle dashboard
A revenue cycle dashboard is essential for monitoring and optimizing the financial processes that drive your organization. It provides a comprehensive overview of the financial health and operational efficiency, enabling finance teams to manage billing, collections, and revenue recognition. This dashboard empowers decision-makers to improve cash flow, reduce bad debt, and enhance overall financial performance.
Important KPIs to track:
Gross revenue: Total revenue generated before any deductions
Net revenue: Revenue after subtracting deductions like discounts, returns, and allowances
Revenue leakage: Identifies lost revenue due to billing errors, uncollected charges, or inefficiencies in the revenue cycle
Bad debt expense: The amount of receivables that cannot be collected
Days in accounts receivable: Measures the average number of days it takes to collect payment after a sale
Clean claim rate: Percentage of claims submitted without errors or missing information
4. Financial forecasting dashboard
A financial forecasting dashboard integrates historical financial data with predictive analytics to forecast revenue trends. Leveraging a financial forecasting dashboard, organizations can plan budgets, mitigate financial risks, and capitalize on growth opportunities. Whether conducting scenario analyses or modeling future financial scenarios, this dashboard provides critical insights for strategic decision-making and long-term financial planning.
Important KPIs to track:
Revenue trends: Predicts future revenue based on historical data and market trends
Cash flow projections: Forecasts incoming and outgoing cash over a specific period
Financial ratios: Evaluates financial performance using metrics like liquidity, solvency, and profitability ratios
Budget variances: Compares actual financial performance against budgeted expectations
5. Executive dashboard
An executive dashboard consolidates KPIs across various departments or business units into a single, comprehensive view tailored for executive stakeholders. By utilizing an executive dashboard, senior management can monitor overall revenue, profitability, market share, customer satisfaction scores, and operational efficiency metrics. This dashboard facilitates strategic decision-making by providing real-time insights into organizational performance and identifying trends that require executive attention.
Let’s consider Neobank Northmill. Before adopting ThoughtSpot’s Liveboards, Northmill's data team invested countless hours in constructing traditional reports. Today, ThoughtSpot empowers Northmill to create Liveboards tailored for users across finance, marketing, product management, and customer service.
Here’s what Tobias Ritzé, Former CFO of Northmill Bank has to say about ThoughtSpot:
"I use ThoughtSpot to help manage the business every day, looking at metrics like sales performance across different time periods and conversion rates. It’s also a real benefit to have live data available in my phone and be able to answer questions on the spot in meetings. It certainly gives me an edge in the boardroom, in investors meetings, and so on. I can always check my phone and get the data that I want."
Important KPIs to track:
Overall revenue: Summarizes total revenue generated across all business operations
Profitability metrics: Measures profitability through metrics like gross profit margin and net profit margin
Market share: Evaluates the percentage of total market sales captured by the organization
Customer satisfaction scores: Assesses customer satisfaction levels through feedback and surveys
Operational efficiency metrics: Tracks efficiency through metrics such as inventory turnover and resource utilization
Navigating vast amounts of business data can be daunting, but it doesn’t have to be. ThoughtSpot empowers organizations to harness the full potential of revenue dashboards with intuitive tools that simplify data analysis. Designed with a consumer-grade UX, ThoughtSpot's intuitive interface enables users to effortlessly explore revenue data through natural language search, eliminating the need for specialized training or technical expertise. Trusted by industry leaders such as Snowflake, HP, and OrderPay, ThoughtSpot is revolutionizing revenue analytics with its consumer-friendly approach.
Key benefits of ThoughtSpot over other legacy dashboard tools:
ThoughtSpot's Liveboards offer a consolidated view of critical metrics with extensive drill-downs and filters, facilitating ad-hoc analysis and real-time data exploration.
Liveboards empower every user with the ability to create personalized data visualizations using a natural-language search interface.
ThoughtSpot's AI-augmented analytics detect anomalies and highlight optimization opportunities, providing actionable insights that drive smarter business decisions.
Embrace the future of data-driven decision-making with ThoughtSpot–take a product tour today.


