


Running a retail store means juggling multiple data points—from sales figures to inventory levels, customer behavior to employee performance. The challenge? Turning this mountain of data into actionable decisions. This is where store performance dashboards come in.
Store performance dashboards provide clear, actionable insights that empower you to make informed decisions quickly and effectively. In a landscape where missed insights can mean lost sales, effectively using these dashboards can be the key to thriving, not just surviving. This article will guide you in maximizing your store's potential.
Table of contents:
A store performance dashboard is a visual interface that provides real-time insights into your store’s performance. Think of it as the command center for your retail operations. Instead of piecing together information from various sources, you get a unified, easy-to-understand view of key performance indicators (KPIs).
Imagine you're the manager of a bustling retail chain. With a store performance dashboard, you can instantly see your daily sales figures, monitor stock levels, and track customer satisfaction—all on one screen. This visibility allows you to quickly assess which products are performing well, identify any operational inefficiencies, and make informed decisions to optimize your store's strategy.
1. Comprehensive retail insights: Store performance dashboards provide a consolidated view of essential retail metrics. This comprehensive overview allows managers to make quick, informed decisions based on real-time data.
Many legacy software dashboards rely on outdated static reports, but innovative solutions like ThoughtSpot’s Liveboards continuously update key metrics. This constant flow of real-time information enhances stakeholders’ ability to swiftly respond to changing conditions.
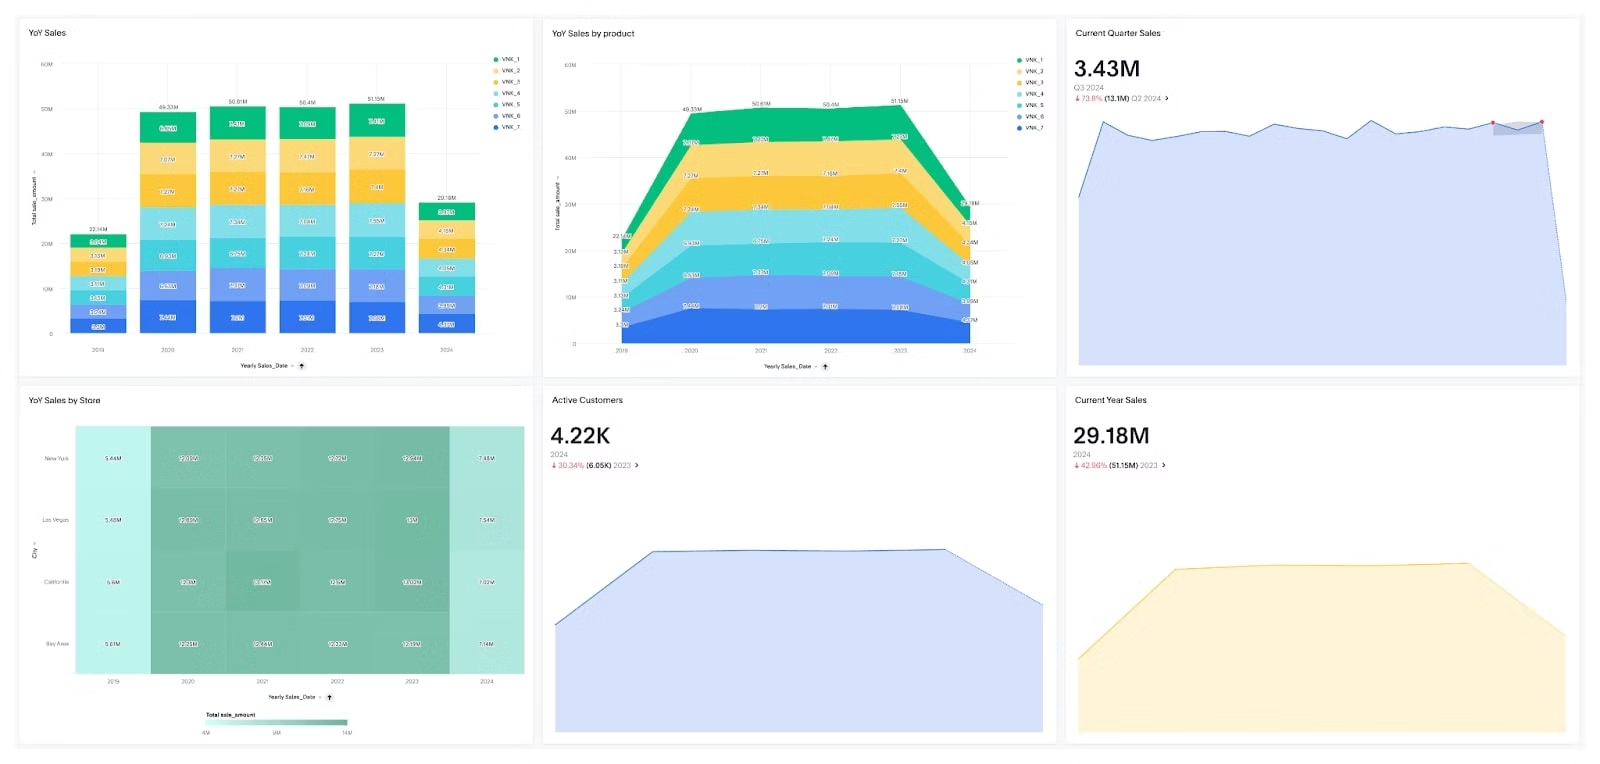
2. Visual data representation: A key benefit of store performance dashboards is their ability to present complex data in intuitive formats like charts and graphs which makes it easier for you to analyze trends and identify actionable insights.
While many dashboards offer basic visualizations that can be hard to interpret, ThoughtSpot Liveboards take it a step further with advanced features like interactive heat maps and customizable dashboards. These tools enhance your ability to see patterns and make informed decisions.
3. Enhanced decision-making: Store performance dashboards promote collaborative decision-making by providing teams with access to vital metrics. The real-time visibility fosters discussions and aligns strategies across departments.
But note that, not all dashboards support advanced collaborative features. Some require manual updates and data sharing which can lead to bottlenecks. With ThoughtSpot’s AI-powered natural language search, you can effortlessly query data and share insights in real-time. Your team can ask questions and receive instant insights without needing to navigate complex interfaces.
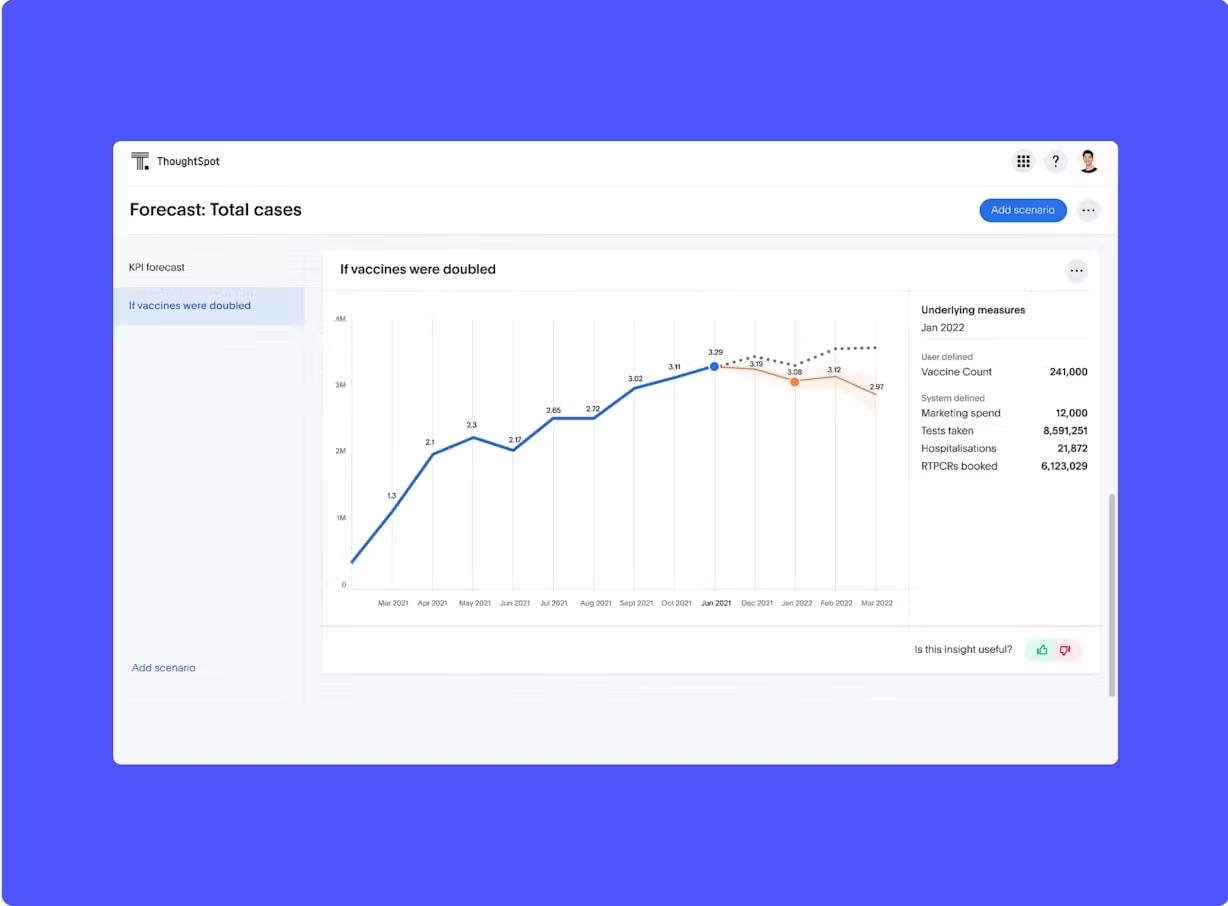
4. Predictive analytics: Anticipating future trends and customer behaviors is crucial for maintaining a competitive edge in retail. Many businesses struggle in this area, particularly when relying on legacy dashboards that offer limited predictive capabilities. These systems often focus on historical data without providing actionable forecasts, leading to missed opportunities and reactive decision-making.
Advanced solutions like ThoughtSpot’s SpotIQ leverage machine learning to analyze large datasets, uncovering hidden patterns and trends. By automating the forecasting process, businesses can generate insights into potential outcomes and explore various “what-if” scenarios.
5. Better communication: The ability to effectively communicate insights is crucial for stakeholders. Store performance dashboards improve communication by presenting visually engaging reports that simplify complex data. Some dashboards can create barriers to communication, as static reports might not engage stakeholders effectively or introduce ambiguity. Liveboards seamlessly integrate real-time data into presentations with the Present mode, eliminating the need for manual updates. Note tiles can provide important directions for how to read or use a specific visualization.
1. Sales performance dashboard
A sales performance dashboard is essential for tracking key sales metrics. Retail teams can monitor their performance against sales targets, identify best-selling products, pinpoint high-performing regions, and forecast future sales trends. Whether optimizing sales strategies or allocating resources effectively, this dashboard is vital for driving revenue growth and achieving sales objectives.
Important KPIs to track:
Sales revenue: Tracks total revenue generated from sales activities
Gross margin: Measures the difference between sales revenue and the cost of goods sold, indicating profitability
Average order value (AOV): Calculates the average value of each sales transaction
Sales pipeline status: Provides insights into the stages of the sales process and conversion rates
2. Inventory management dashboard
An inventory management dashboard provides real-time insights into stock levels, order statuses, and inventory turnover rates. These insights help you optimize stock levels, reduce holding costs, and avoid stockouts or overstock situations.
Important KPIs to track:
Stock levels: Monitors the quantity of products in inventory
Inventory turnover: Measures how often inventory is sold and replaced
Stockout rate: Tracks the frequency of stockouts
Order fulfillment rate: Measures the percentage of orders fulfilled on time
Success story: By leveraging business intelligence tools during the pandemic, Canadian Tire successfully managed inventory despite store closures, achieving notable sales growth through informed decision-making.
3. Customer experience dashboard
A customer experience dashboard tracks metrics related to customer satisfaction, feedback, and behavior. You can use this dashboard to improve customer service, enhance shopping experiences, and boost customer retention rates.
Important KPIs to track:
Customer satisfaction score (CSAT): Evaluates customer satisfaction levels through feedback
Net promoter score (NPS): Measures customer loyalty and likelihood to recommend
Customer feedback: Analyzes customer comments and reviews
Customer retention rate: Tracks the percentage of returning customers
Neobank Northmill utilized customer segmentation to personalize banking experiences, resulting in a 30% increase in conversions.
“What moves the needle is turning insight into actions. To run a business, the ability to produce nice graphs and monitor interesting data is not even half the story—it's what you do with it that's important.”

4. Employee performance dashboard
An employee performance dashboard monitors key metrics related to staff performance and productivity. You can use this dashboard to identify top performers, address training needs, and optimize workforce management.
Important KPIs to track:
Sales per employee: Measures the revenue generated per employee
Customer service ratings: Evaluates employee performance based on customer feedback
Attendance and punctuality: Tracks employee attendance and on-time performance
Training and development: Monitors the completion of training programs and skill development
5. Financial performance dashboard
A financial performance dashboard provides an overview of a store's financial health. You can monitor profitability, manage expenses, and ensure financial sustainability with this dashboard.
Important KPIs to track:
Gross profit margin: Evaluates the profitability of goods sold
Operating expenses: Tracks the ongoing costs of running the store
Net profit: Measures total earnings after deducting all expenses
Cost of goods sold (COGS): Represents the direct costs attributable to the production of goods sold
Modern Restaurant Concepts implemented ThoughtSpot’s financial dashboards to empower general managers nationwide with instant access to sales and labor data. Liveboards facilitated prompt analysis, streamlined budget allocation, and drove clear goal alignment for growth initiatives.
Navigating vast amounts of retail data can be daunting, but it doesn’t have to be. ThoughtSpot empowers organizations to harness the full potential of store performance dashboards with intuitive tools that simplify data analysis. Designed for ease of use, ThoughtSpot's user-friendly interface allows you to effortlessly explore retail data through natural language search, eliminating the need for specialized training or technical expertise.
Here are some ways Liveboards deliver distinct value:
Verified dashboards establish data governance and maintain quality standards throughout your organization.
Liveboards offer speed and scale on complex data models to ensure rapid insights and analysis.
Real-time KPI monitoring via ThoughtSpot Monitor, you can stay updated on key metrics as they happen.
Data on-the-go enables real-time data tracking on your mobile devices, empowering you to make data-driven decisions anywhere and anytime.
💡Optimize your Liveboard for success—understand why "Context is Gold" when designing your store performance insights.
In a landscape where data accuracy and timeliness are paramount, ThoughtSpot's intuitive interface and powerful analytics capabilities set a new standard. Embrace the future of data-driven decision-making with ThoughtSpot—take a product tour today.


