


Given the ever-increasing volume and variety of data available today, businesses need to find better ways to make sense of it all. Data visualization is one way to do that. By visually representing data in graphs and charts, businesses can gain a deeper understanding of what’s happening within their data sets. This can lead to better insights and more informed decision making. Check out the top seven benefits of data visualization below:
1. Accessibility of data
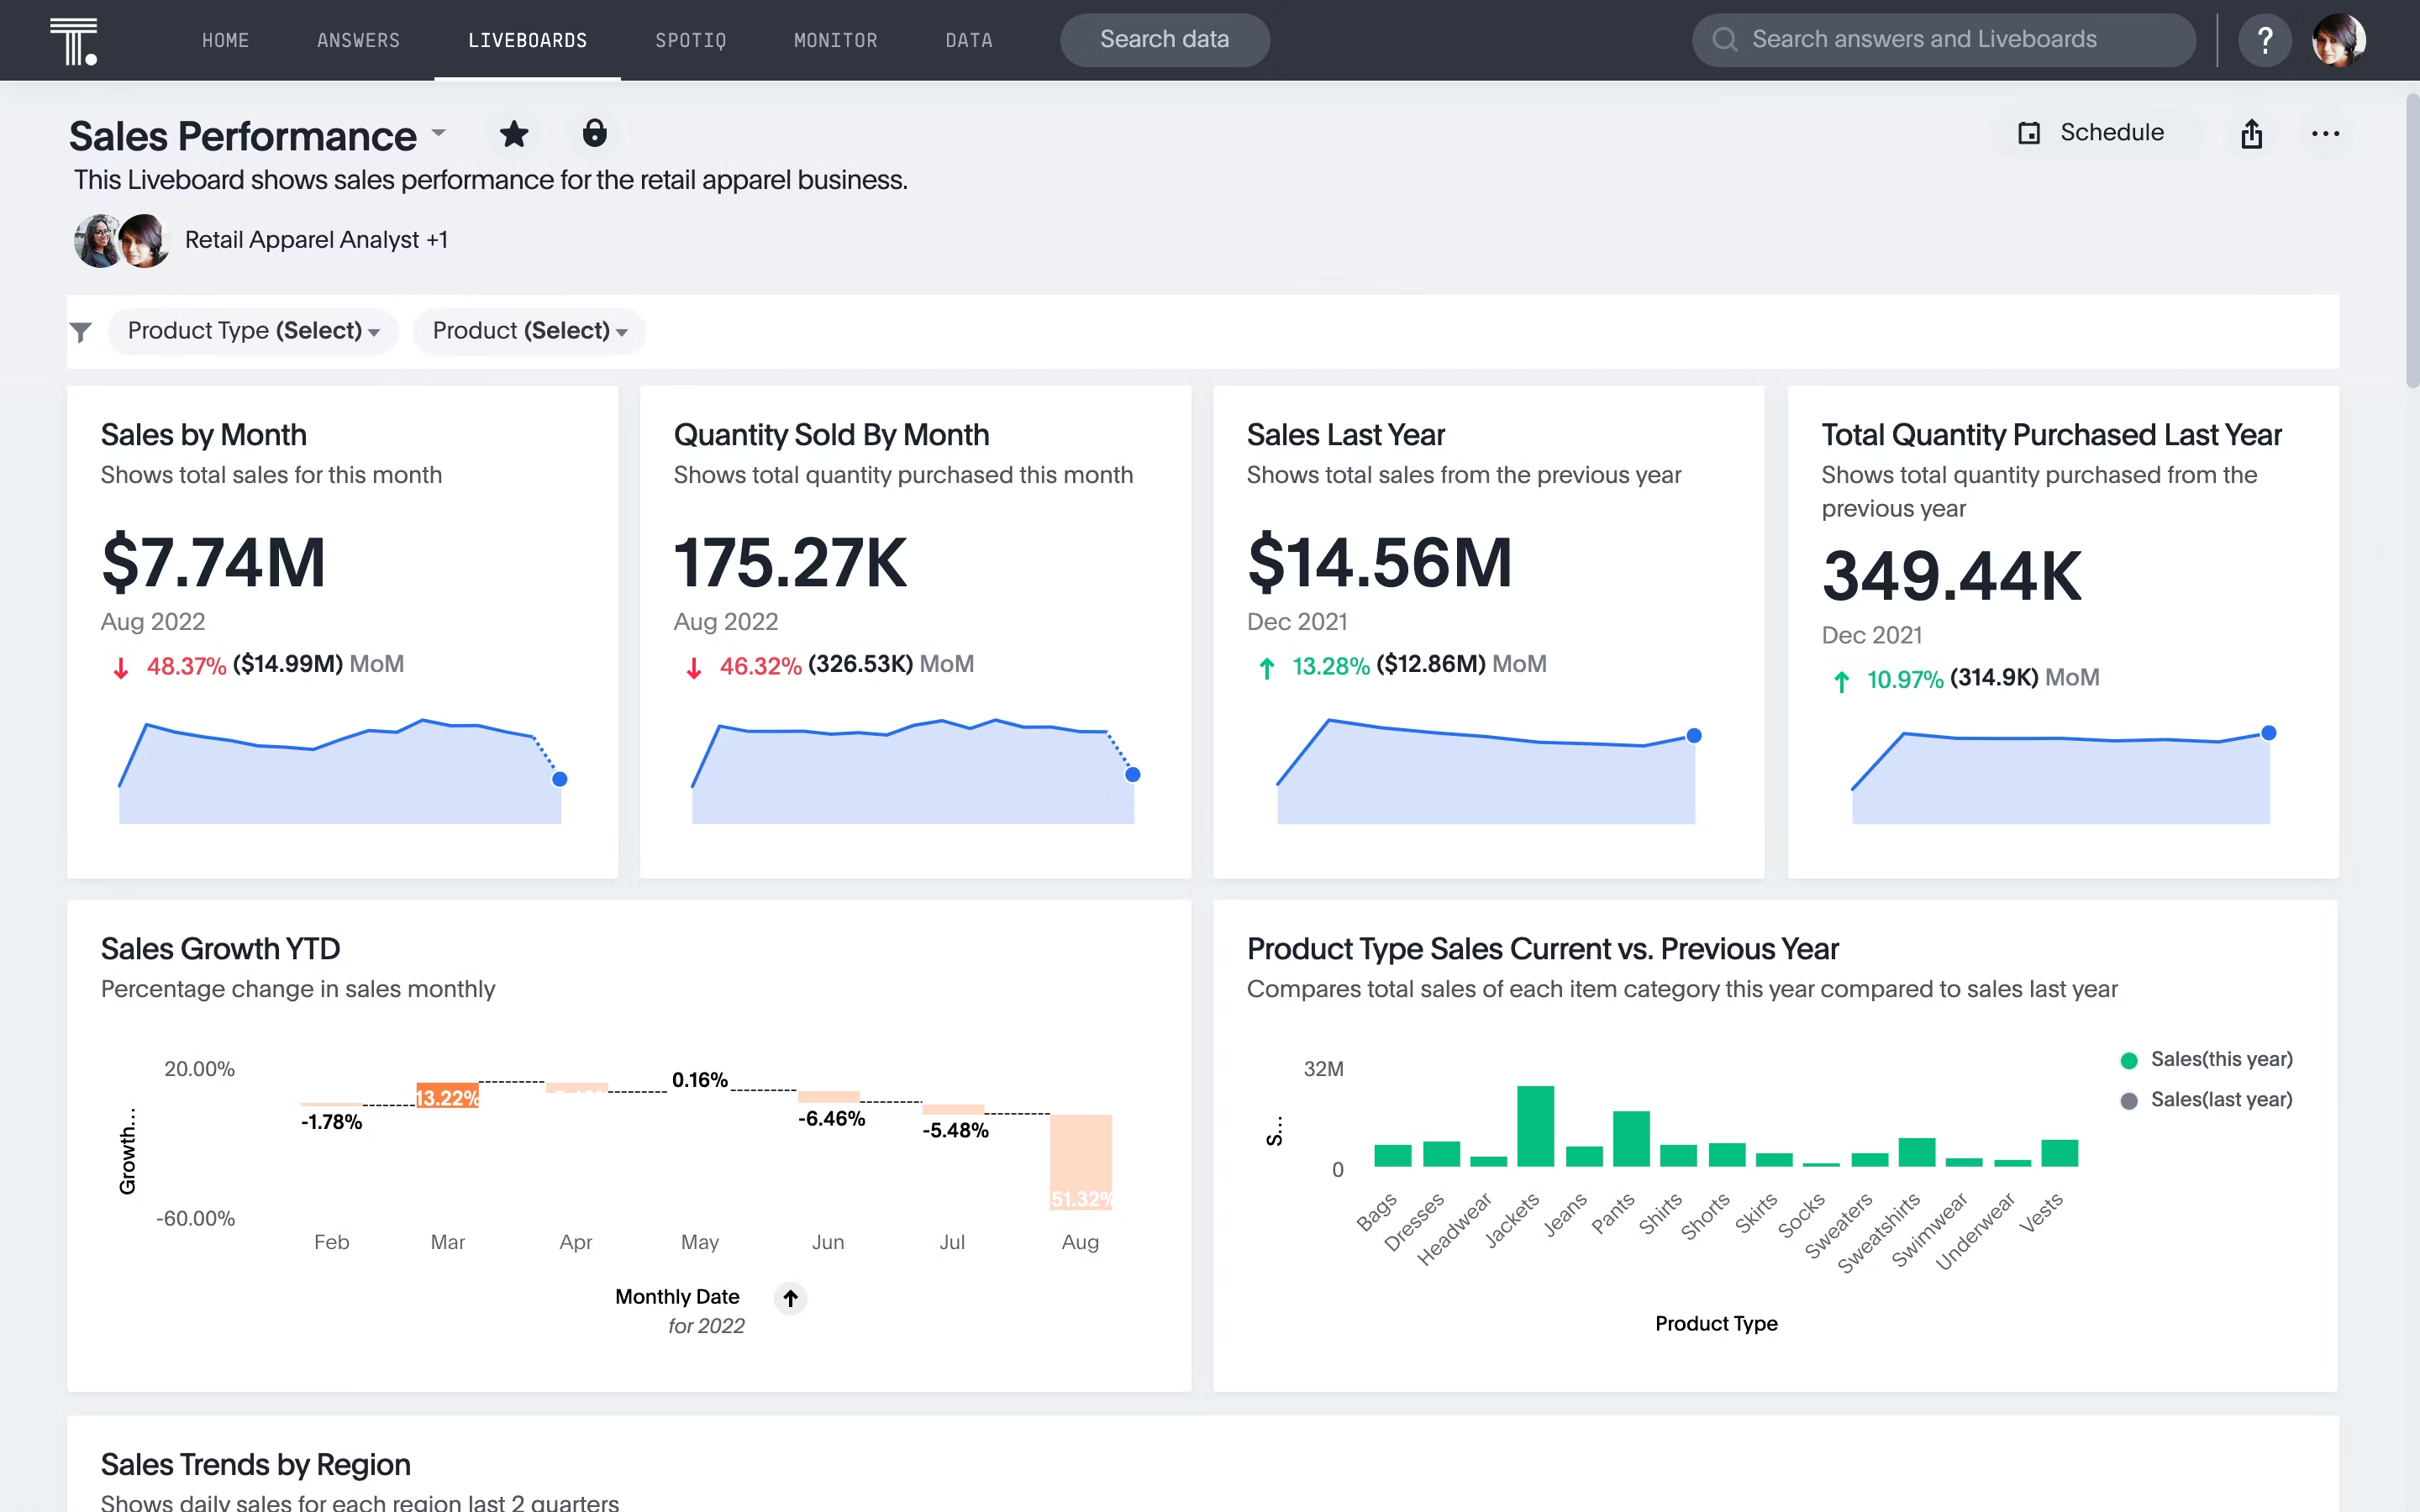
Data visualizations make data insights more accessible to a wider audience. Not everyone has the skill or interest required to dig deep into the numbers and pull out relevant trends, but anyone can look at a chart or graph and understand how different elements compare, or contrast, giving them an instant understanding of what the visualization seeks to convey.
2. Determine what's significant
The more data you have access to, the harder it can be to find the most significant insights. Rigorous statistical analyses can spit out the answers, but that requires knowing exactly what question to ask — and a statistician, data analyst, or data scientist. Data visualizations, on the other hand, can help leaders and nontechnical business people determine what information is significant at a glance, so they can quickly identify areas requiring further evaluation or action.
Start Getting Better Insights
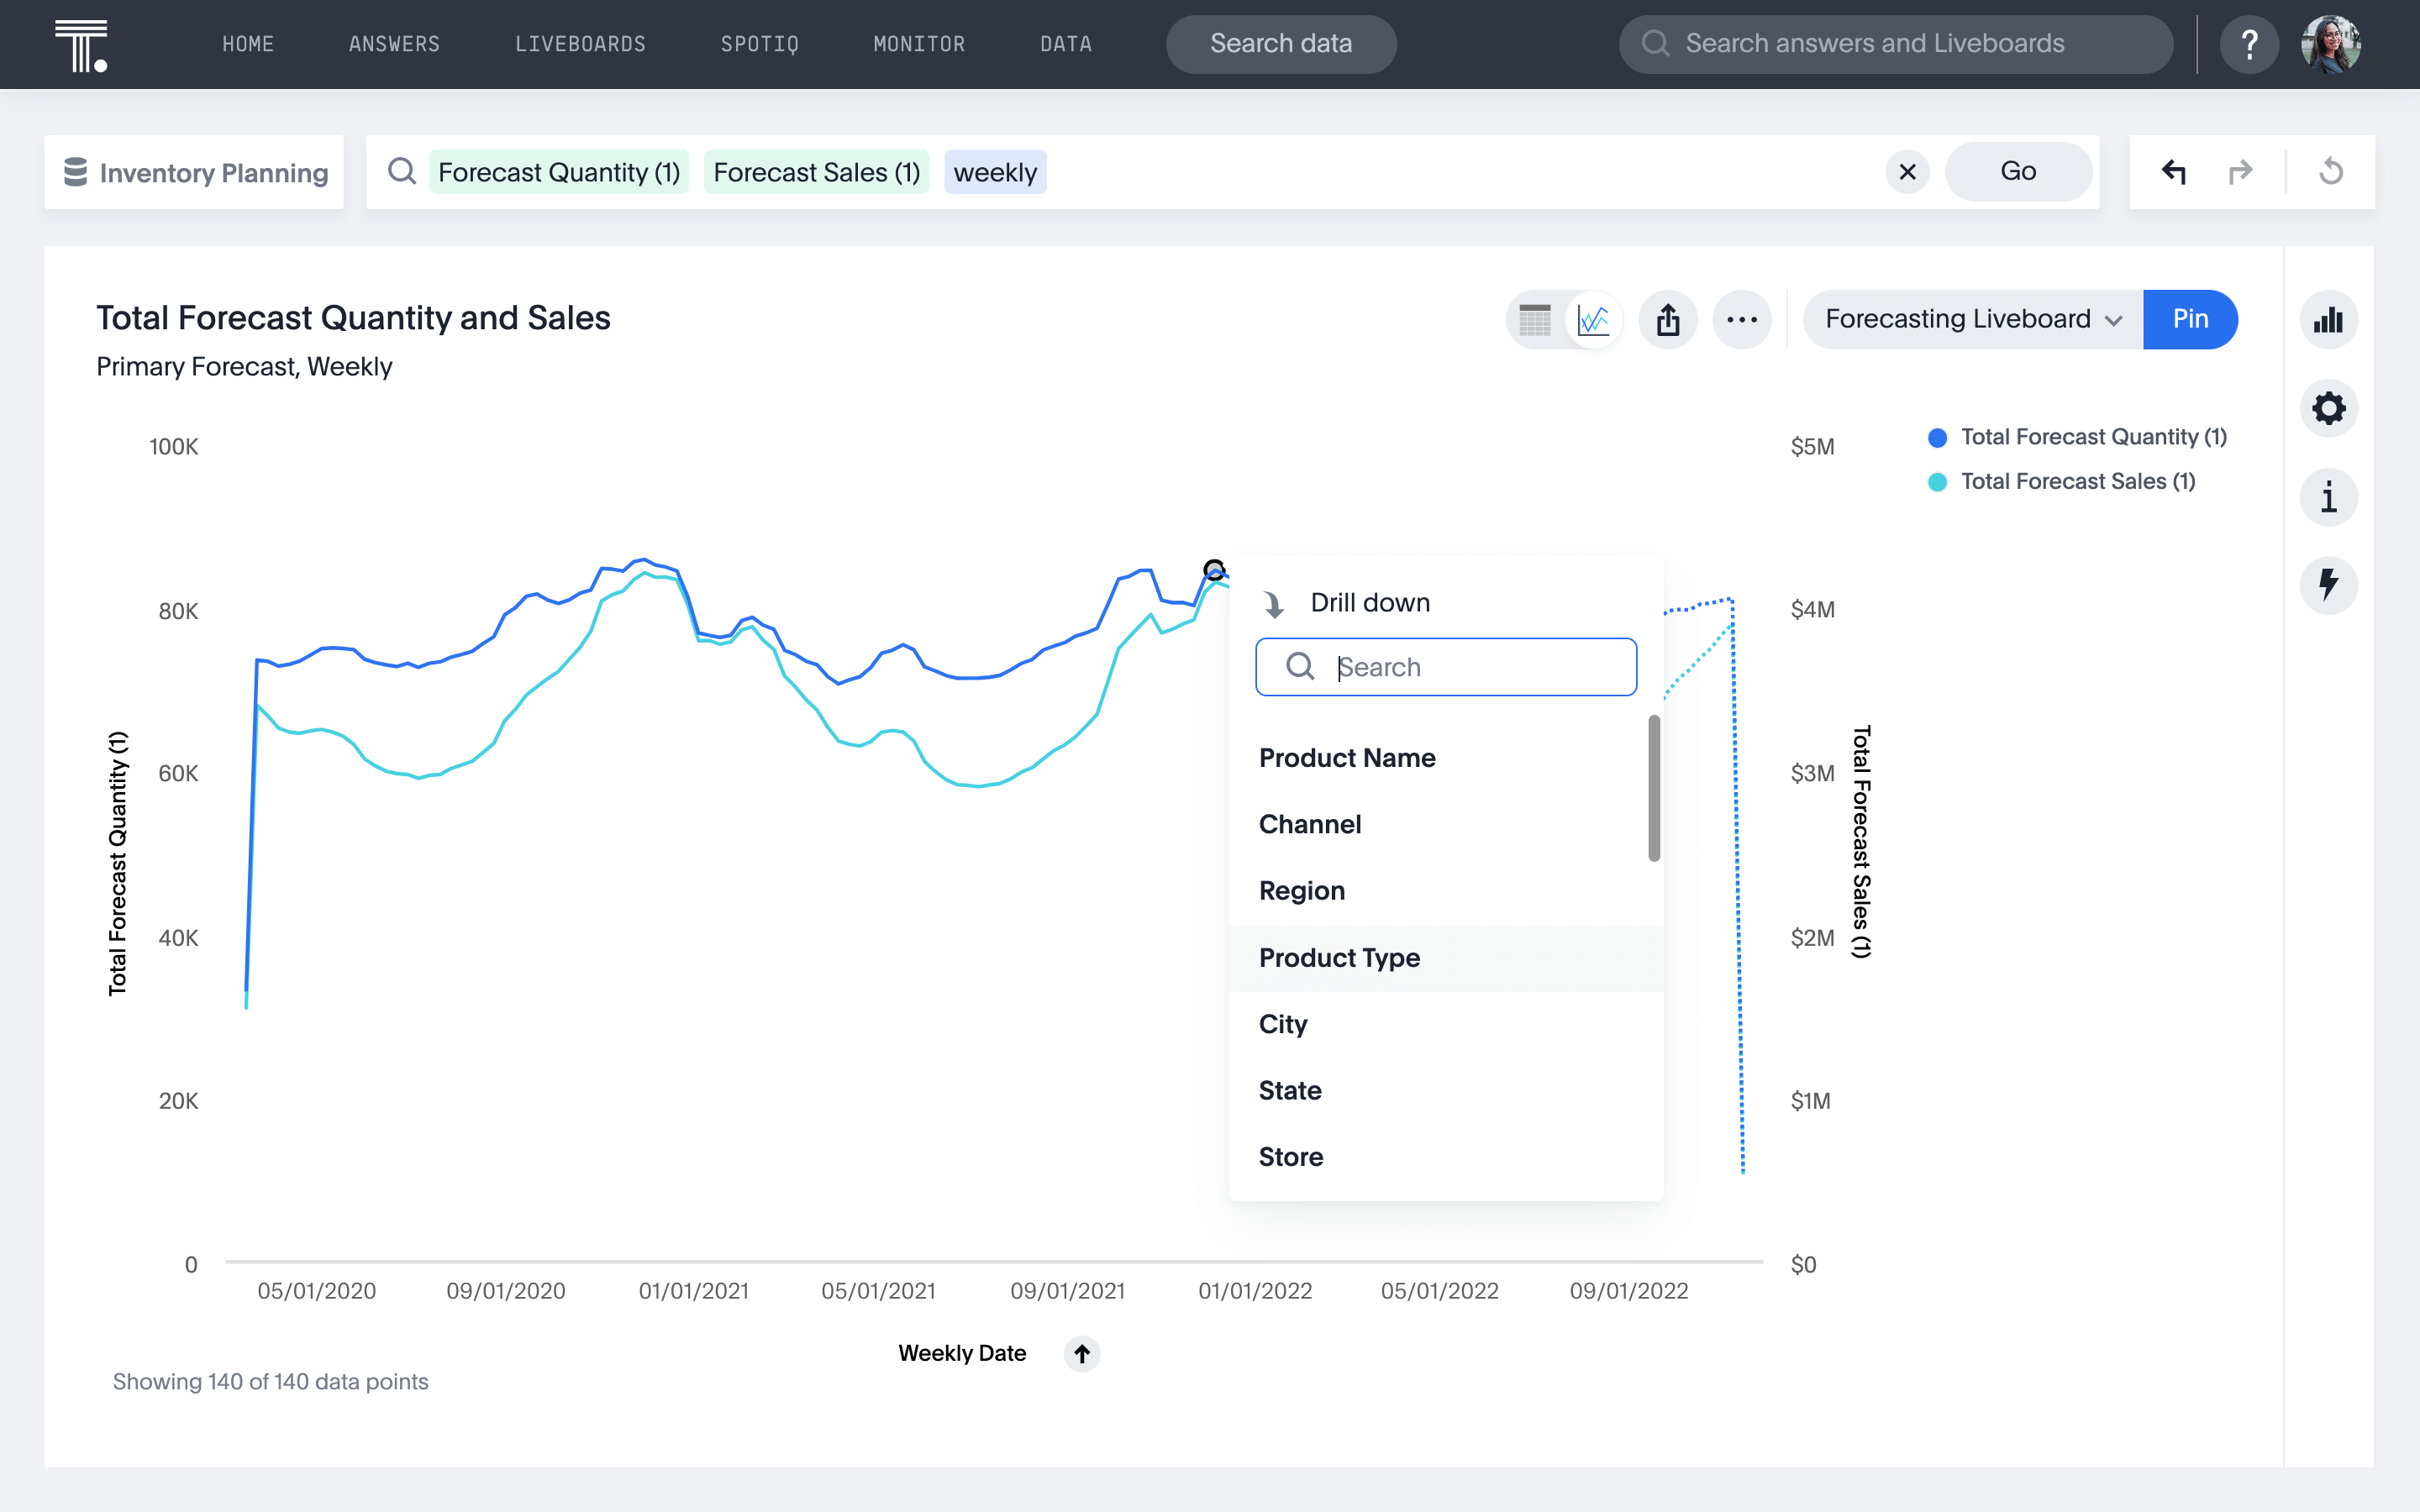
3. Create an interactive experience
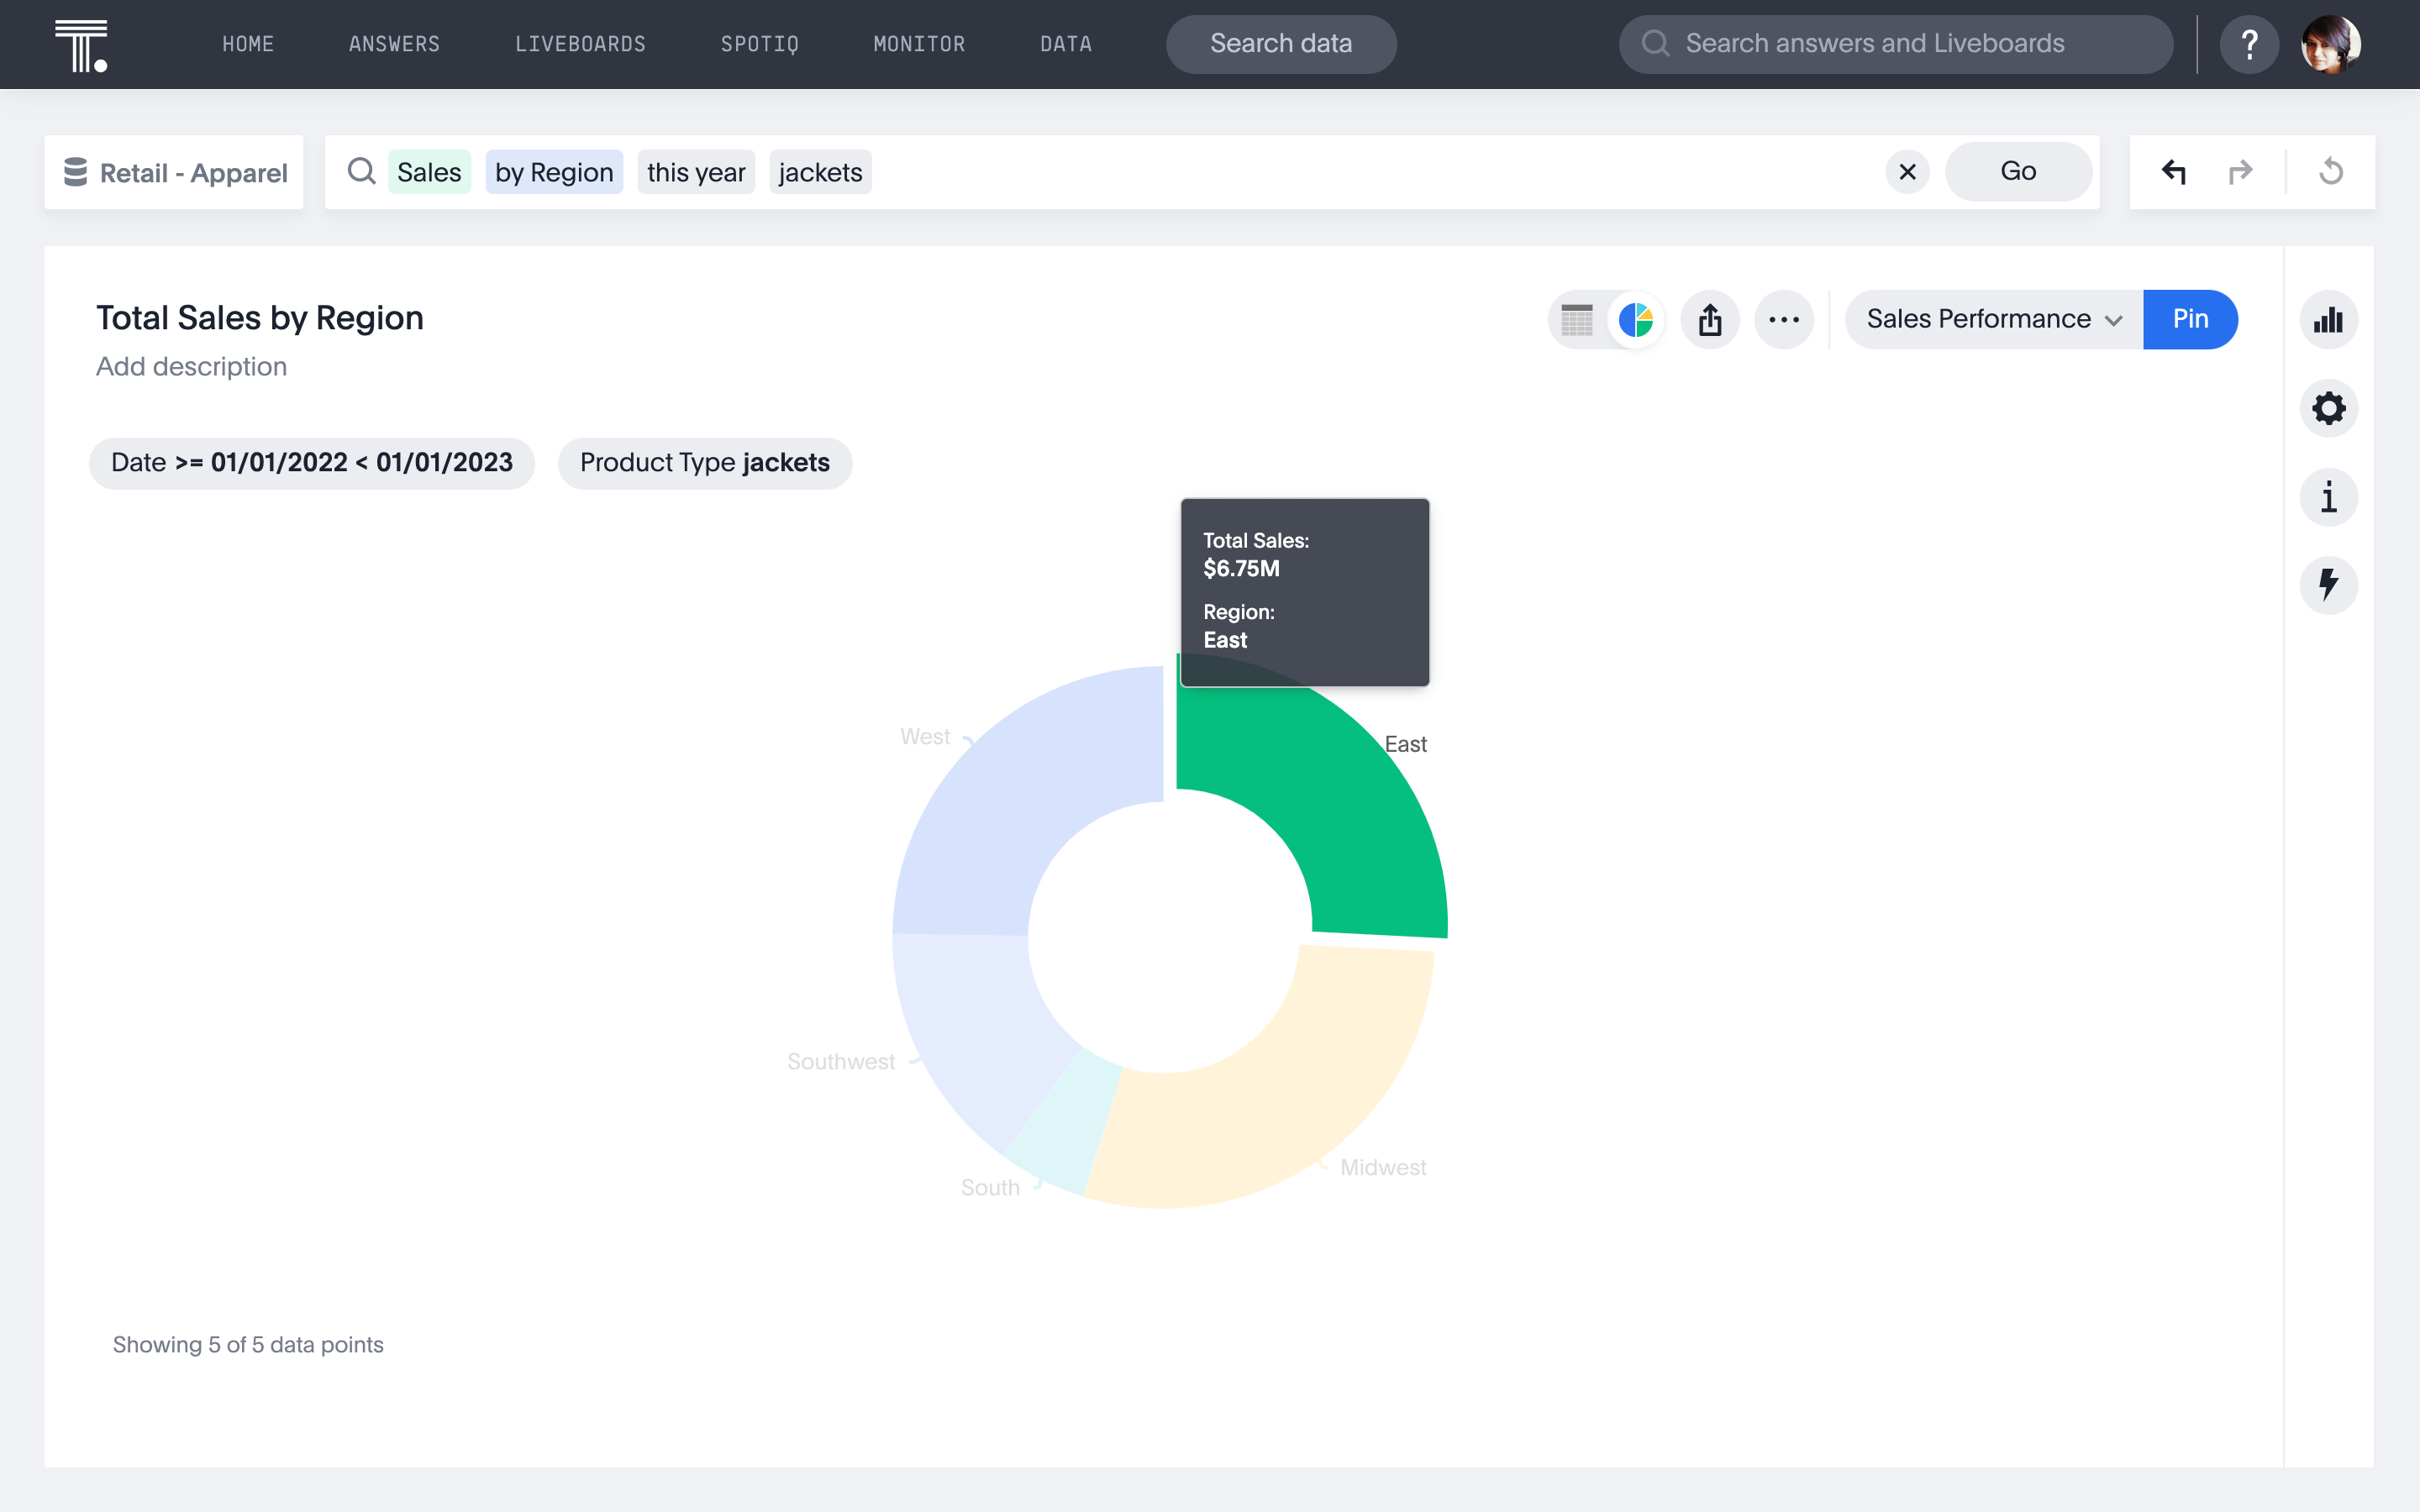
The earliest data visualizations were, essentially, really cool maps and graphs. Today, modern data visualization tools take these static creations to the next level, allowing users to get an even better understanding of their data. Visualizations might come as an interactive chart that lets you drill down into interesting insights. And with embedded interactive analytics experiences, users can dive into the data and create visualizations on their own right within existing tools or apps — no coding skills required.
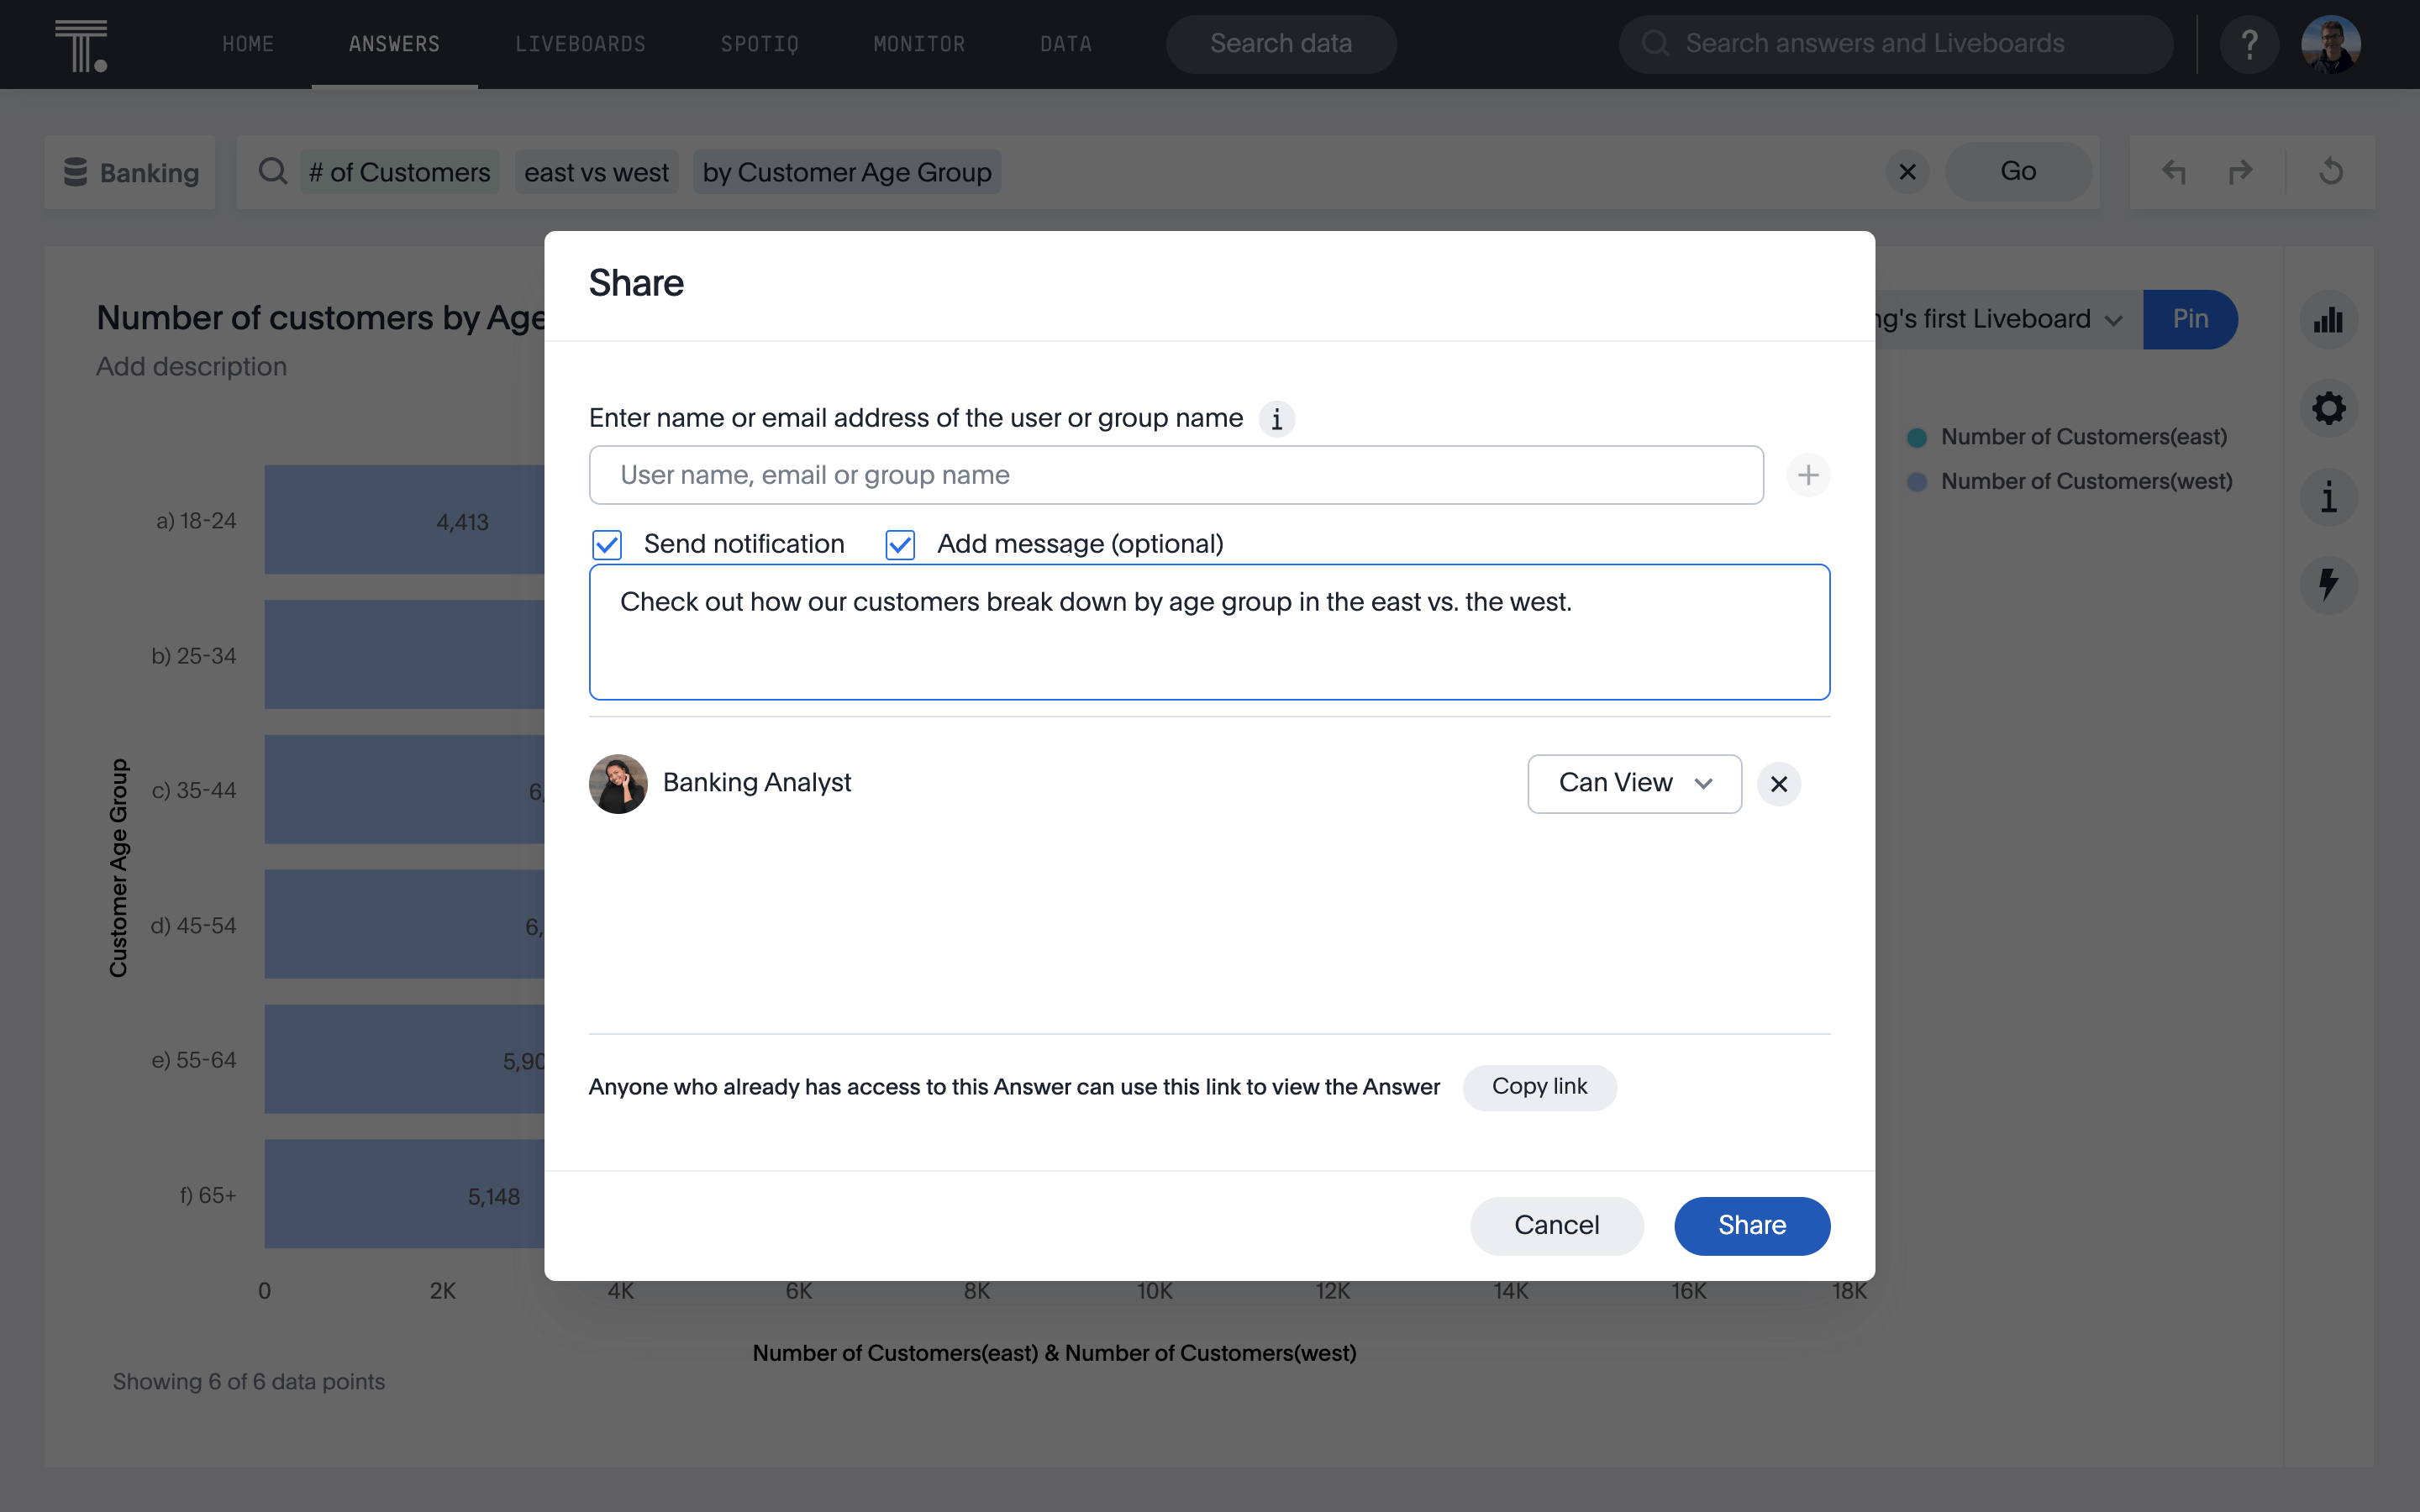
4. Share data and its story with others
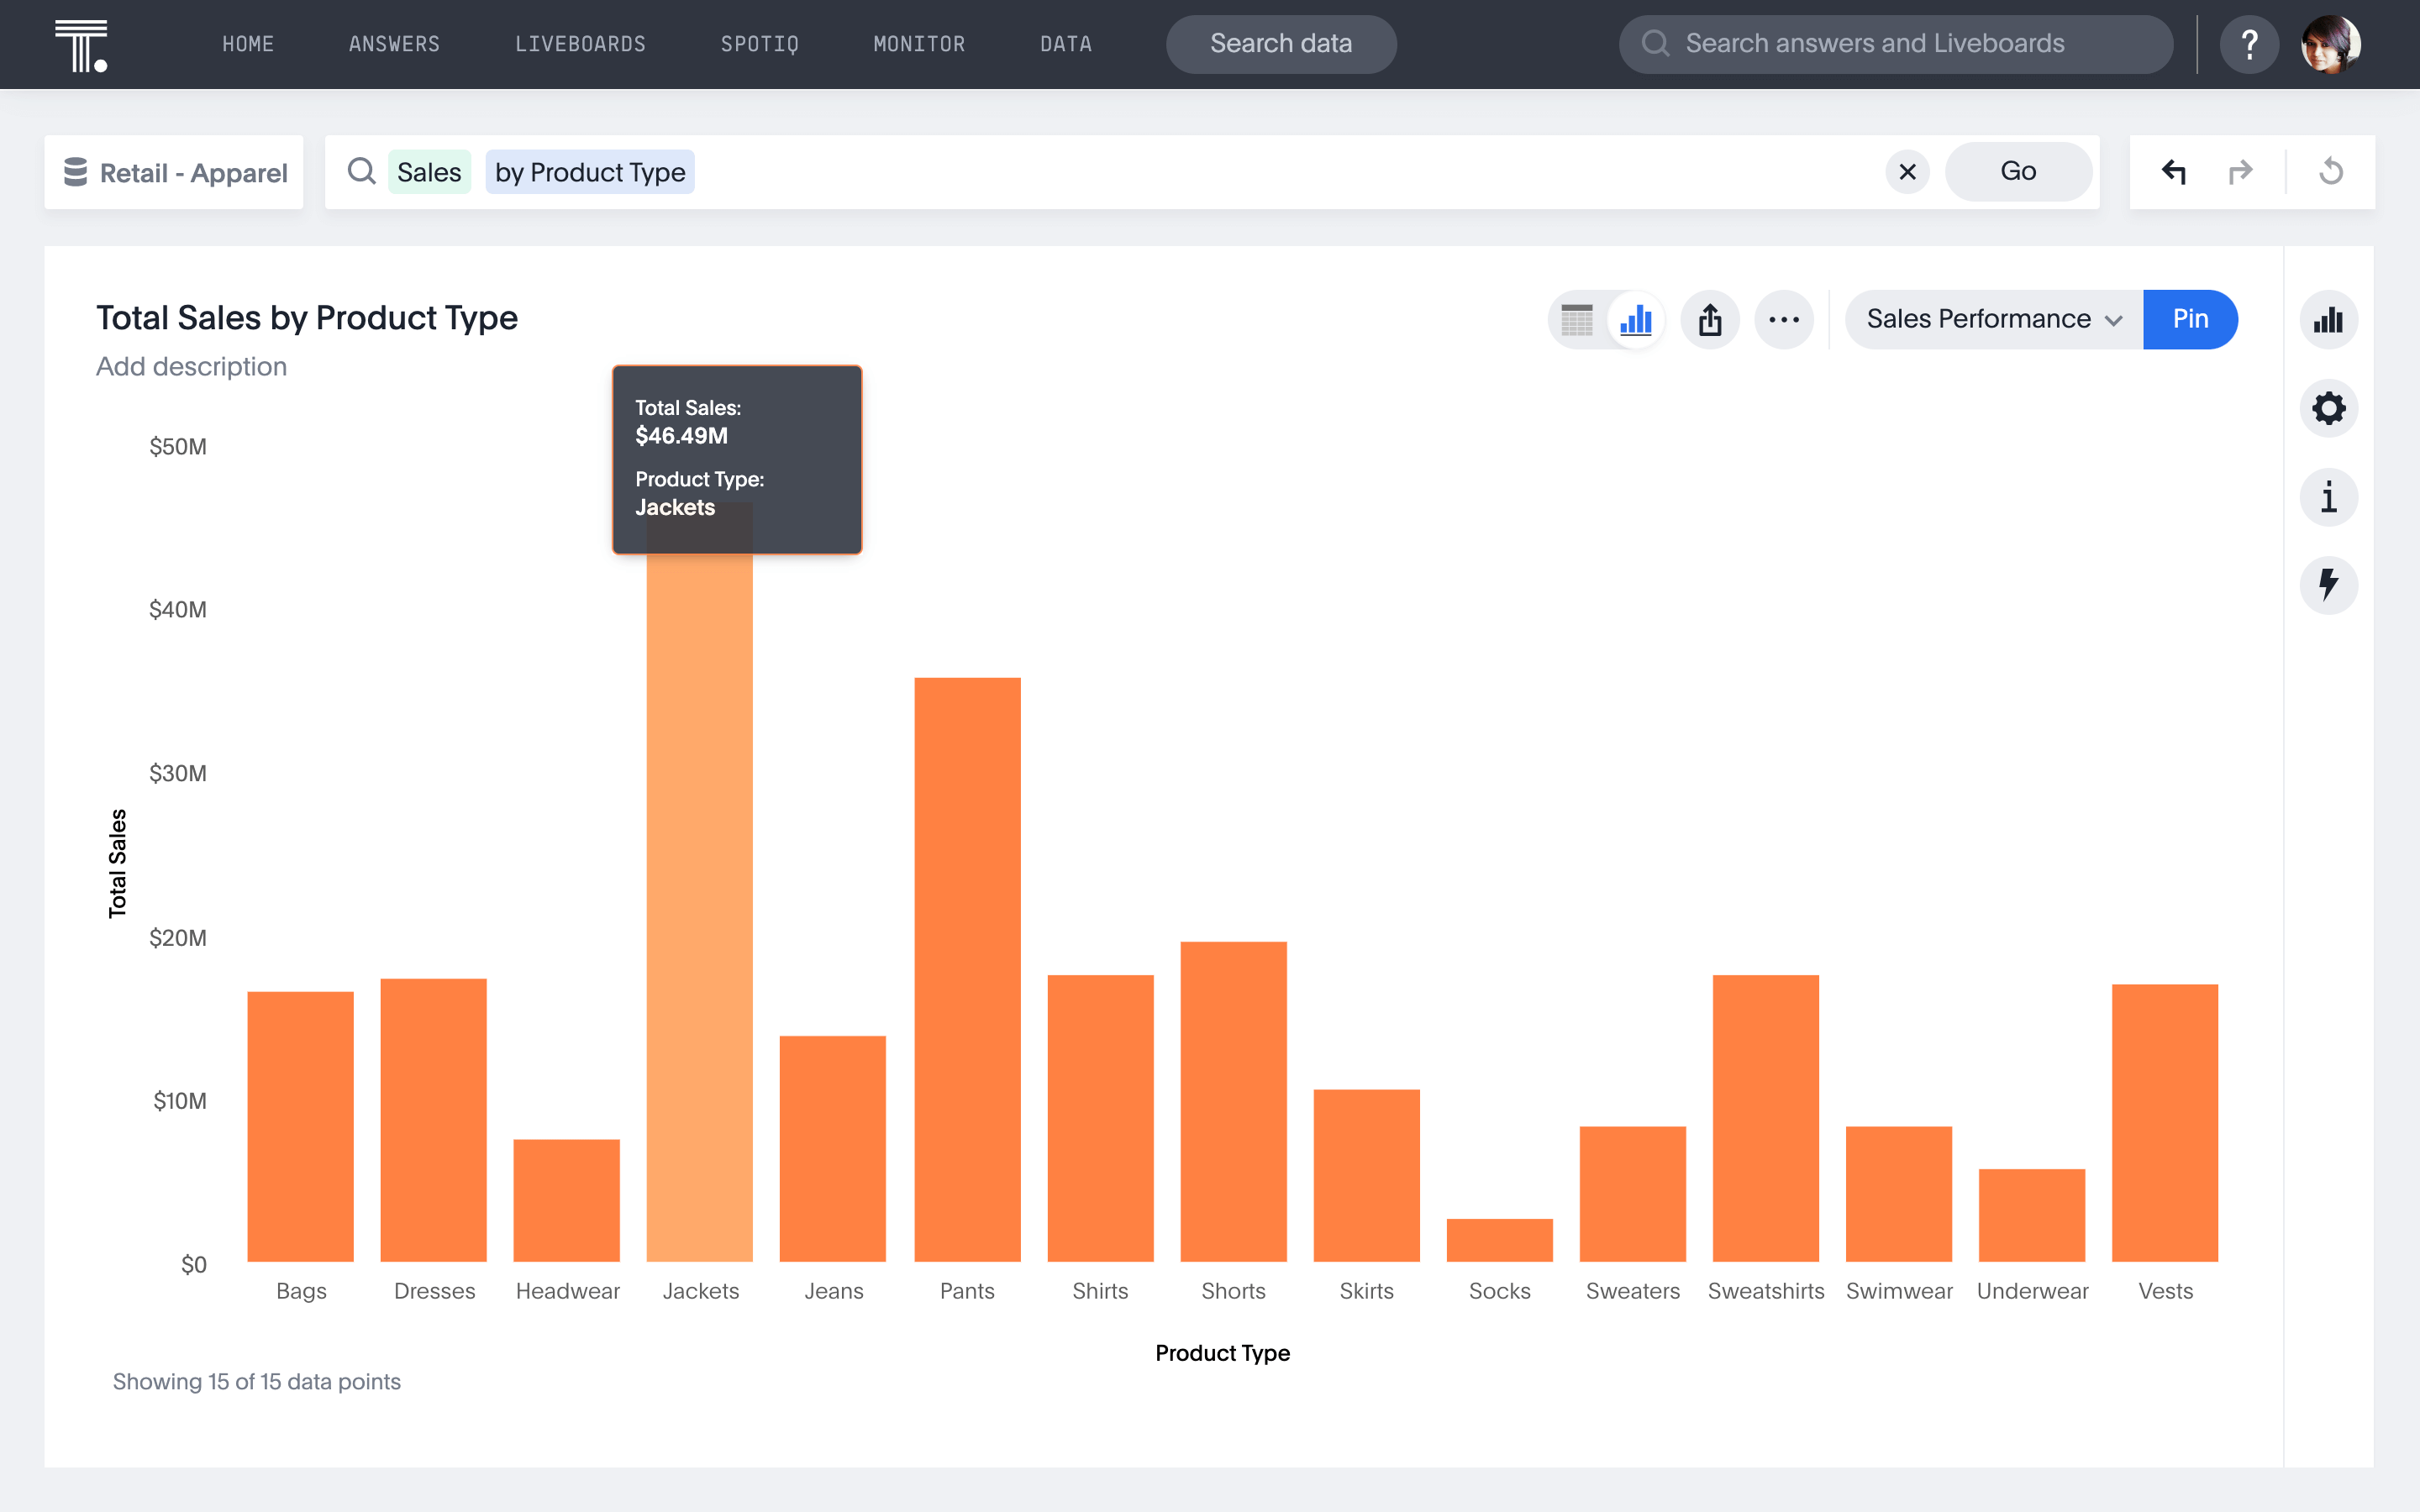
Not everyone knows their way around a table of raw data. Luckily, visualizations make it easy to present data insights to any audience. Even when raw data reveals important information like a key performance indicator, visualizing that same information in context tells a broader story that everyone can comprehend.
5. Understand the big picture
Data visualizations give context to your numbers. They can reveal patterns in complex data that would otherwise be hard to understand, and allow you and your audience a better grasp of the insights and knowledge of the big picture.

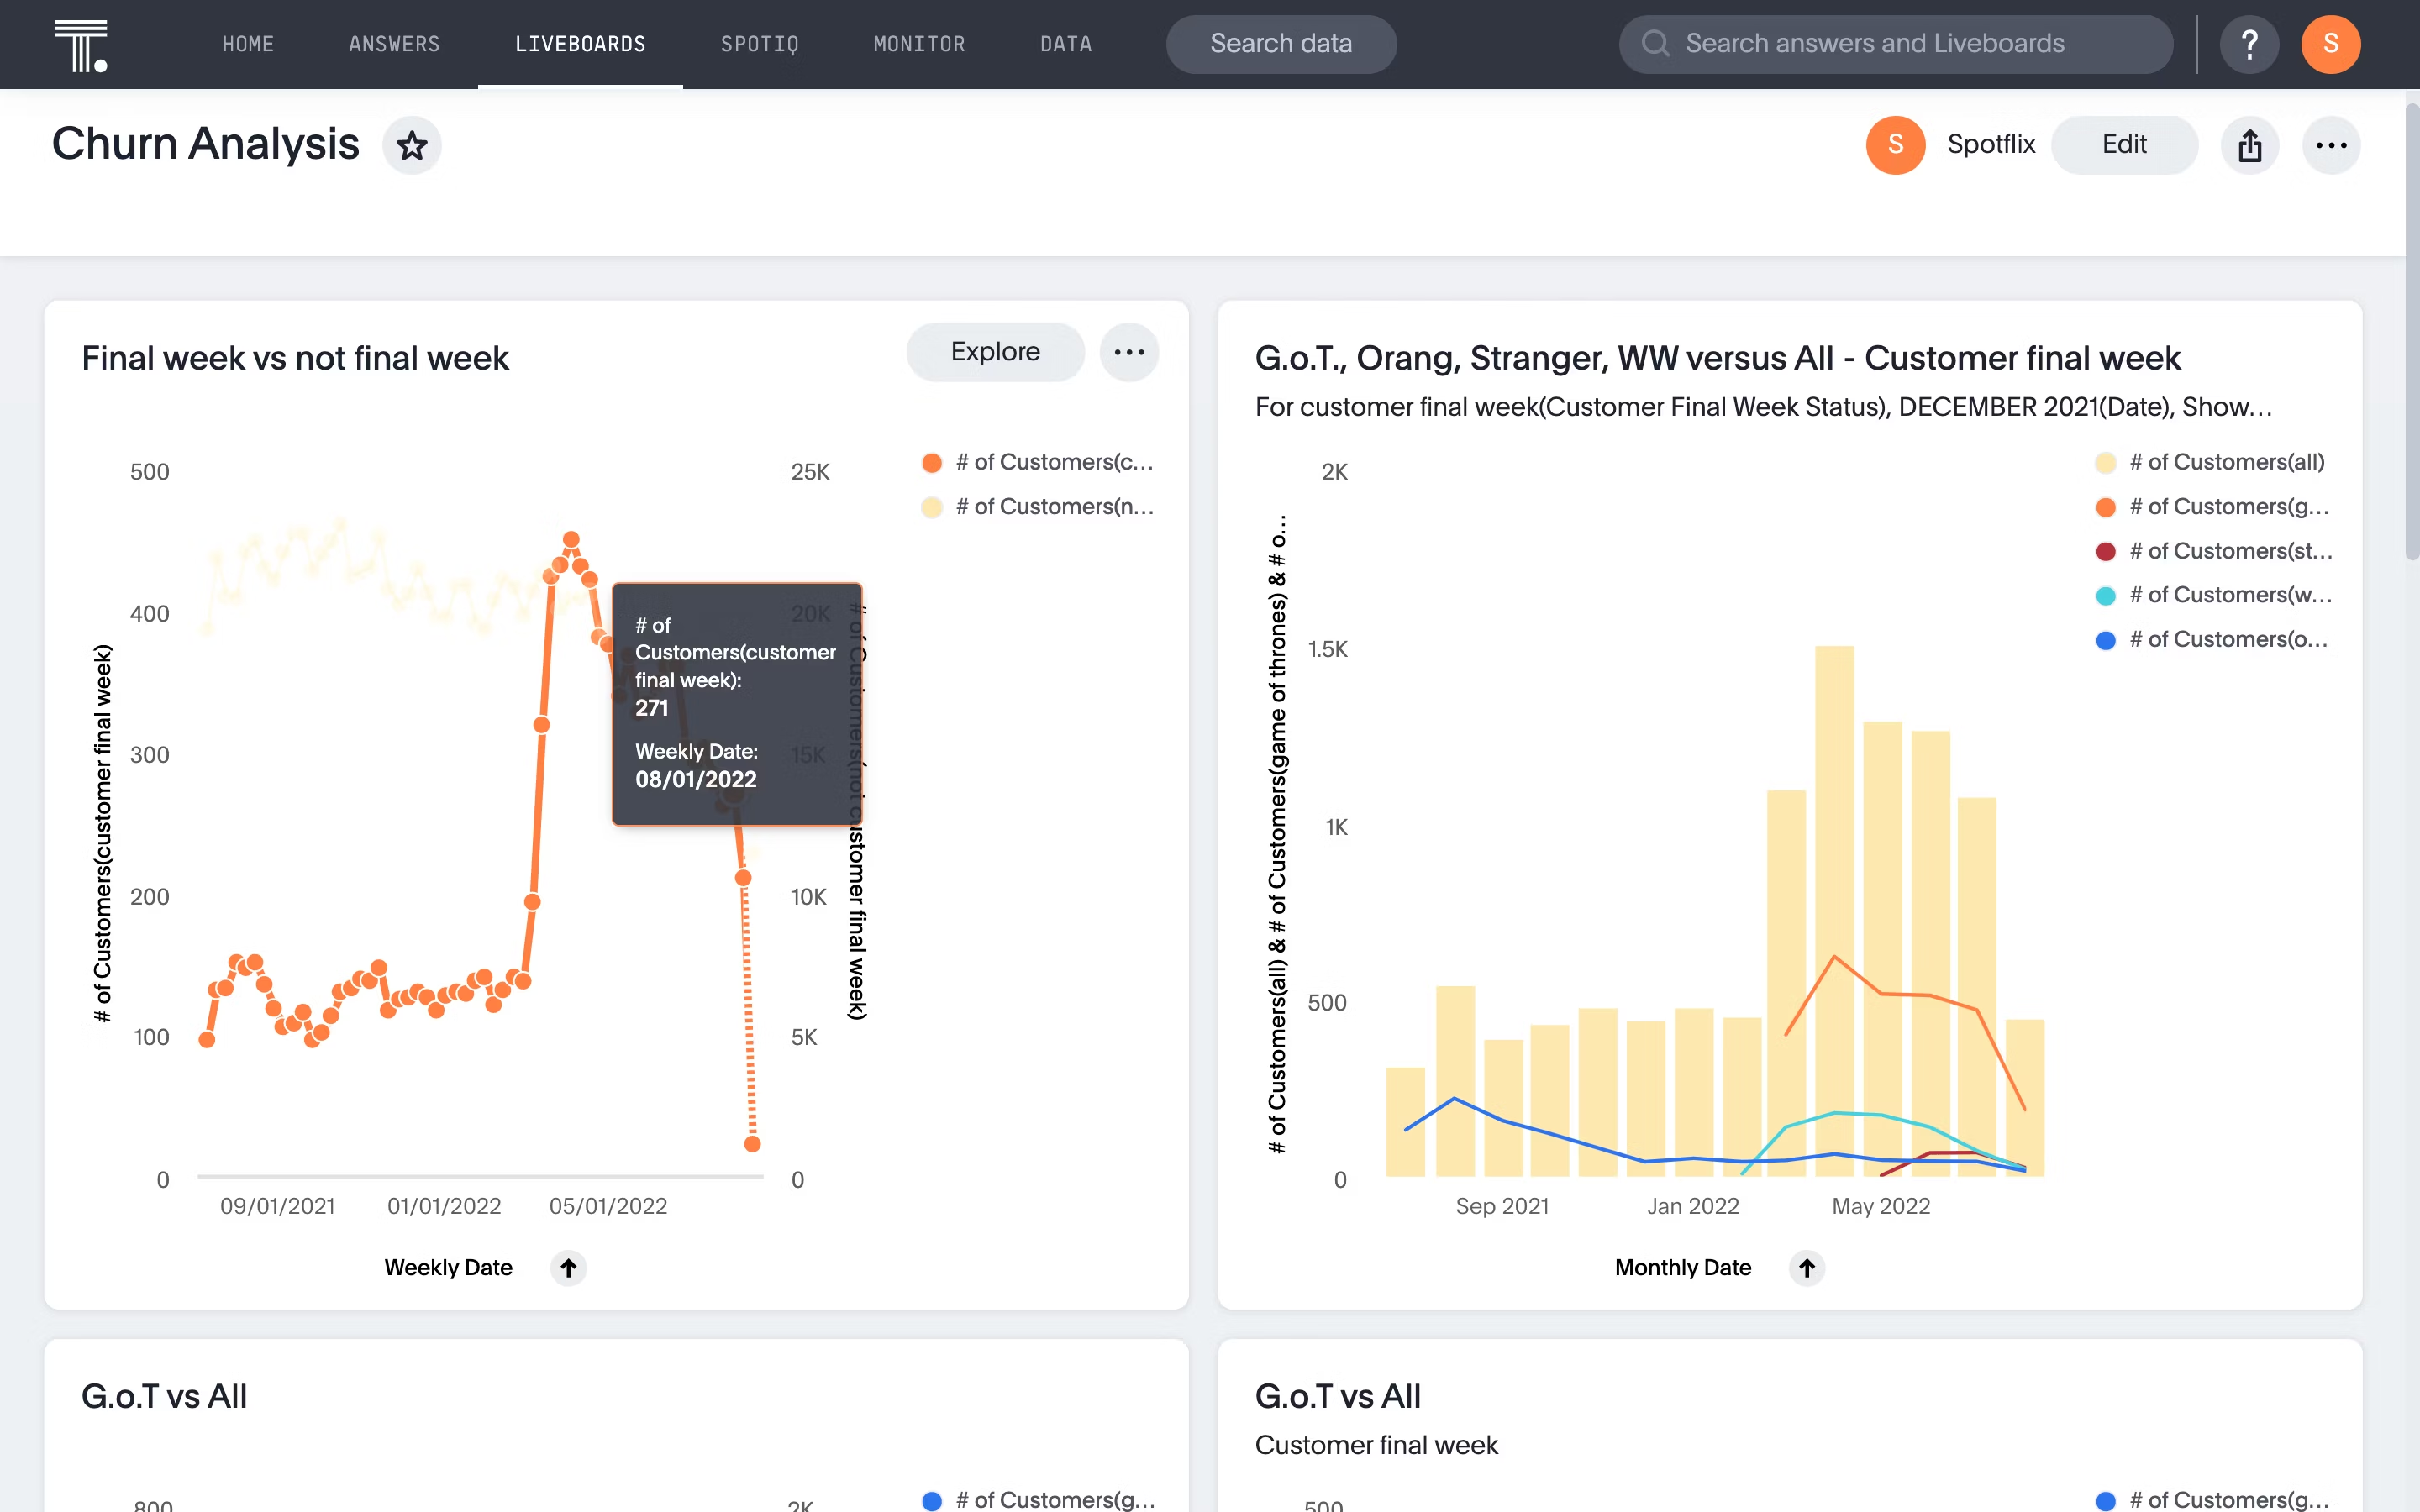
6. Identify emerging trends
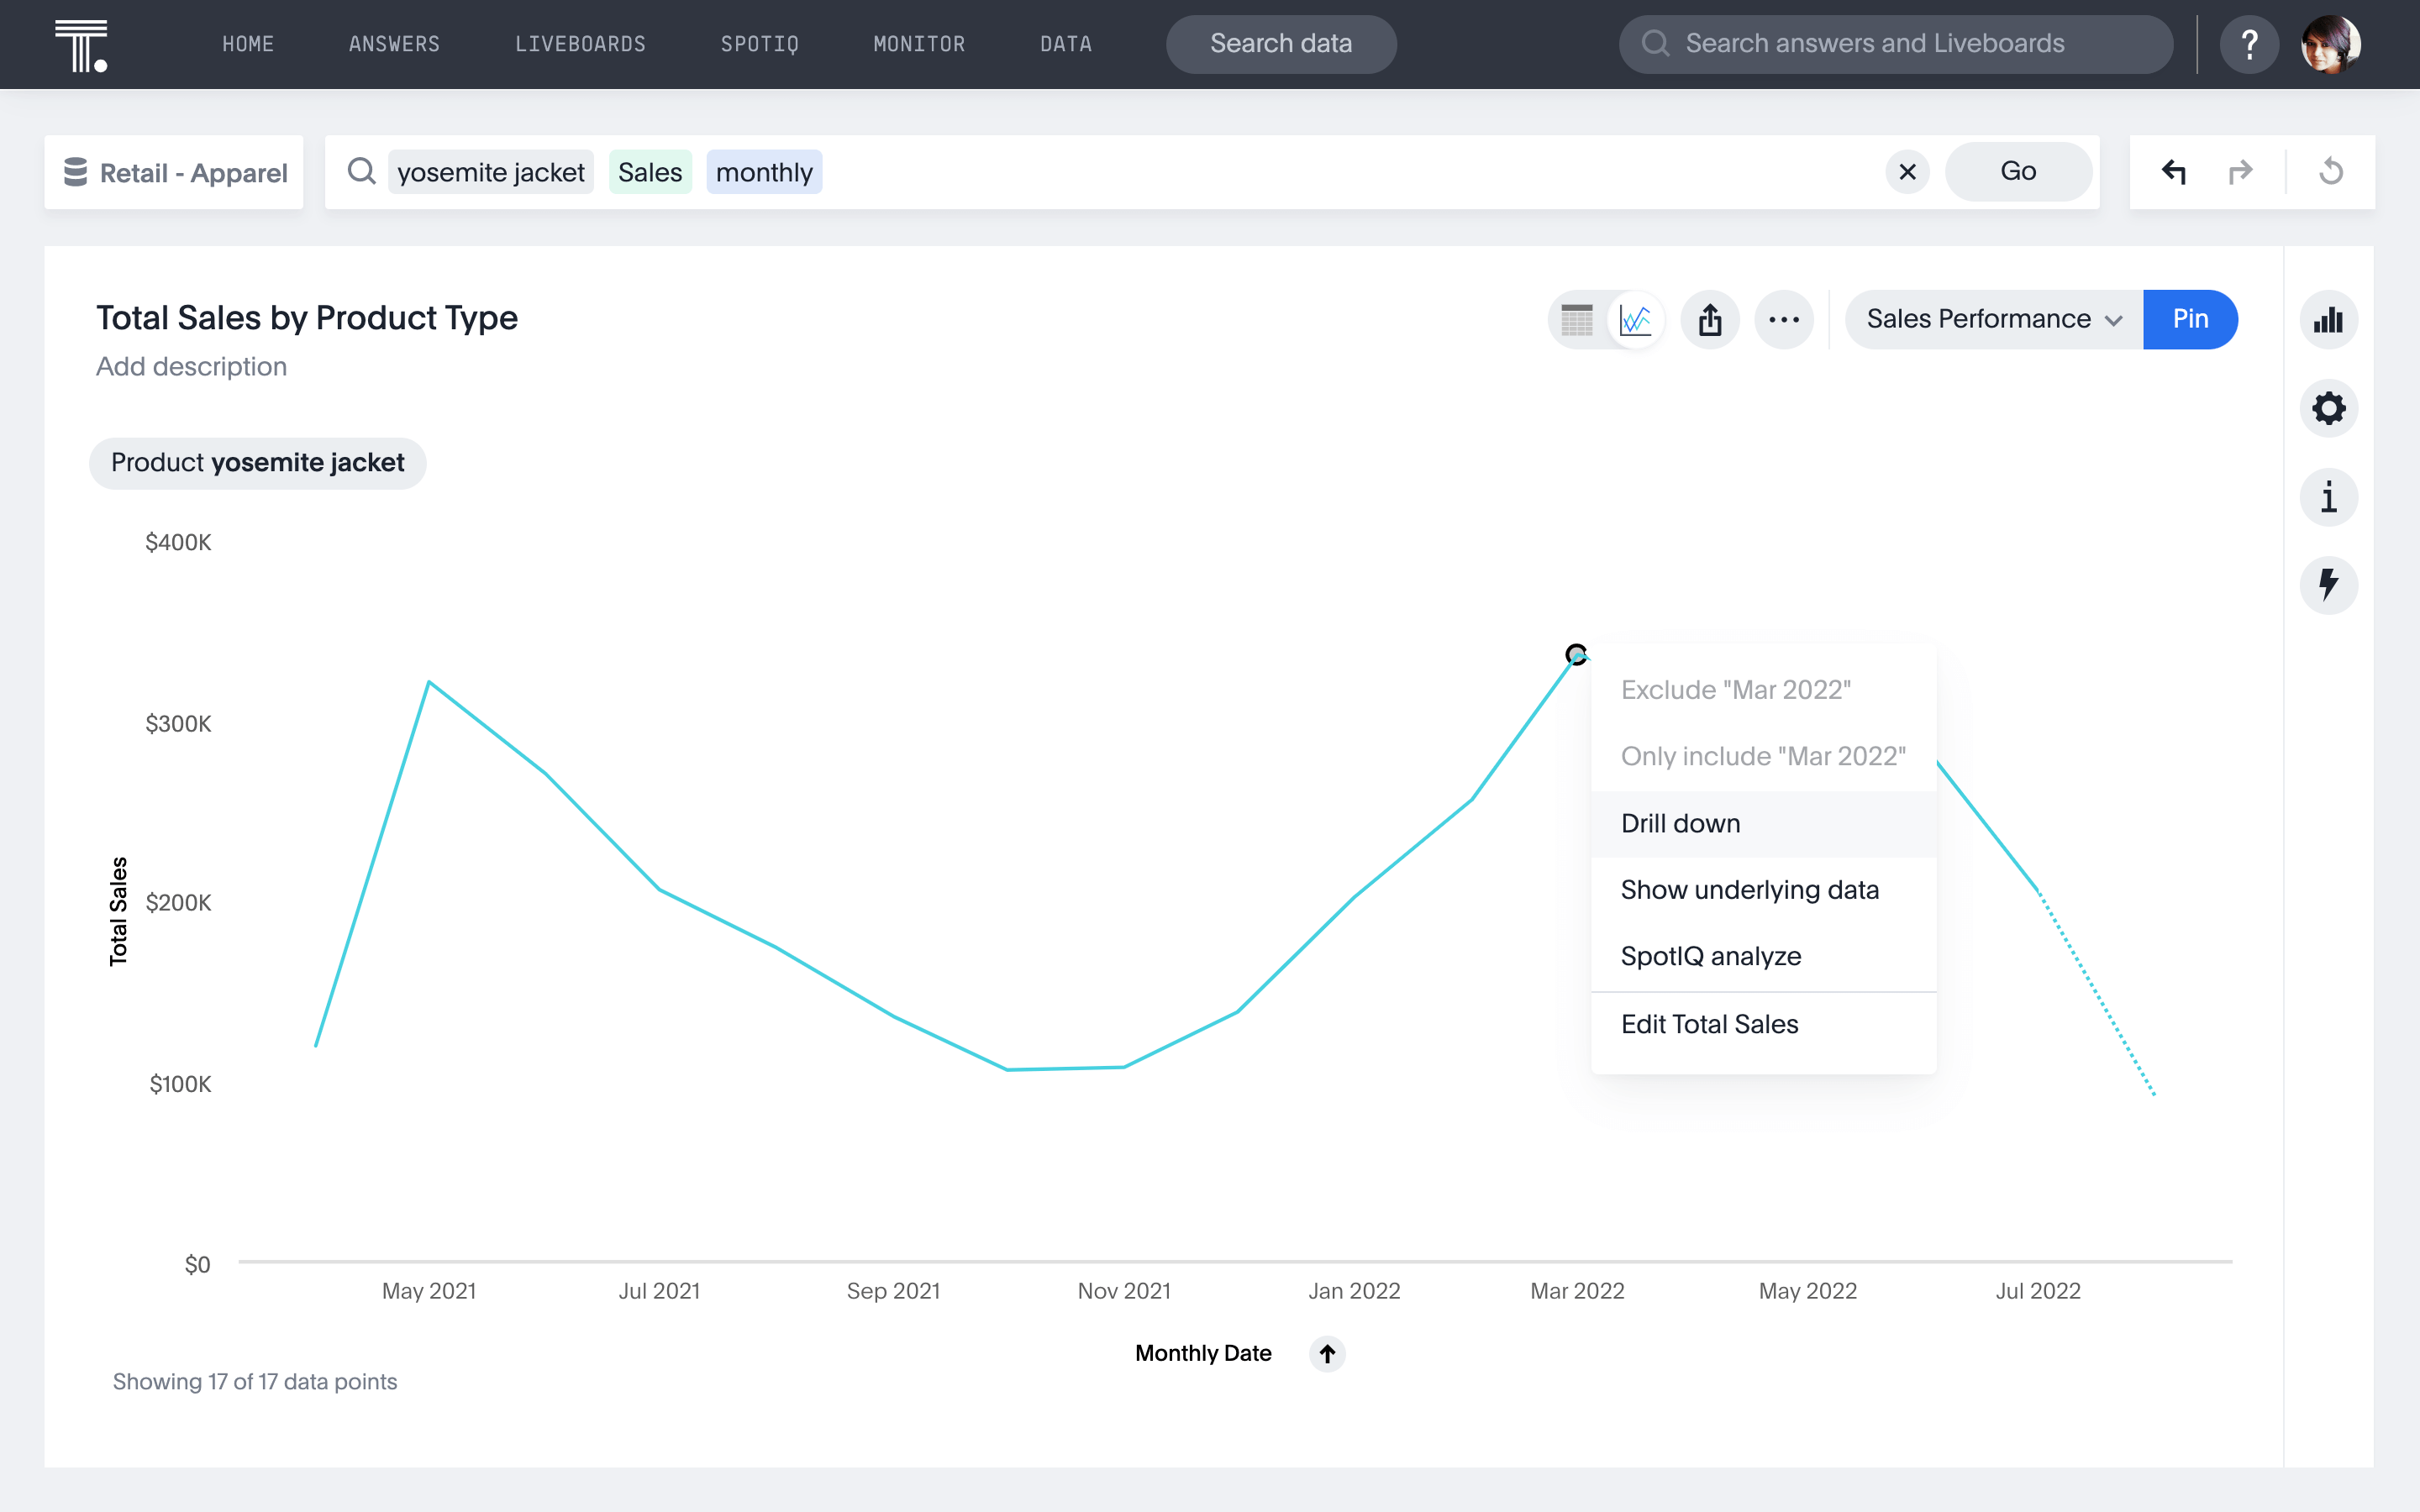
Using data visualizations to identify emerging trends might be one of its most classic uses. For instance, when data is plotted over time, it’s simple to see what’s going up and what’s going down, how often numbers are fluctuating, and where the peaks and valleys are. You might get a better sense of growth, identify lulls that need attention, or find spikes in KPIs that deserve a closer look.
7. Get ahead of blockers and bottlenecks
A blocker is anything that derails or delays your efforts. Data visualizations can help identify blockers, like bottlenecks, before they happen. For instance, you might find that production numbers are high up until a certain point in the process, which helps to identify what the specific bottleneck is in order to correct it.
All of these benefits are just the beginning. With ThoughtSpot, you can get all of the benefits of data visualization and so much more. Start your free trial today to see how easy it is to get started. With ThoughtSpot, you can easily find and share insights with others in your organization in a way that makes them easy to understand. You'll be able to identify trends before they become blockers or bottlenecks for your business operations. Get ahead of the competition by understanding what's going on in your business now and what could happen in the future--with data visualization from ThoughtSpot.


