


In an e-commerce landscape marked by evolving consumer behavior and shifting market trends, online retailers are asked to do a lot at once. From driving sales and creating hyper-personalized campaigns to optimizing inventories and minimizing supply-chain disruptions, the pressure is on. As if that wasn’t challenging enough, it’s hard to measure success or failure when e-commerce key performance indicators (KPIs) are evolving almost as quickly as e-commerce itself.
To keep up with the growing demand, online retailers are turning to interactive dashboards, or as we call them, Liveboards, to track real-time KPIs. But with so many metrics and data points to track, how can you know which ones to focus on?
Here, we’ve prepared a list of the top metrics that should be on your e-commerce KPI dashboards to help boost operational efficiency and stay competitive. Let’s dig in.
Sales KPIs for e-commerce
Sales KPIs provide a clear and measurable way to assess business performance around conversions and revenue. With up-to-the-minute data, you’ll gain a real-time understanding of which strategies are working well and where improvements might be needed. Here are the top sales e-commerce KPIs and metrics to help you assess the health of the sales pipeline and drive revenue:
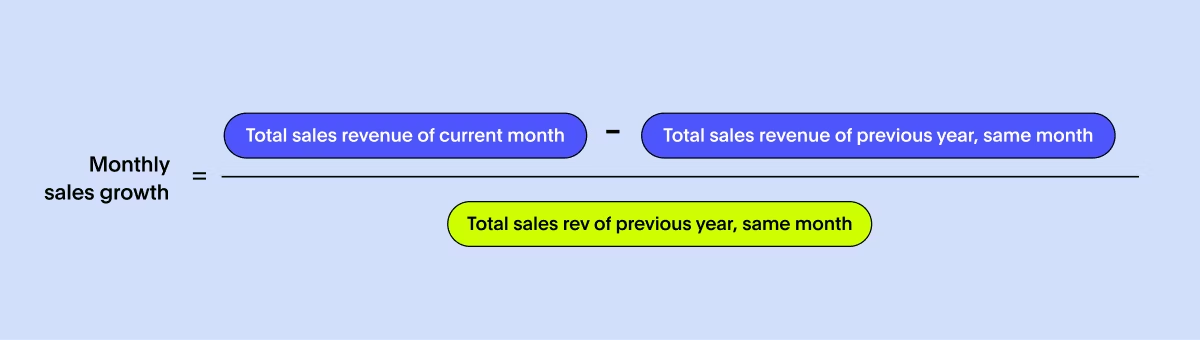
1. Monthly sales growth
Monthly sales growth is an e-commerce KPI that measures the month-over-month percentage increase or decrease in sales revenue. Monitoring this metric helps you evaluate your sales team’s performance and provides insights into evolving customer behavior. Armed with this information, you can set realistic sales targets and make timely adjustments to improve future performance. To calculate monthly sales growth, follow the formula below:
For instance, in the example below, you can drill into specific categories to analyze your monthly sales growth more granularly and evaluate your sales team’s performance against targets and objectives.
Average order value refers to the average dollar amount a customer spends. It offers valuable insights into consumer spending behavior, which can help you pinpoint cross-selling or upselling opportunities to boost revenue. To calculate the average order value, you can use the formula below:

This e-commerce metric offers a comparison between purchases made by first-time customers and those made by repeat customers. It helps you analyze the company’s customer loyalty and retention efforts so you can take corrective action before customer attrition becomes a major issue.
While there is no set formula for calculating this metric, you can leverage a modern dashboard solution like ThoughtSpot to consolidate all your customer data into a single, intuitive screen and identify new vs returning customers. With drill-downs and AI-enhanced insights, you can unlock hidden customer trends and patterns to create more targeted loyalty programs.
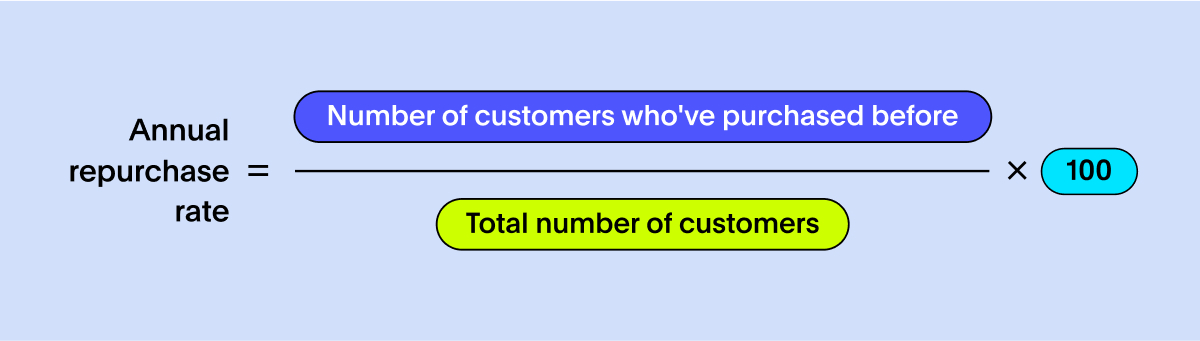
The annual repurchase rate is an e-commerce metric that calculates the percentage of customers who make repeat purchases within a year. It’s particularly relevant for evaluating your overall customer experience and understanding how much value your customers find in your store. Such insights allow you to deliver personalized recommendations and loyalty programs, enhancing the overall shopping experience for customers. Here’s how you can calculate the annual repurchase rate:
💡Don’t get swept away by changing tides—take charge of your sales strategy. See how Fabuwood’s executives leverage Sales Liveboards to boost efficiency and profitability.
Running a successful e-commerce business requires proactive management of resources. However, choosing the right financial KPIs to prioritize can be overwhelming. To help you make an informed decision, we’ve listed the top finance KPIs you should incorporate into your real-time e-commerce dashboard:
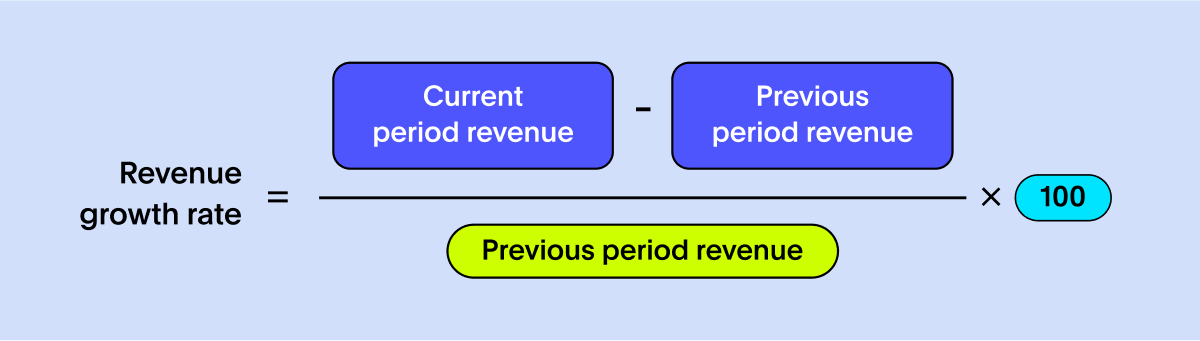
The revenue growth rate tracks the percentage increase in your revenue over a specific time period. Keeping track of this e-commerce KPI is important because it allows you to assess your business's ability to generate more sales. Additionally, it provides insights into the overall demand for your products or services in the market. Here’s how to calculate the revenue growth rate:
For a real-time snapshot of your revenue growth rate, you can leverage ThoughtSpot’s AI-Powered Analytics to take your financial monitoring to the next level. With features like natural language search, you can easily gain a holistic view of what drives your revenue and develop proactive strategies to navigate changing market conditions effectively.
The operating profit margin is the net income derived from your company’s core business functions. It’s the total amount of money your company has left over after covering its operating costs but before paying taxes. Knowing this percentage helps you evaluate your company’s ability to generate profits from sales streams, control expenses, and manage resources effectively.

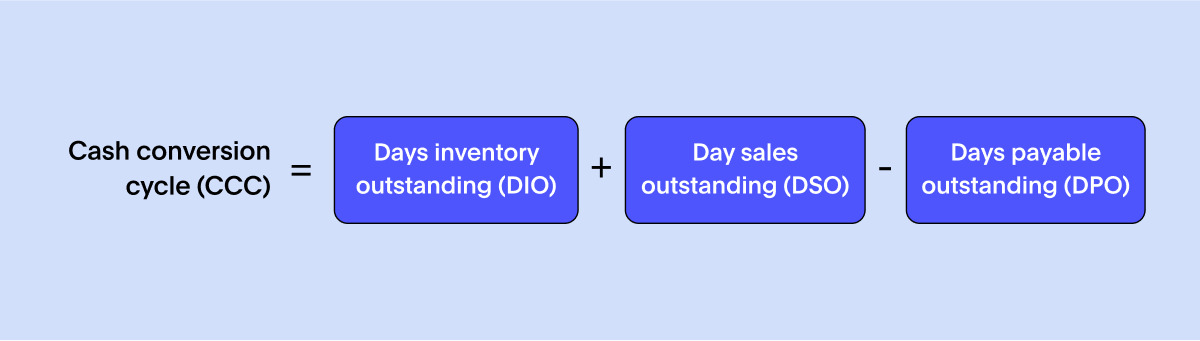
The cash conversion cycle is an e-commerce KPI that measures how long it takes to convert investments in inventory into revenue from sales. Analyzing this metric helps you identify areas where improvements can be made, such as reducing inventory levels and managing payments to suppliers more effectively. To calculate CCC, follow the formula below:
💡Learn more about how BI solutions can unlock new transformation opportunities with this insightful podcast, featuring John Hughes, Chief Strategy Officer at The Modern Milkman.
To keep your marketing strategies aligned with your e-commerce business goals, it's crucial to monitor the performance of your ongoing campaigns. By tracking the right marketing KPIs, you can gain insights into customer behavior and tailor your marketing efforts accordingly. Here are the top marketing KPIs you need to track:
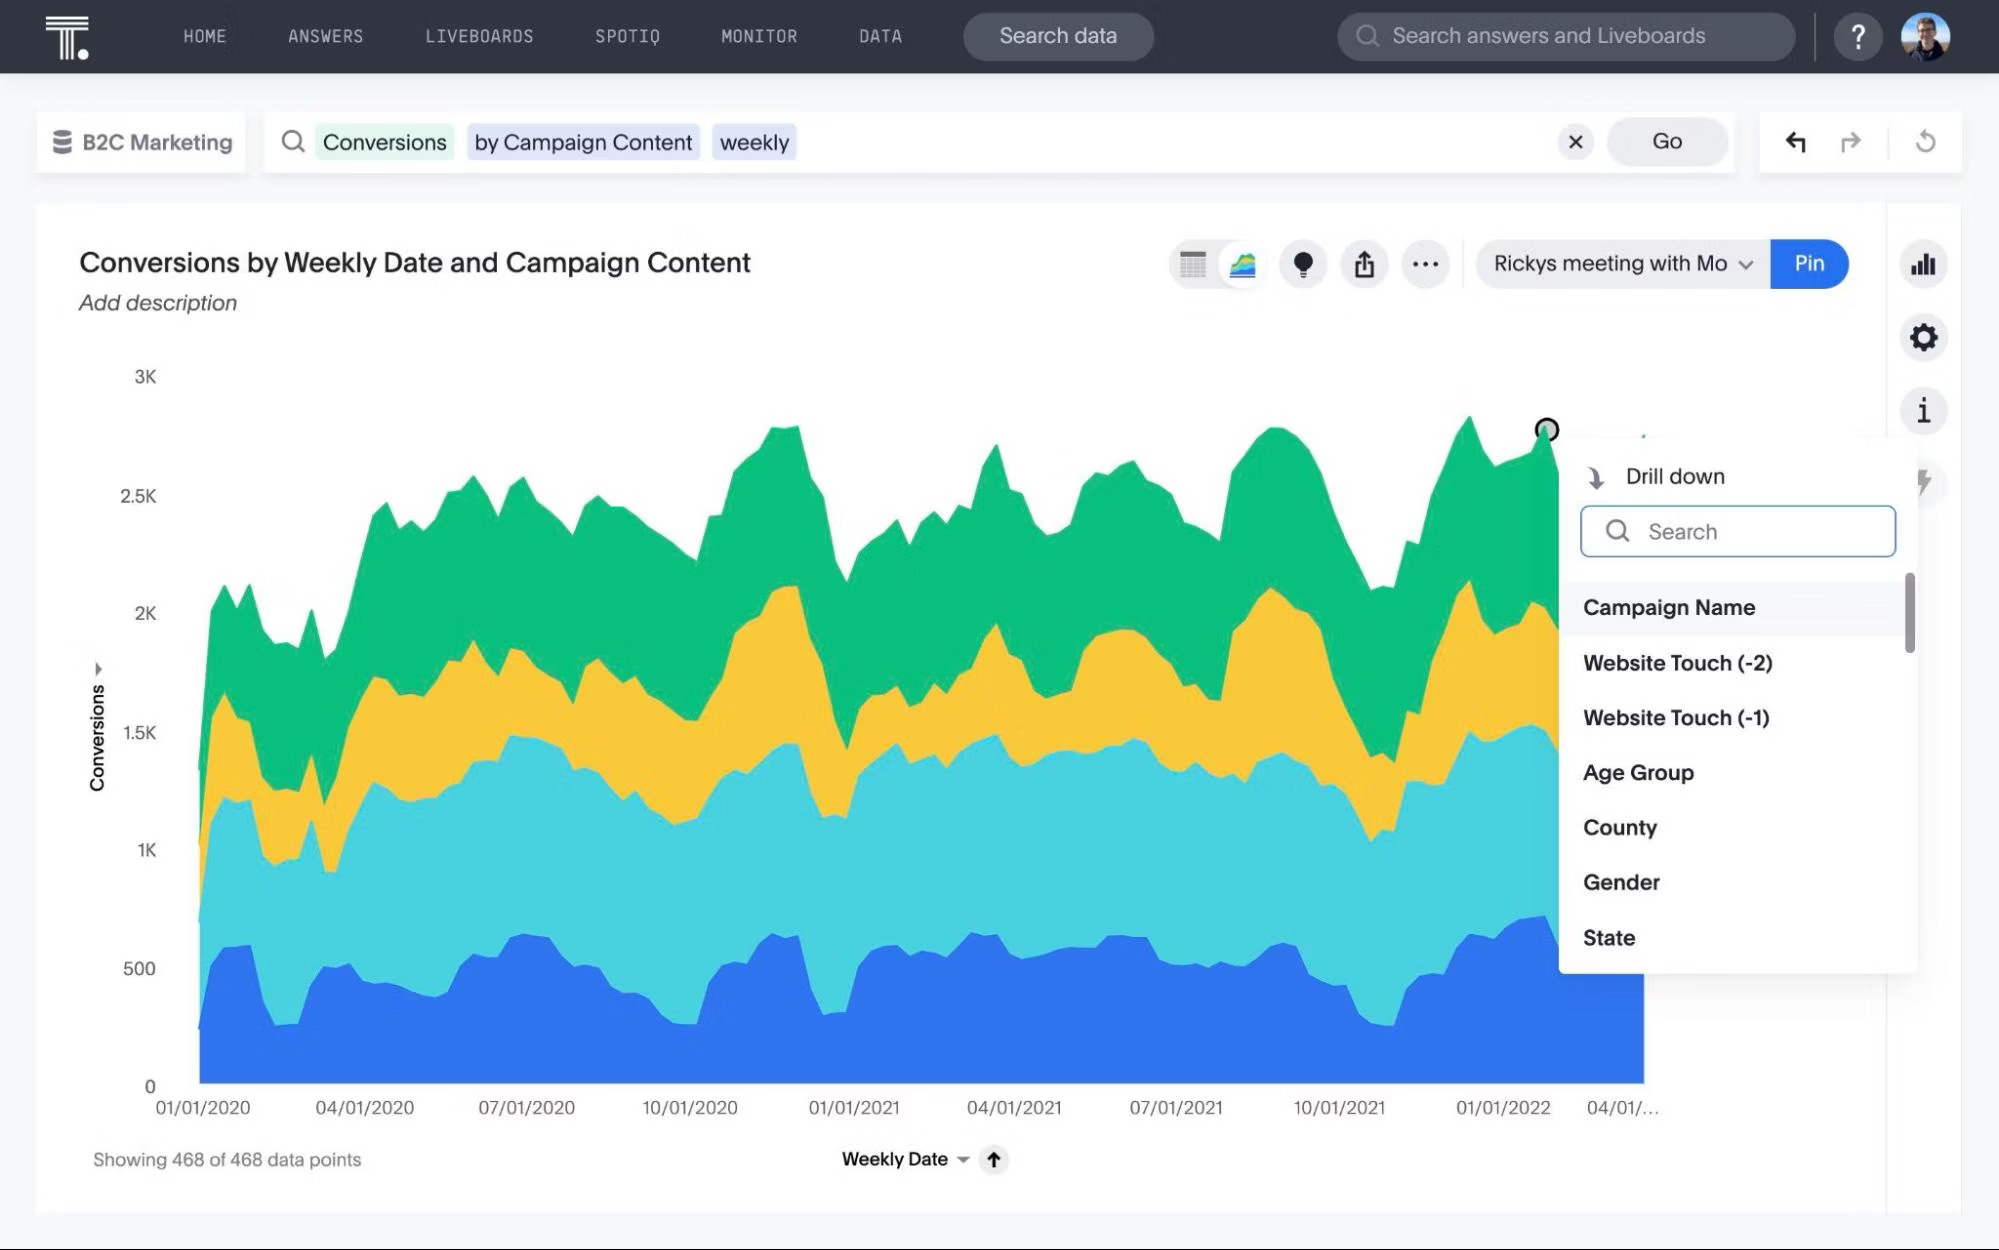
This marketing metric measures the percentage of users who complete a desired action, such as making a purchase or signing up for a newsletter), as a result of a specific marketing campaign. Conversion rate is crucial in evaluating the effectiveness of your marketing campaigns, assessing top-performing channels, and understanding how different campaigns resonate with your customers. Here’s how to calculate the conversion rate by campaign:

Using these insights, you can identify content gaps or optimize your ad spend to ensure your marketing strategies are not only effective but also highly responsive to customer preferences. For instance, in the example below, you can drill into specific categories to analyze your conversion rates more granularly and pinpoint areas where you can optimize spending.
Revenue per visitor (RPV) measures the average amount of money a customer spends during a single visit to your site. By closely monitoring this metric, you gain insights into user behavior and overall on-page experience. To calculate RPV, follow the formula below:

Website traffic is a vital e-commerce metric that tracks the number of visitors to your online store. It provides crucial insights into how potential and existing customers interact with your site. Monitoring this metric helps you pinpoint opportunities to enhance the online shopping experience, whether it’s by optimizing your website layout or streamlining the checkout process. Here’s the formula for calculating website traffic:

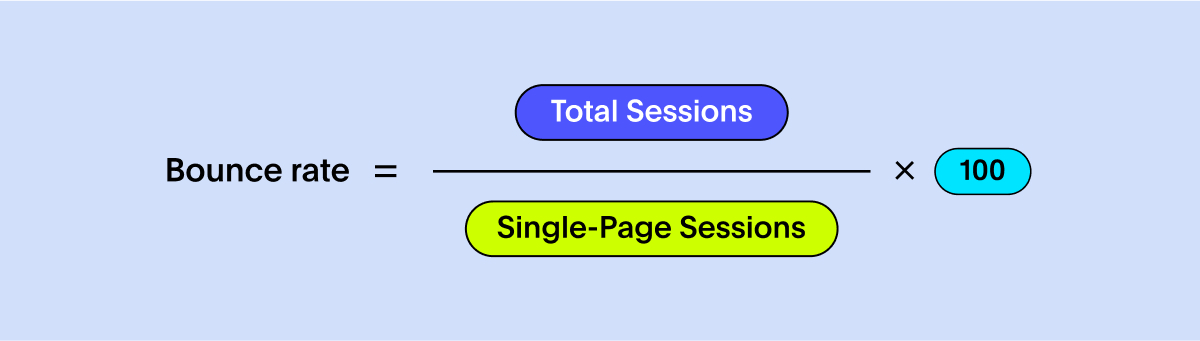
Bounce rate is another important indicator of your online store’s appeal and usability. It represents the percentage of visitors who leave your site after viewing just one page. A high bounce rate might suggest that your website’s content, layout, or loading times aren’t meeting user expectations. Strategies to improve this marketing metric include creating compelling content, incorporating interactive elements, and optimizing page-load speeds. Below is the formula for calculating the bounce rate:
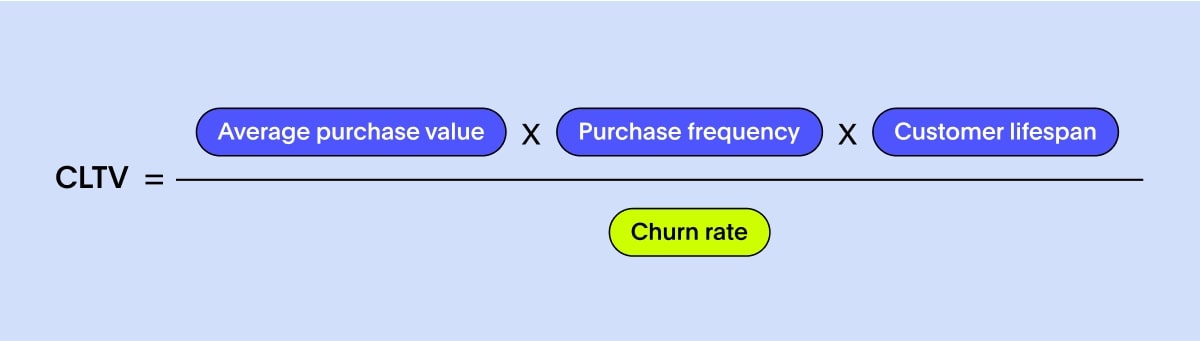
Customer lifetime value estimates the total revenue a customer is expected to generate over their entire relationship with the company. The estimation guides the marketing team in making effective customer segmentation and retention strategies. The formula offers a nuanced perspective by considering the average purchase value, purchase frequency, average customer lifespan, and discount rate.
💡Watch this webinar to see how Verivox, Germany’s favorite comparison portal, leverages advanced BI can enhance their pipeline efficiency and strengthen market positioning.
According to a recent study by Forbes, 53% of online shoppers indicate that they are more likely to purchase from businesses that personalize their experiences. That’s why it is crucial to monitor the right set of customer experience KPIs to understand customer behavior and identify friction areas. Here are the top CX KPIs and metrics to take the guesswork out of the equation and help you create smoother customer experiences.
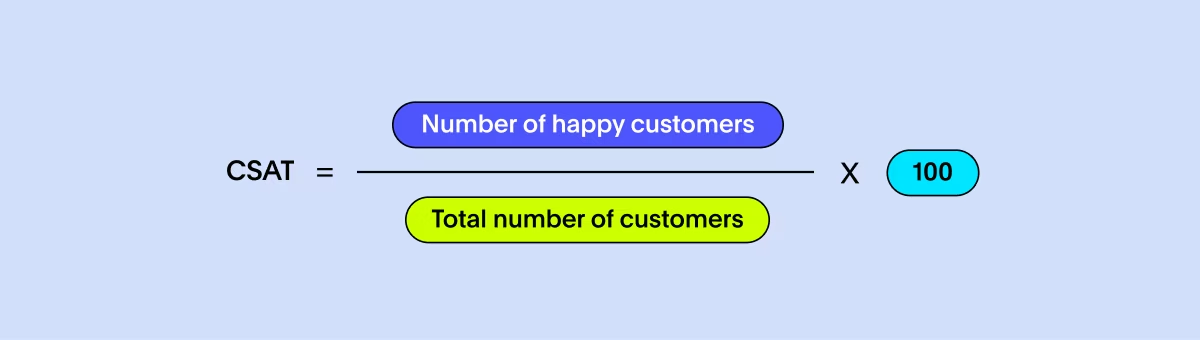
The customer satisfaction score gauges how happy or satisfied customers are with a business, purchase, or interaction. It’s typically measured through a feedback survey in which customers rate their satisfaction on a scale, often from 1 to 5, with higher scores indicating greater satisfaction. To calculate CSAT, use the following formula:
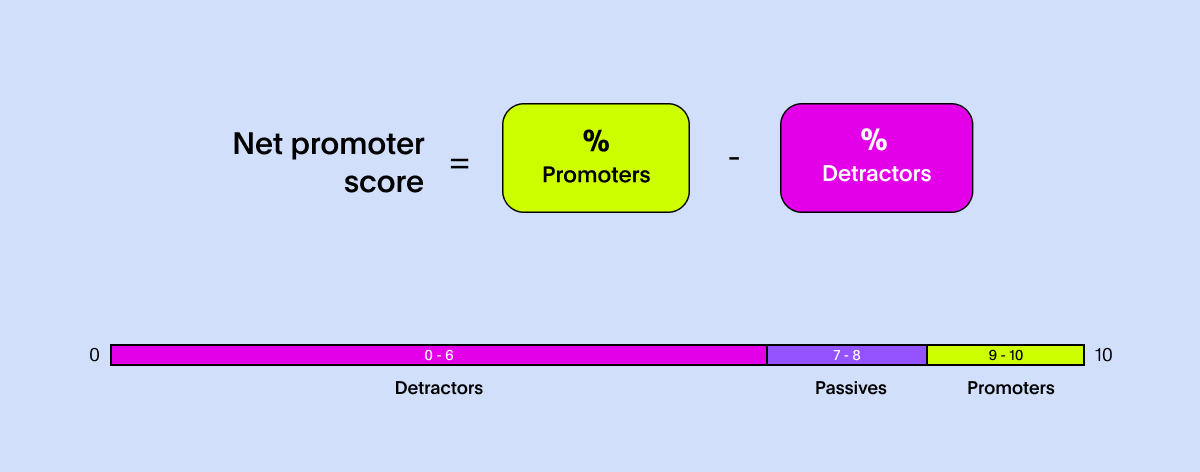
Net promoter score measures the likelihood of customers recommending your business to others. Analyzing the score gives you visibility into overall customer loyalty and advocacy. To calculate NPS, you’re asking customers, “How likely are you to recommend us on a scale from 0 to 10?” Responses are categorized as Promoters (9-10), Passives (7-8), and Detractors (0-6). The score is then calculated by subtracting Detractors from Promoters.
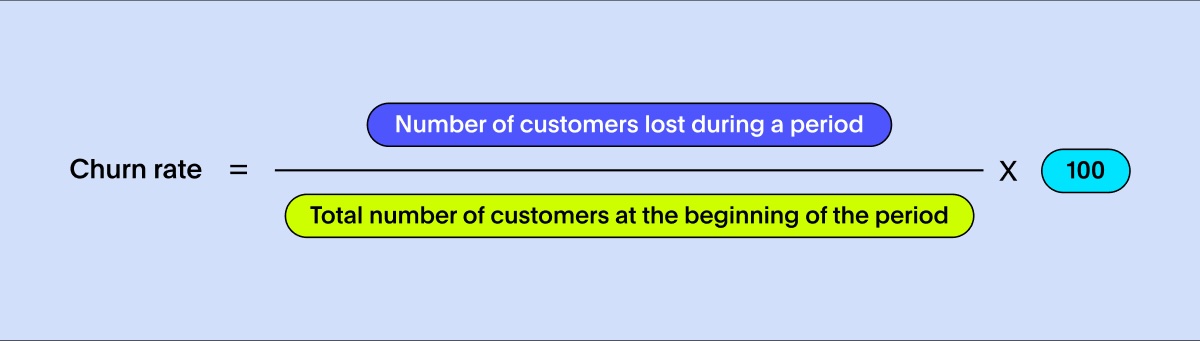
The churn rate is the percentage of customers who stop doing business with your company over a specific period. It’s a critical indicator of your company’s customer retention efforts. By identifying which customers are at risk of leaving, you can take proactive steps, such as offering special promotions and customizing your marketing efforts to retain them. Here’s how you calculate customer churn rate:
💡Supercharge customer journeys by leveraging data the right way. See how Northmill uses ThoughtSpot to personalize customer journeys, which helped them increase their conversion rate by 30%.
Choosing the right e-commerce analytics platform is key to thriving online. Legacy dashboard software often misses the mark, failing to offer real-time insights into KPIs. This not only hampers your ability to make swift decisions but also puts a strain on your data team, who are tasked with creating numerous dashboards and reports.
However, with ThoughtSpot, it's a whole different story. Our GenAI-powered experience puts all users in the driver’s seat, allowing them to easily dive into their e-commerce data. With powerful AI capabilities such as natural language search and SpotIQ, you can create drillable visualizations and dashboards that help you uncover hidden insights and opportunities. Even better, all these features are available across desktop and mobile devices, so you don’t lose access to essential information when you’re on the move.
Experience these capabilities firsthand. Schedule a ThoughtSpot demo today.
E-commerce KPIs FAQs
How many ecommerce KPIs should a growing store track at once?
Focus on 8-12 KPIs at most to avoid analysis paralysis. It’s a good idea to start with 2-3 KPIs from each category (sales, finance, marketing, CX) and add more as your team becomes comfortable with monitoring them and acting on the results.
How often should different ecommerce KPIs be reviewed?
Consider reviewing your KPIs at different intervals based on their strategic importance:
Daily: Operational metrics like website traffic and conversion rates that require immediate attention
Weekly: Tactical metrics such as AOV and customer acquisition that inform short-term optimizations
Monthly: Strategic KPIs like CLTV and churn rate to identify longer-term trends and guide strategic planning
The right cadence depends on your business needs, team capacity, and how quickly you can act on insights.
Are ecommerce KPIs different for marketplaces vs branded DTC sites?
Yes. Since DTC brands control the entire customer experience and relationship, while marketplace sellers operate within platform constraints, the KPIs are typically different.
Marketplace sellers should focus on:
Product ranking
Seller rating
Marketplace-specific conversion rates
DTC brands should prioritize:
Brand awareness metrics
Direct traffic
Customer retention
Focusing on the right metrics helps free your team from unnecessary distractions and prevents your dashboards from getting cluttered with too many visualizations and options.
Who should own the ecommerce KPI dashboard inside the company?
The data or analytics team should build and maintain the technical infrastructure, but business stakeholders should own the insights and actions. Sales teams own sales KPIs, marketing owns traffic and conversion metrics, and finance owns profitability and cash flow KPIs.


