


Instead of offering clunky, lifeless dashboards that provide users with little-to-no value, what if you could bring advanced analytics and reporting into your product? These capabilities help users ask their own questions, drill into data, and glean insights—all without switching workflows.
White label analytics is the name, and this step-by-step guide will show you how to play the game—from understanding their purpose to referring to how successful examples leverage them. Let’s dive in!
Table of contents:
White label analytics refers to the process of integrating custom analytical and reporting capabilities, such as interactive data visualizations or live dashboards, directly into your product. You may have heard white label analytics referred to as embedded analytics or even data monetization. Whatever the label, the idea’s the same: giving your users real-time insights right where you work.
With embedded analytics software, you don’t have to start from scratch. You can tweak the colors, widgets, fonts, and logos to match your brand perfectly, so you can deliver an analytics experience that’s on-brand and fast to market.
With white label analytics tools like ThoughtSpot Embedded, you’re not just adding reports to your product—you’re giving users in-the-moment insights into the tools they already use and love. It’s all about making working with data easier, not harder. Here are a few examples:
Real-time dashboards: No more waiting for weekly reports. With dynamic, AI-augmented dashboards, your users can track KPIs in real time, identify important trends, and tell compelling data stories—all in one place.

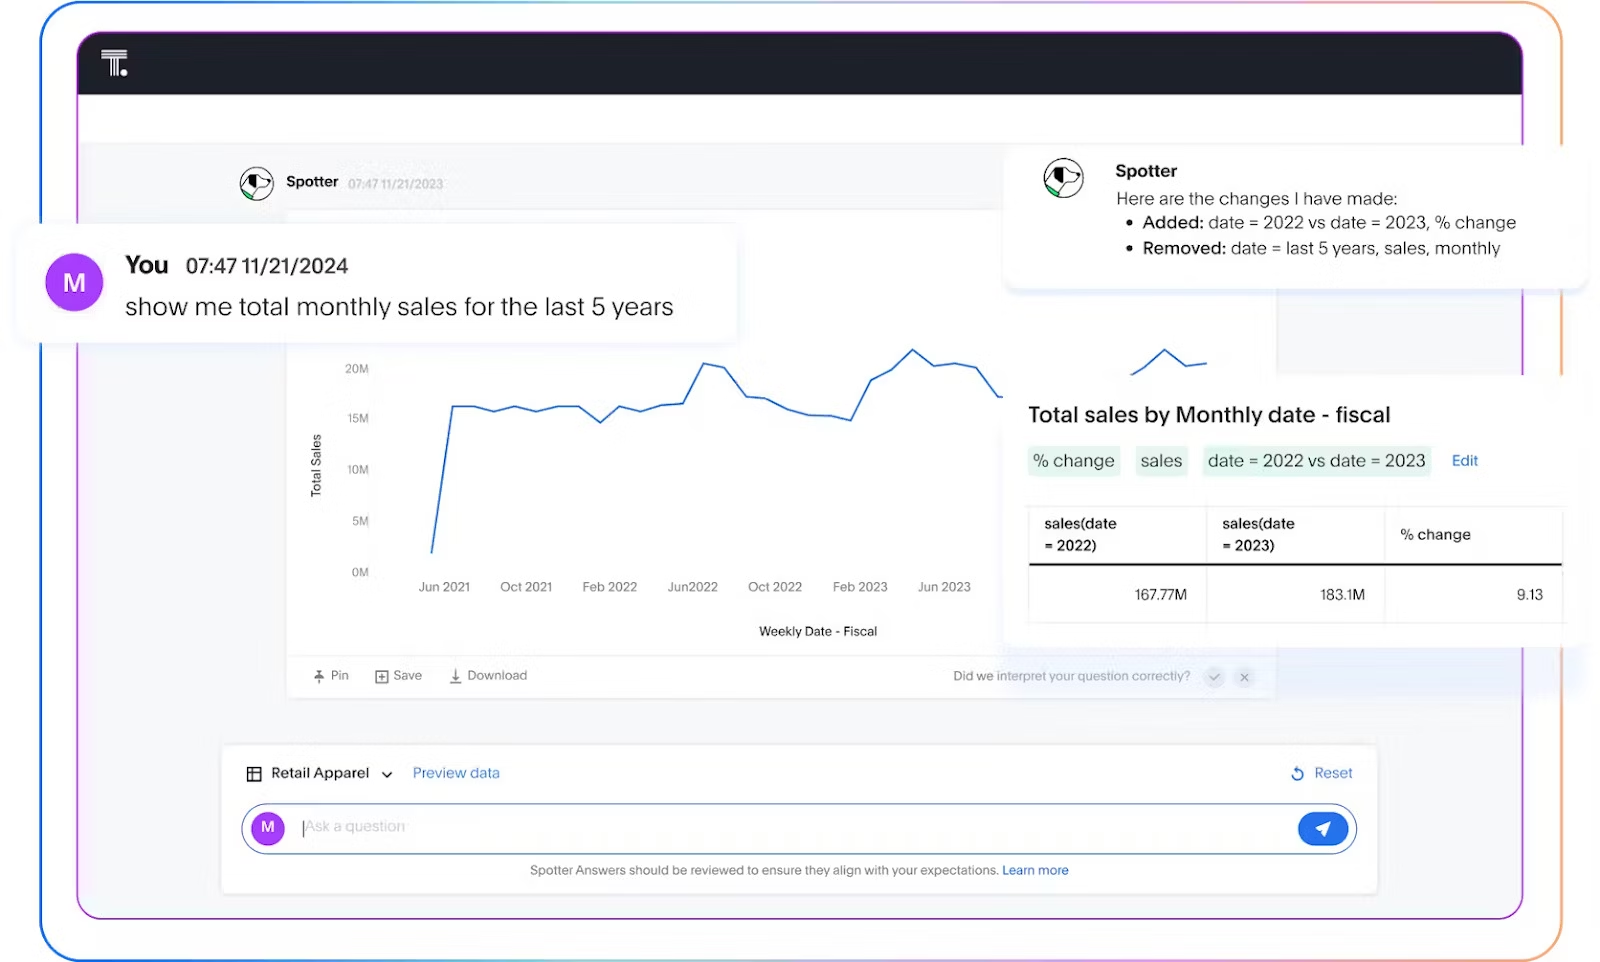
Conversational AI: Make things feel more personal by adding conversational AI features that let users interact with their data like they’re chatting with a colleague. For example, by embedding ThoughtSpot’s Spotter into your app, your customers can ask questions in natural language and get instant insights—no technical jargon needed. Whether it's catching anomalies or discovering hidden trends, embedding AI analytics into your app helps users turn insights into action faster.
Dynamic visualizations: Think rich, interactive charts, graphs, and tables that let you spot patterns and insights instantly, turning complex data into something easy to understand. It’s all about getting answers at a glance—no need to waste time decoding endless rows of data.
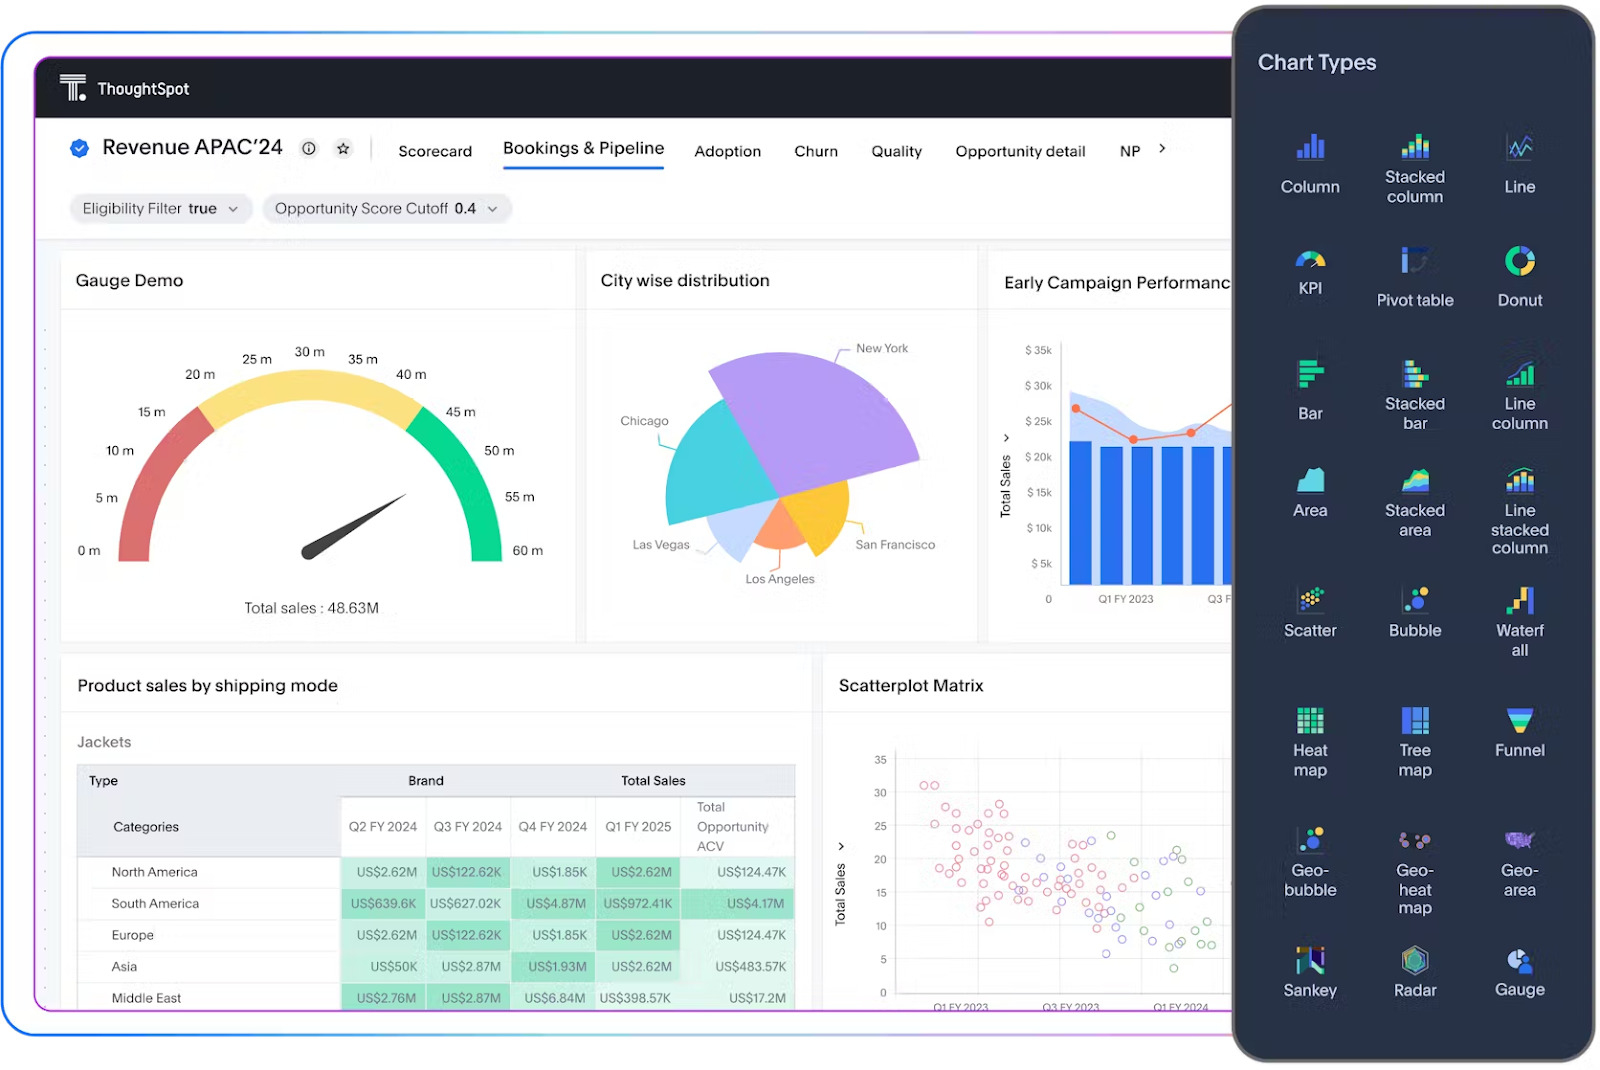
Advanced filtrations and drill-downs: Turn static charts and graphs into interactive visualizations with filters, drill-downs, and contextual text summaries. These interactive features allow users to pinpoint pain points and discover patterns that otherwise may go unnoticed.
Custom KPI reports: Empower users to track and analyze quantifiable indicators with real-time KPI reporting. Whether they’re tracking a project’s progress or measuring against key goals, white label reporting allows them to stay on top of all critical metrics, encouraging a data-driven culture.

Report builder for authoring dashboards: Build custom reports, design dashboards, and share insights—all under your brand. You get the flexibility to choose the types of reports and visualizations that make sense for your users, giving teams the power to create content that actually matters to them.
Once you determine what should be white-labeled, the next step is to determine what actually makes for a great analytics experience rather than an afterthought.
Spoiler: it’s way more than just slapping your logo on a dashboard.
Here’s what good white-labeling looks like from a user’s perspective:
A truly native experience: Great white label analytics doesn’t feel external. It looks and behaves like the rest of your product, from fonts and colors to user flows. You have full control over styling and layout, so users never feel like they’ve left the platform.
Accessibility: Data should empower all users, not just experts. Features like natural language search, AI-generated insights, and intuitive UI elements make it easy for anyone to explore and act on data without formal training.
Fast, real-time insights: Nobody wants to wait for minutes or hours for a query to load. A good analytical experience is optimized for speed and responsiveness, even when you’re dealing with large data sets.
At the end of the day, white label analytics should do more than check a box—it should elevate your product experience. When it’s fast, intuitive, and fully aligned with your brand, it becomes something users rely on daily, not just when they have to run a report.
1. Saves valuable resources
Building your own data analytics software from scratch is a huge, code-intensive commitment—think of the time and resources you need for development, integration, user support, testing, and constant maintenance. In the meantime, all that capital is tied up in something that hasn’t even started driving results yet.
Alternatively, embedding a white-label analytics tool can save months of development time and costs. With developer-friendly SDKs, you can easily release these experiences to the market, boosting ROI and allowing DevOps teams to focus on strategic decision-making.
This advantage also extends past the initial launch, because embedded analytics vendors have dedicated support and maintenance teams, you can also save on future maintenance costs.
2. Creates new revenue streams
In a survey by Product-led Alliance (PLA), 57% of product leaders say that embedded analytics has a direct impact on revenue. By offering a more personalized experience, even non-technical users can leverage your product to find invaluable insights.
As you find new ways to deliver value to your users, you open up revenue streams, such as creating new pricing or packaging around these white labeled analytics features.
Take, for example, Accern. They integrated ThoughtSpot Embedded into their existing tech stack, allowing them to offer a tailored experience to non-technical finance and banking professionals. With a search-based interface, Accern turned its data experience into a premium subscription model, giving its bottom line a nice boost.
The takeaway: Accern’s story shows that with embedded, white-labeled analytics, you’re not just helping users find answers—you’re building new monetization pathways in ways that traditional BI tools never allowed.
3. Customizable features
White label analytics allows you to maintain brand integrity while offering users a world-class analytics experience. You can personalize everything from logos and colors to sliders, buttons, and filters, making the entire workflow smoother for your users. Plus, you can add AI-powered features and custom visual libraries so your users can interact with their data in the most intuitive way possible.
By embedding ThoughtSpot into its existing data stack, Harri re-launched its hospitality staffing platform. With custom AI-augmented dashboards for each user group, busy hospitality managers were able to track key performance metrics in real-time. This allowed their users to make quick adjustments and meet business objectives.
The takeaway: If your users are moving fast and need insights without friction, this level of customization isn’t just nice to have—it’s what drives better decisions, stronger adoption, and a product experience they’ll keep coming back to.
4. High user engagement
As data continues to grow, users often find themselves leaving their workflow just to track down the information they need. Having to jump between apps and data platforms is not only annoying but also hurts your app's engagement metrics.
With white-label analytics, this problem pretty much disappears. You can easily access the data you need, right within the apps you use every day. No more toggling between tools or waiting for IT to provide a report. This intuitive experience means customers get answers faster, so they're more likely to engage with your app.
5. Increased competitive advantage
As businesses grow, feature parity isn’t enough. What sets your product apart is the value it delivers day in and day out. When users can’t get timely insights or make informed decisions directly within your product, they’ll look elsewhere. That’s where white-label analytics becomes a true differentiator.
By giving users the ability to build custom dashboards, explore data on their own, and act in real time—all without leaving your product—you’re no longer offering just a platform. You become the central hub for action and insight. That stickiness is hard to replicate.
Act-On is a prime example. Without a ‘single source of truth’, users struggled to access real-time data. With ThoughtSpot Embedded’s highly customizable Liveboards, the company saw a 60% increase in report usage, giving them an experience that finally matched the speed of their customers’ decisions.
This is what competitive advantage looks like today: a product that delivers answers the moment users need them, adapts to their unique workflows, and becomes impossible to replace.
White label analytics gives you the power to create personalized data experiences at scale, but not all solutions offer the same value. Here are the essential criteria to use in your evaluation:
Ease of use: Look for white-label analytics tools that offer a user-friendly, intuitive interface that’s as easy to use as your favorite app. The software should allow even non-BI-savvy users to easily interact with data and perform analytics, leading to better NPS and customer retention.
Customization options: Unlike traditional embedded analytics tools that simply add charts and graphs, the new class of white-label analytics tools offers ample customization opportunities. From layouts to look and feel, make sure the platform allows you to personalize the interface.
Scalability: Assess the platform’s ability to handle large data volumes. Consider if it can support a growing number of users without requiring a significant investment of resources. Be wary of platforms that offer a seat-based licensing that requires you to pay extra for additional capabilities and maintenance. A scalable solution that encourages self-service will deliver fast response times and reliable query performance, even as your user base grows.
Data security: Analyze the data security and governance features. This includes closely vetting security policies such as access control, user authentication, data encryption, and data sharing. Additionally, consider whether the platform supports secure integrations with internal and external systems.
AI capabilities: Check which GenAI capabilities are available for users. Some of the most popular AI analytics capabilities include natural language search, AI assistance for data modeling, and AI-powered text summaries. By embedding these capabilities, you can make data analysis much more intuitive and valuable for business users.
Customer support: Determine whether the vendor offers comprehensive support and reliable documentation. It is also critical to consider the availability of training programs for beginners and advanced users so they can navigate through the different features easily.
How ThoughtSpot makes your data work for you
Your users are over static dashboards. And your dev team? They’re tired of building one-off customizations every time someone wants to slice the data differently. There has to be a better way.
With ThoughtSpot Embedded, insight discovery becomes intuitive. With limitless dynamic drill-down options and customizable visualizations, users can get endless value from your application. And the best part? Your dev team can leverage our low-code SDKs to build customizable analytics modules that make your users feel right at home.
Say goodbye to outdated dashboards and make analytics more personalized for your users. Get started with your free demo today!


