


From managing supplier negotiations to identifying supply chain risks and reducing the purchase order cycle, procurement leaders have a lot to do at once. Add in the growing inflation and an unstable market, the pressure is on.
Luckily, with the rise of AI-Powered Analytics, you can now leverage interactive dashboards and real-time KPIs to gain insights into your procurement and sourcing functions and meet the ever-evolving needs of today’s shoppers. But with so many metrics and data points to track, how can you know where to start?
In this guide, we have prepared a list of top procurement KPIs and metrics that will help you increase operational efficiency and stay competitive—now and into the future. Let’s dig in.
Table of contents:
Gartner research shows that 72% of procurement and sourcing leaders plan to improve business outcomes by optimizing the total cost of ownership. This is why it is critical to understand how resources are allocated and identify areas where your procurement activities are over budget. Here are the top spend KPIs that will help you lower lead times and boost profitability.
(i) Maverick spend
Maverick spending is an expense, resulting from purchasing goods or services outside the company's established procurement procedures. These off-contract purchases occur without proper oversight or authorization from the procurement department, leading to high costs and operational risks.
To calculate the total Maverick spend, you need to follow these steps:
Consolidate all purchase data in one place.
Identify and separate purchases made through approved channels. This includes spending that adheres to negotiated contracts and procurement policies.
Exclude the approved spend from the total amount. The remaining balance represents your total maverick spend.
Utilize a data analytics tool to visualize the data to identify patterns and spot areas of improvement.
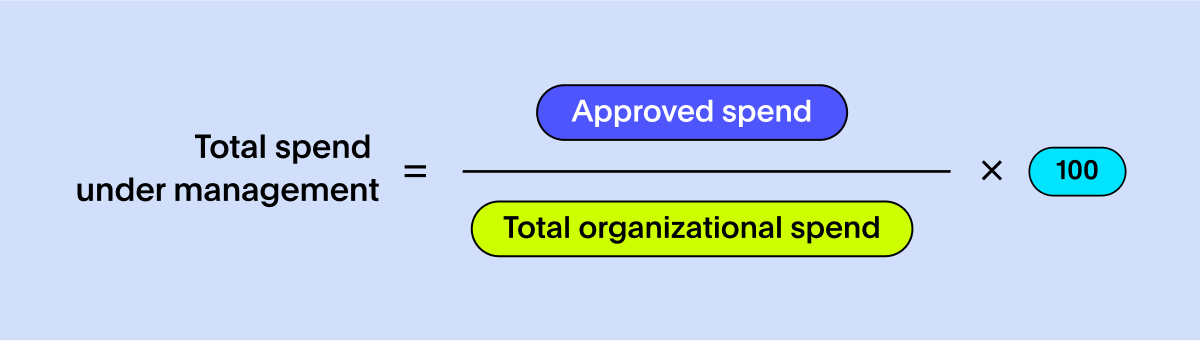
(ii) Total spend under management
This procurement KPI measures the percentage of procurement spending regulated or controlled by the management. Monitoring this KPI gives you complete visibility over the effectiveness of your procurement function, helping you identify performance gaps and spot areas for cost reduction. It empowers your team to make informed decisions regarding supplier relationships, contract negotiations, and technological investments.
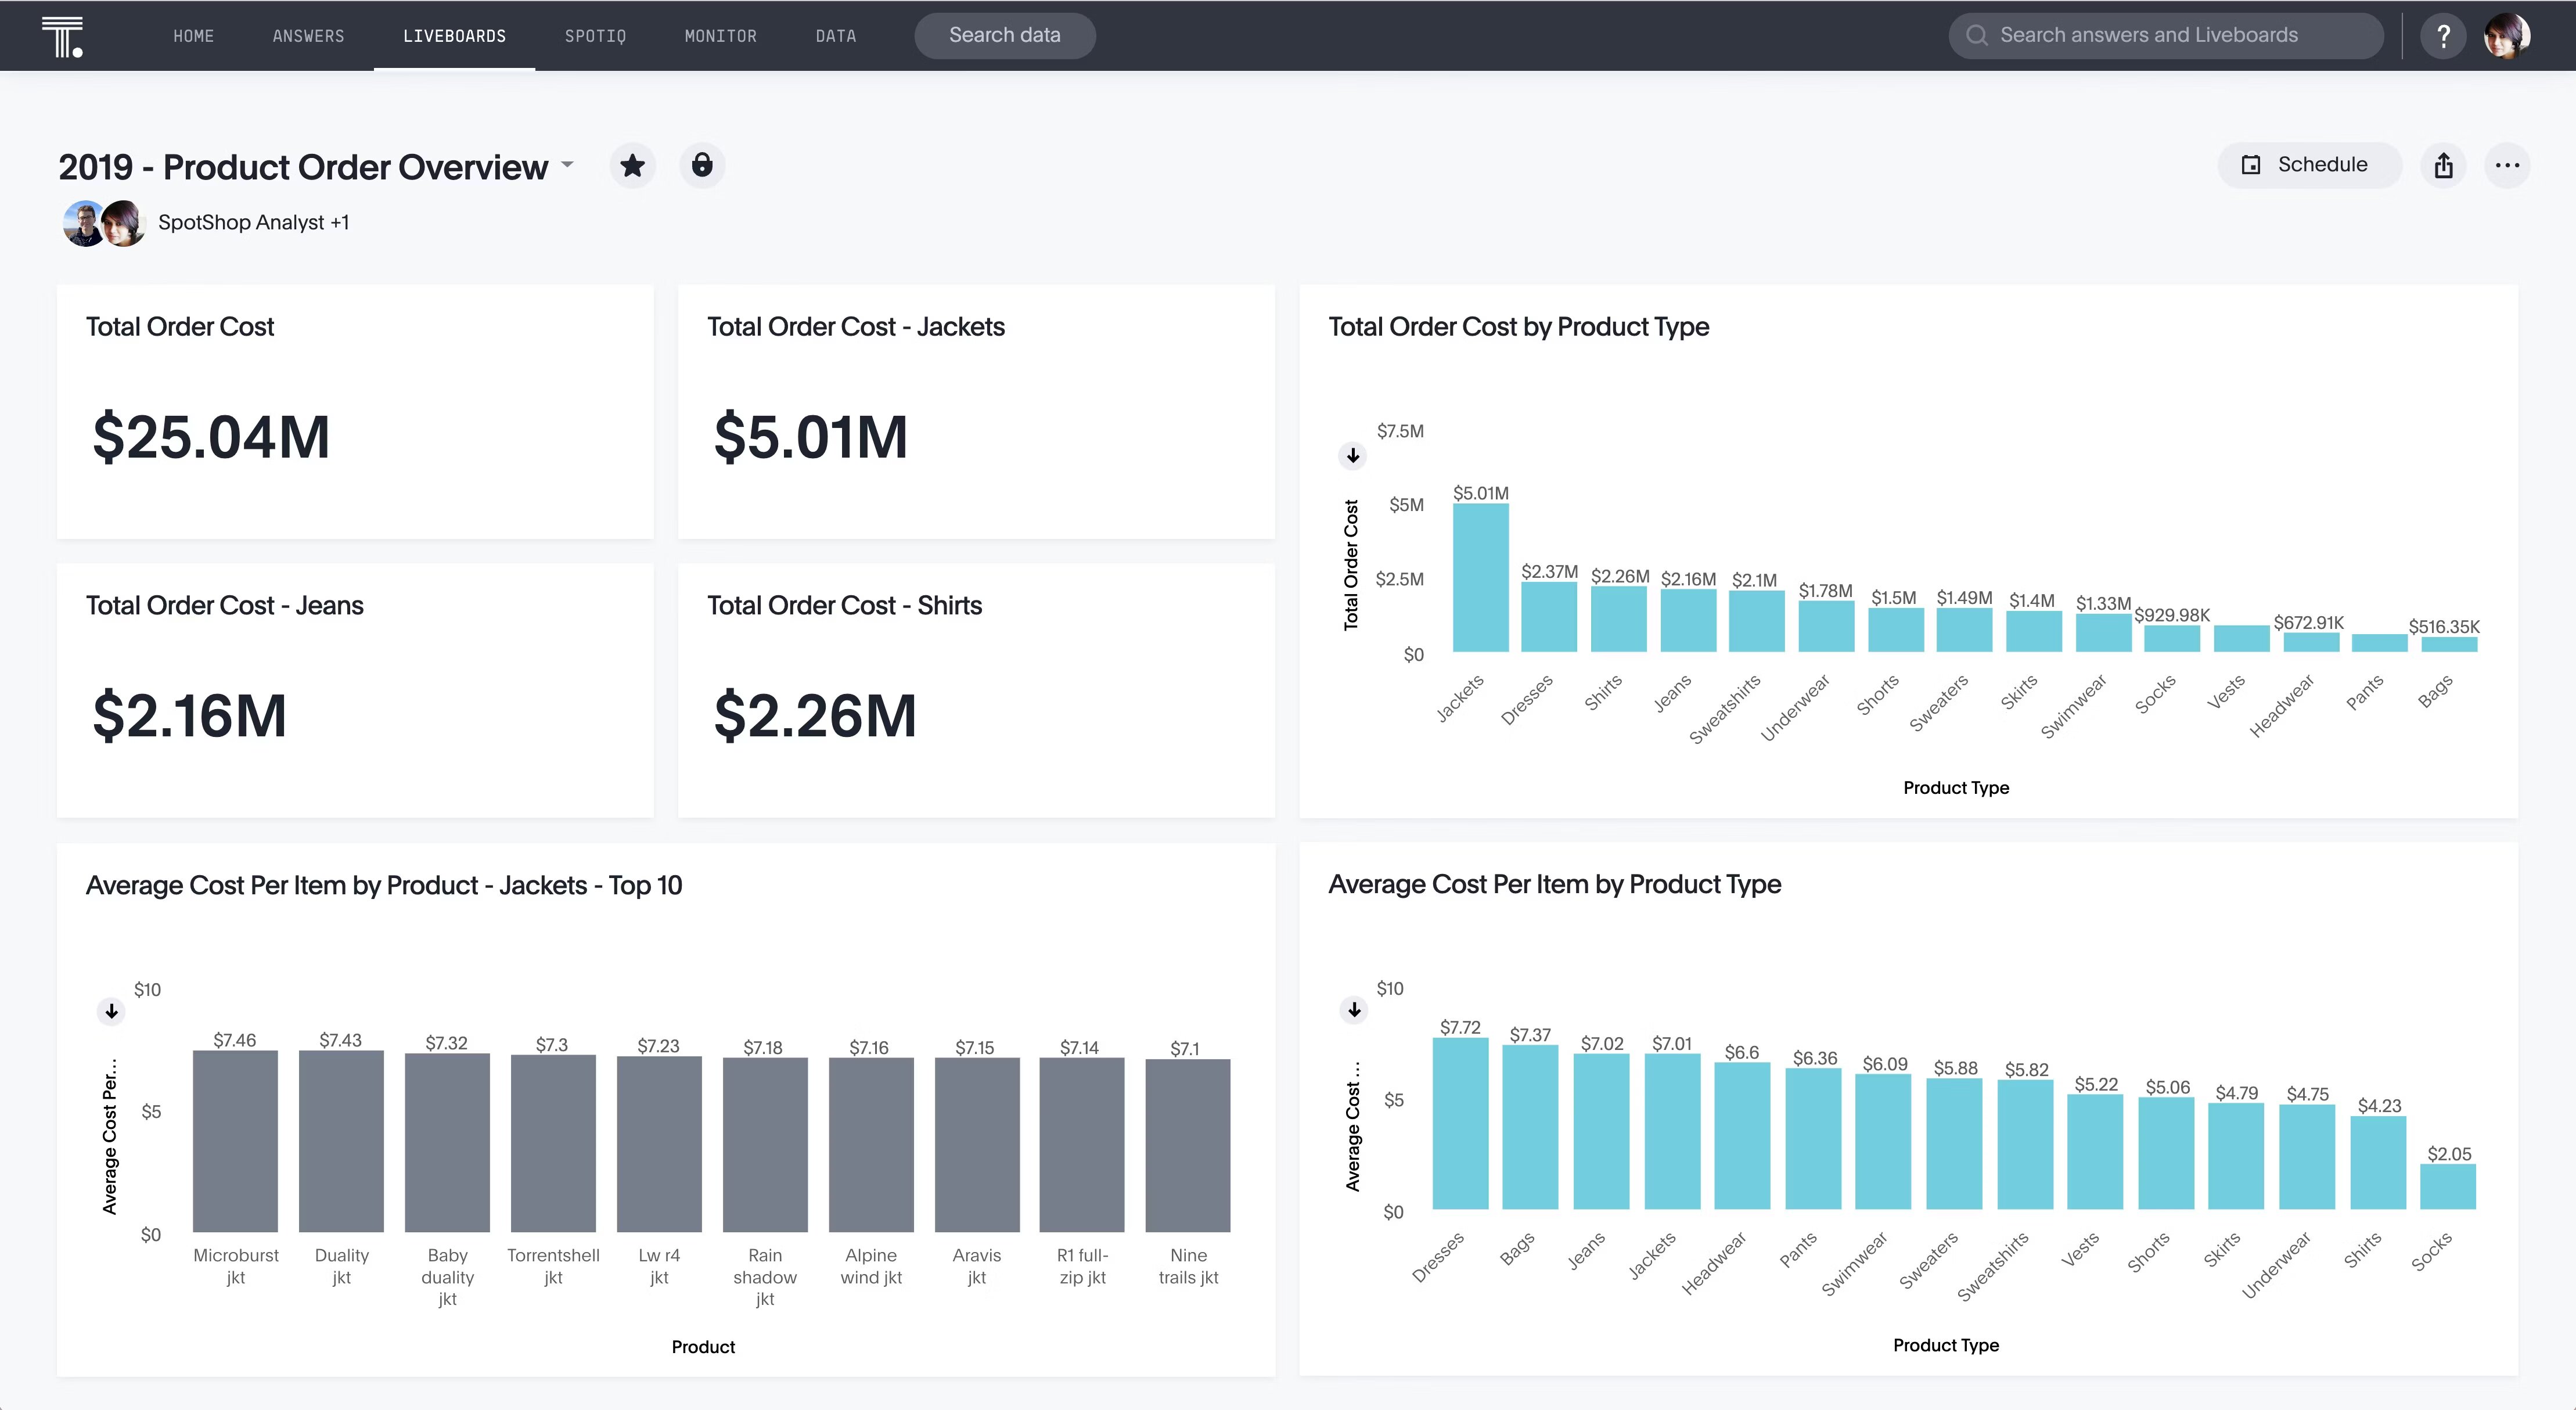
For instance, in the example below, you can drill into specific categories to analyze your total spending more granularly and pinpoint areas where you can decrease costs and boost operational efficiency.
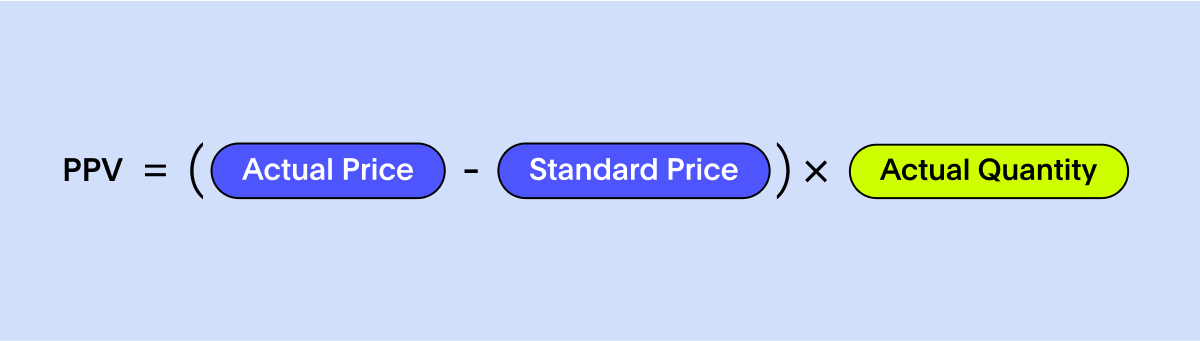
(iii) Purchase price variance (PPV)
The purchase price variance is a procurement KPI that measures the difference between the standard cost of an item and its actual purchase cost. Inspecting this variance is crucial in understanding how the actual costs of materials differ from what was expected or budgeted.
A positive price variance means your procurement team was efficient at negotiating pricing deals. On the flip side, a negative variance may indicate an increase in the price of materials or inefficient buying decisions.
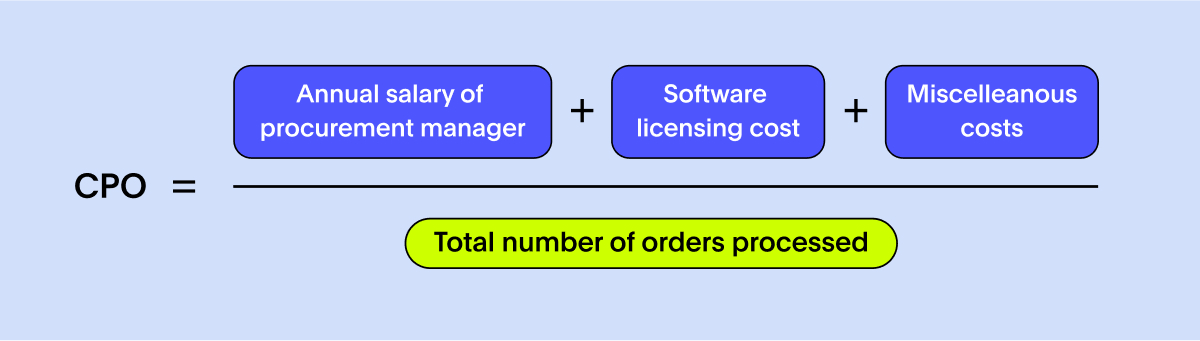
(iv) Cost of purchase order (CPO)
Cost of purchase order simply refers to any expenses associated with creating, processing, and managing purchase orders within your company. This measure helps you analyze how effectively purchasing processes are utilized compared to their full potential and identify any bottlenecks hampering your operations.
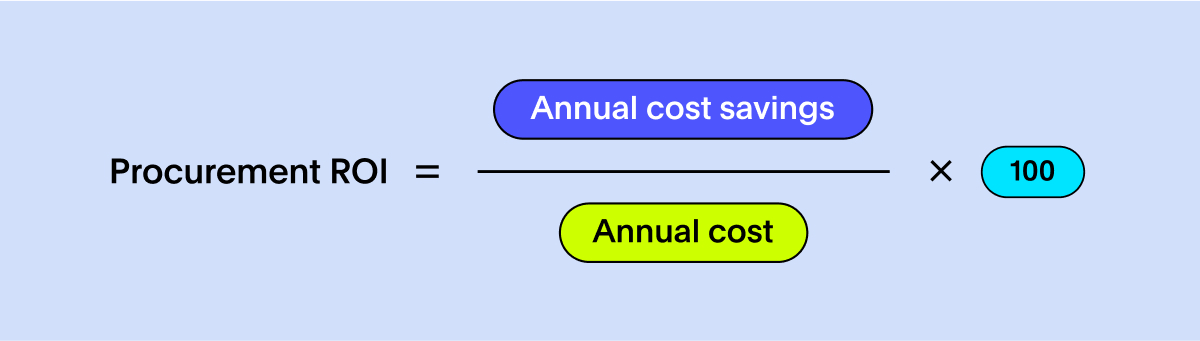
(v) Procurement ROI
Procurement ROI is a vital financial metric that measures the profitability of your procurement function. It helps in assessing the investments of your projects and determining whether they are generating sufficient returns. Unlike traditional ROI which relies on profits, the formula for this metric offers a nuanced perspective. It compares all costs associated with the procurement function with the savings it generates. Regularly visiting ROI calculations helps you gauge the economic efficiency of your sourcing processes and their impact on the bottom line.
To ensure that supplier relationships align with your business goals, it is crucial to monitor their performance. This includes moving beyond traditional metrics and analyzing real-time data to gain valuable insights into supplier operations and cost structures. Here are the top supplier KPIs you need to track to increase collaboration and drive business value:
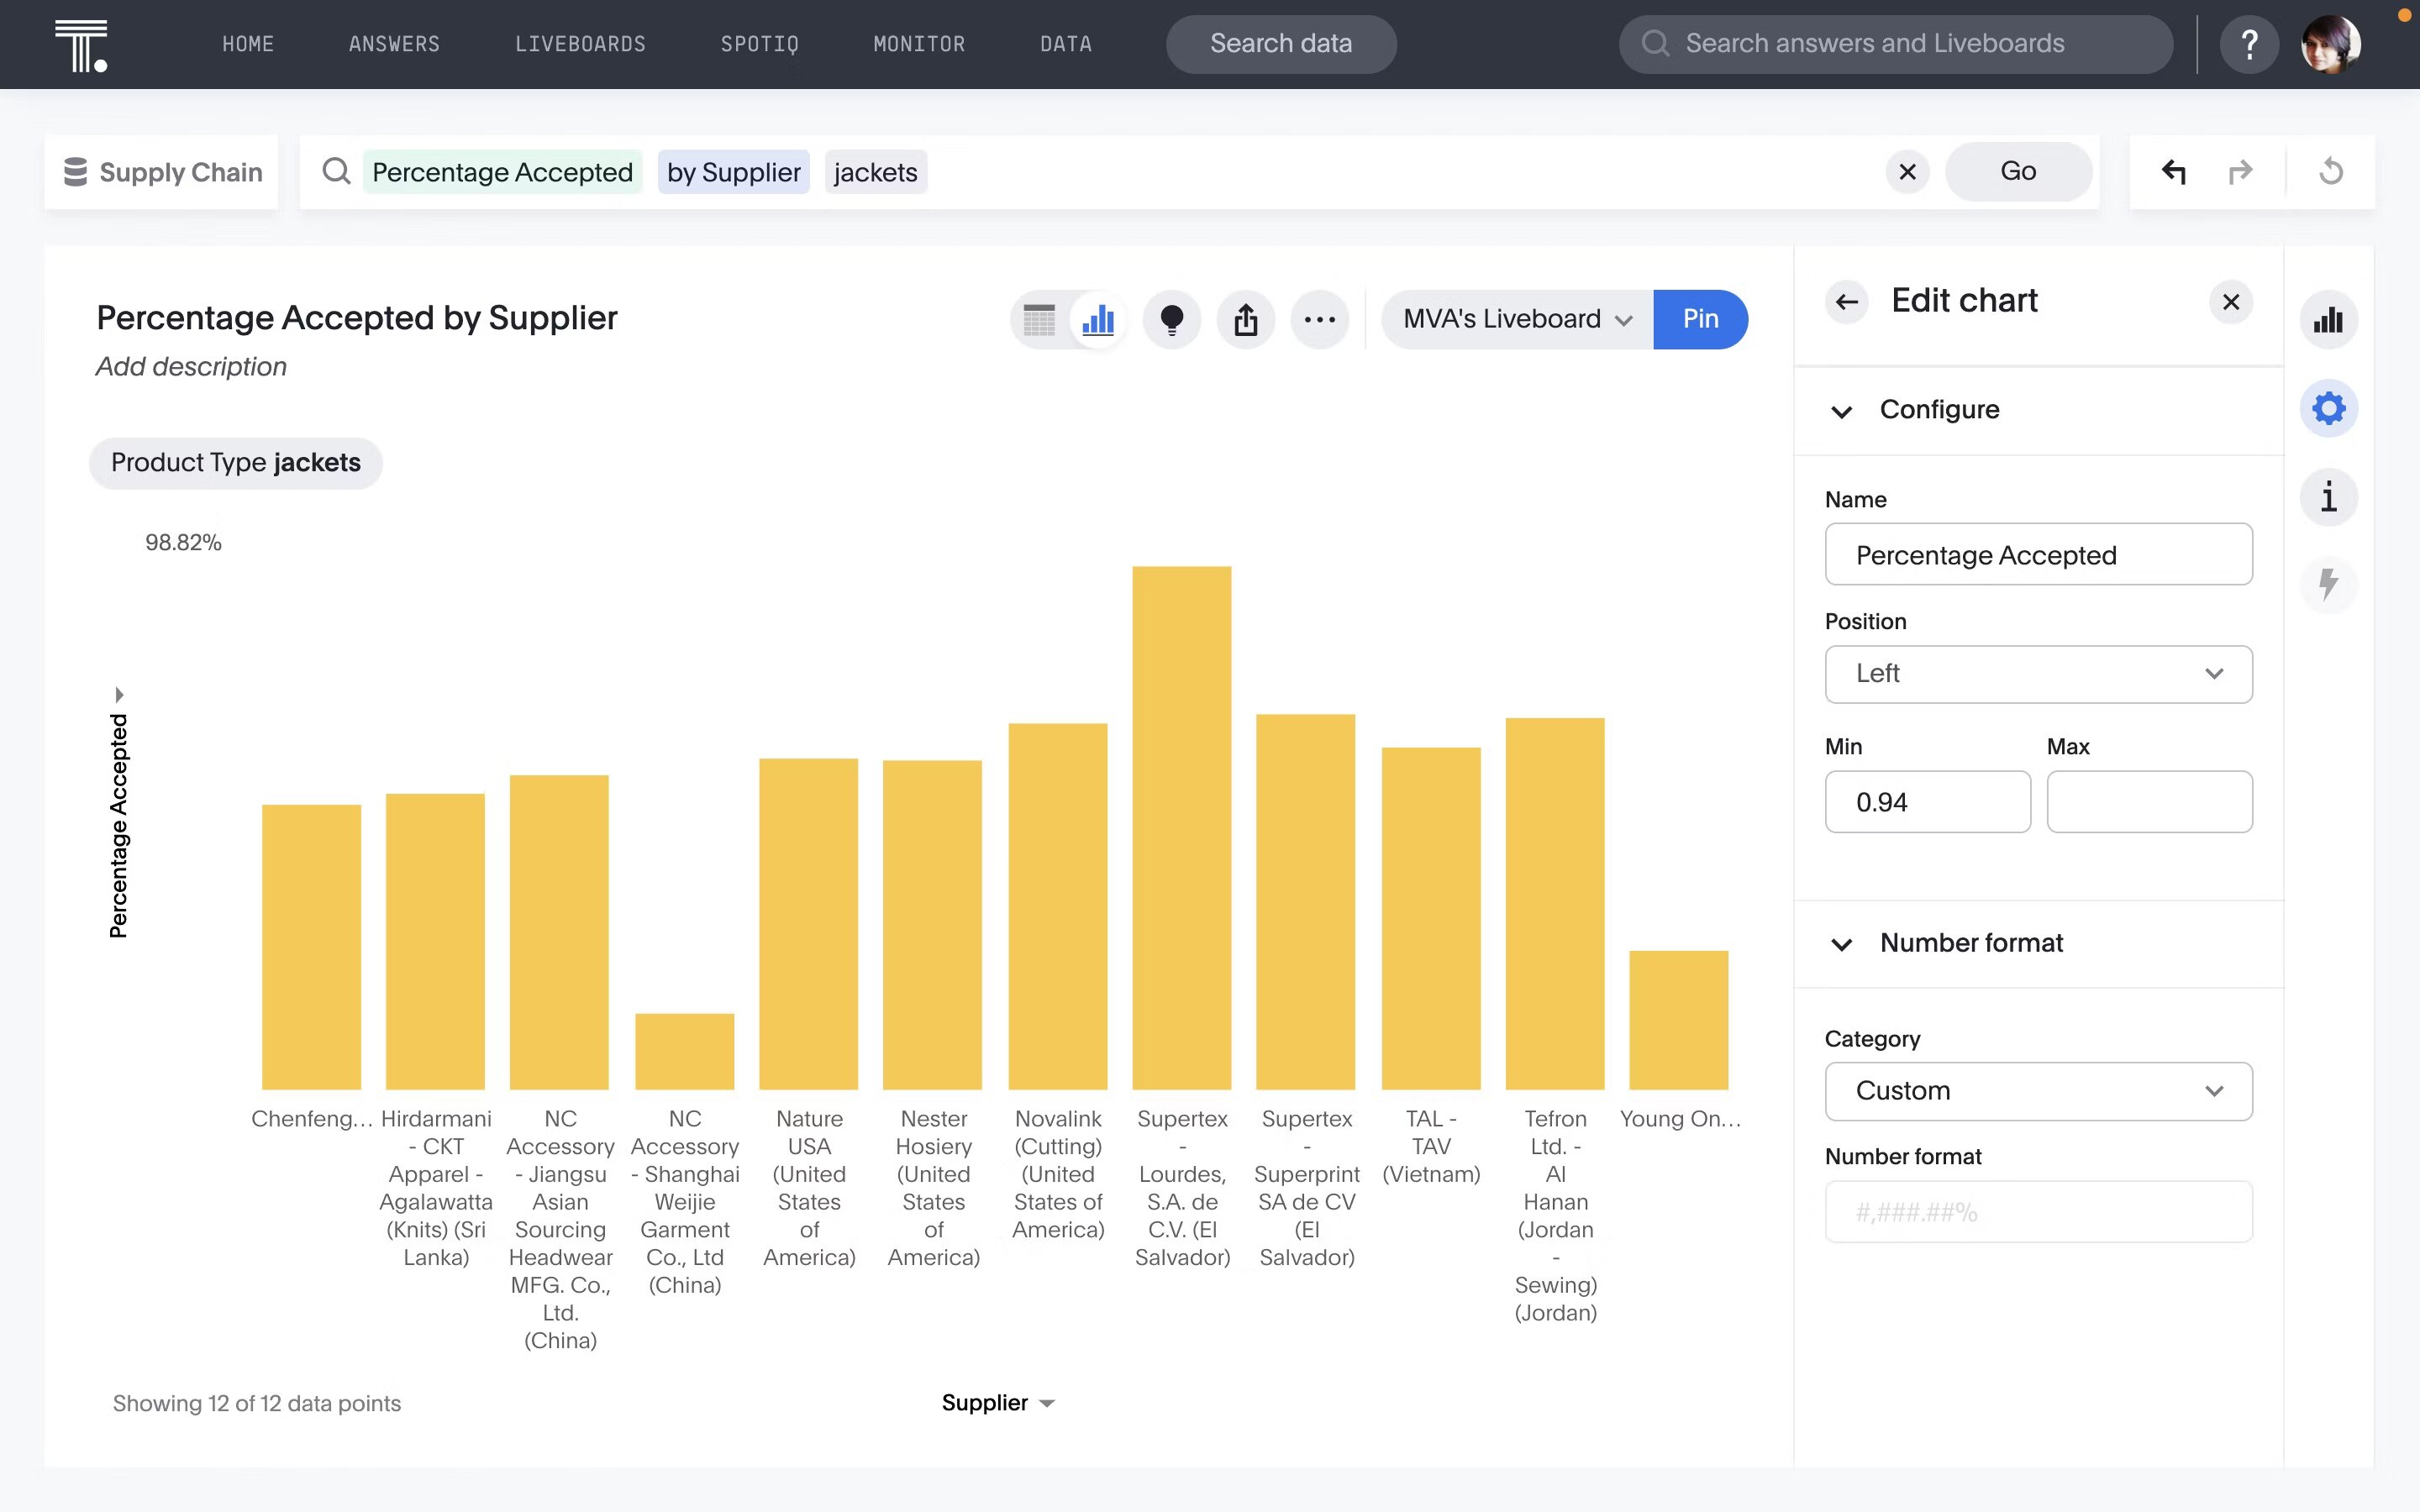
(vi) Supplier quality rating
Supplier quality rating refers to the ability of a supplier to deliver goods and services that consistently meet required standards. It is measured by assessing various factors, such as defect rates, supplier availability, compliance with contract requirements, and delivery time. High ratings increase the resilience of your supply chain, reduce lead times, and ensure overall customer satisfaction. However, a low rating means you need to apply corrective measures, such as performing regular supplier audits, renegotiating contract terms, or providing training.
(vii) Supplier risk score
A supplier risk score is a supply chain KPI that assesses the financial and operational risk associated with a particular supplier. This metric factors in the supplier’s financial health and measures their ability to meet production demands and fulfill regulatory obligations. Monitoring supplier risk score helps you make strategic decisions on who to partner with and minimize supply chain disruptions.
To measure this KPI, consider factors such as supplier credit reports, delivery times, quality scores, and past performance history. Evaluate each risk factor on a scale and develop a weighted index that reflects the overall risk. It is ideal to diversify your supplier base depending on their risk score. This is essential for shortening lead times and minimizing product defects.
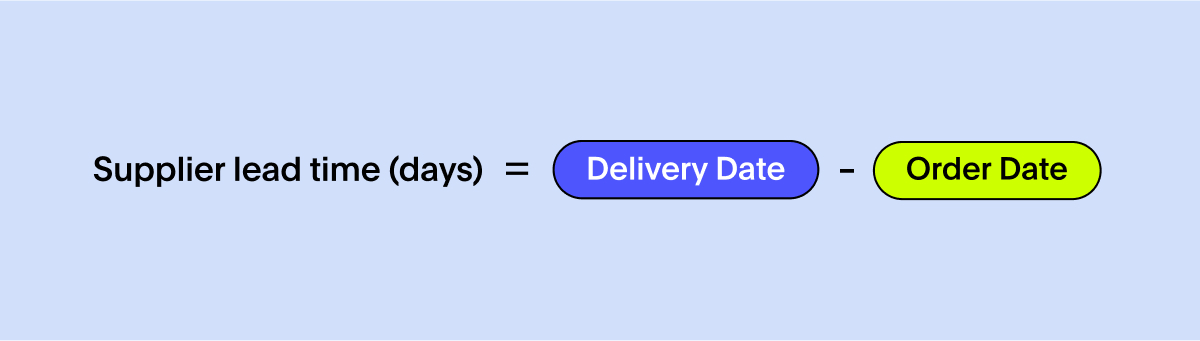
(viii) Supplier lead time
Supplier lead time measures the time it takes for a particular supplier to deliver ordered products or materials. Doing so will allow you to establish clear quality expectations and benchmarks, leading to more favorable pricing terms and faster order fulfillment. In addition, accurate lead times allow you to synchronize incoming supplies with production schedules, providing a buffer against unexpected demand fluctuations.
By keeping a pulse on important purchase cycle KPIs—such as purchase order cycle time, cost per item, and more—you can hedge raw material costs, optimize logistics, and pinpoint areas that need further improvement.
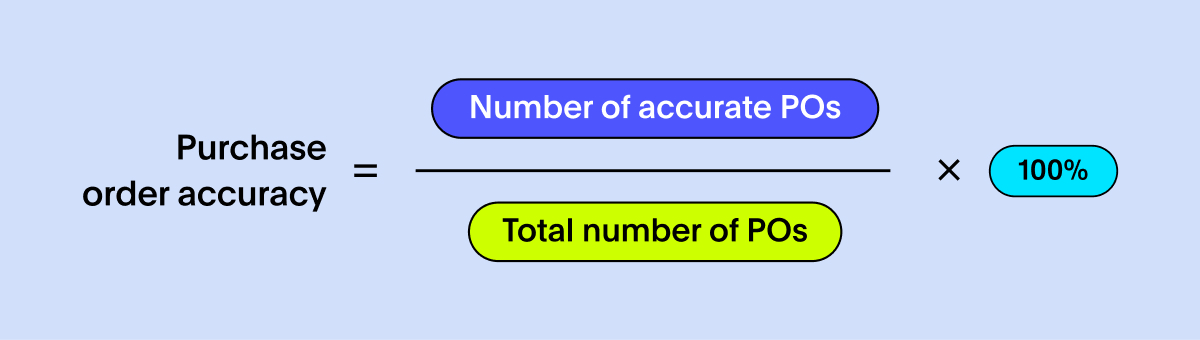
(ix) Purchase order accuracy
This procurement KPI assesses whether your suppliers are delivering the right goods at the right time according to the set requirements. Examining this metric helps you reduce rogue costs, minimize production discrepancies, and improve supplier relationships.
To calculate the metric, you determine the total number of accurate purchase orders (in terms of pricing, quantity, timeline, or quality) compared to the total number of purchase orders over a period.
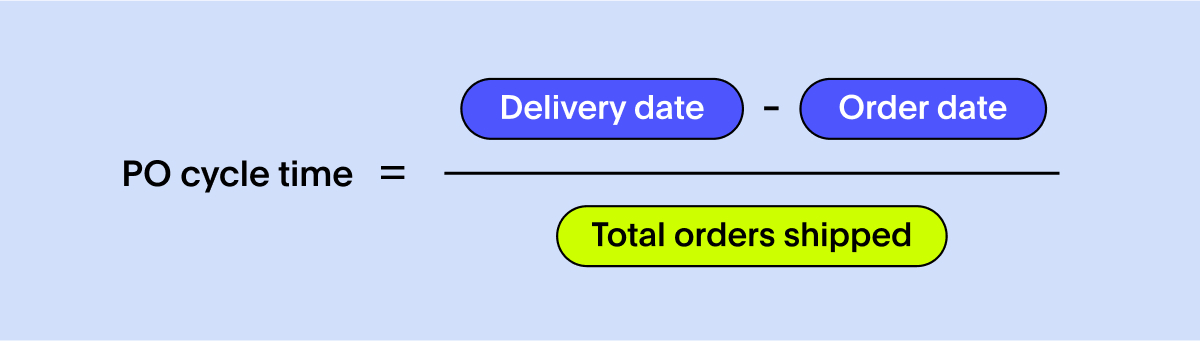
(x) Purchase order cycle time
Purchase order cycle time measures the total duration, it takes from order placement to order delivery. This procurement metric aids in reducing waste and helps streamline the procure-to-pay processes. To calculate purchase order cycle time, subtract the delivery date from the order date and divide it by the number of units produced.
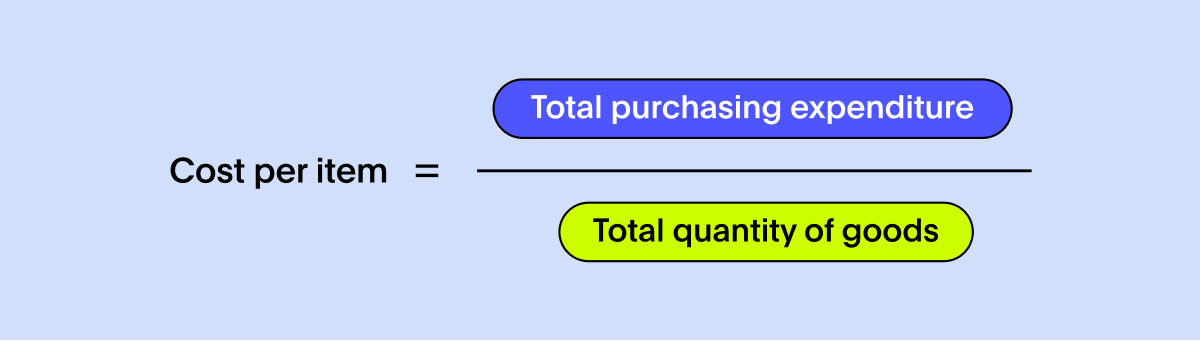
(xi) Cost per item
Cost per item measures the average cost of acquiring a single product. It includes all expenses related to purchasing, such as the purchase price, transportation, taxes, and more. This procurement KPI provides insight into the effectiveness of your demand forecasting and purchasing processes and allows you to compare it with past data to identify areas of improvement.
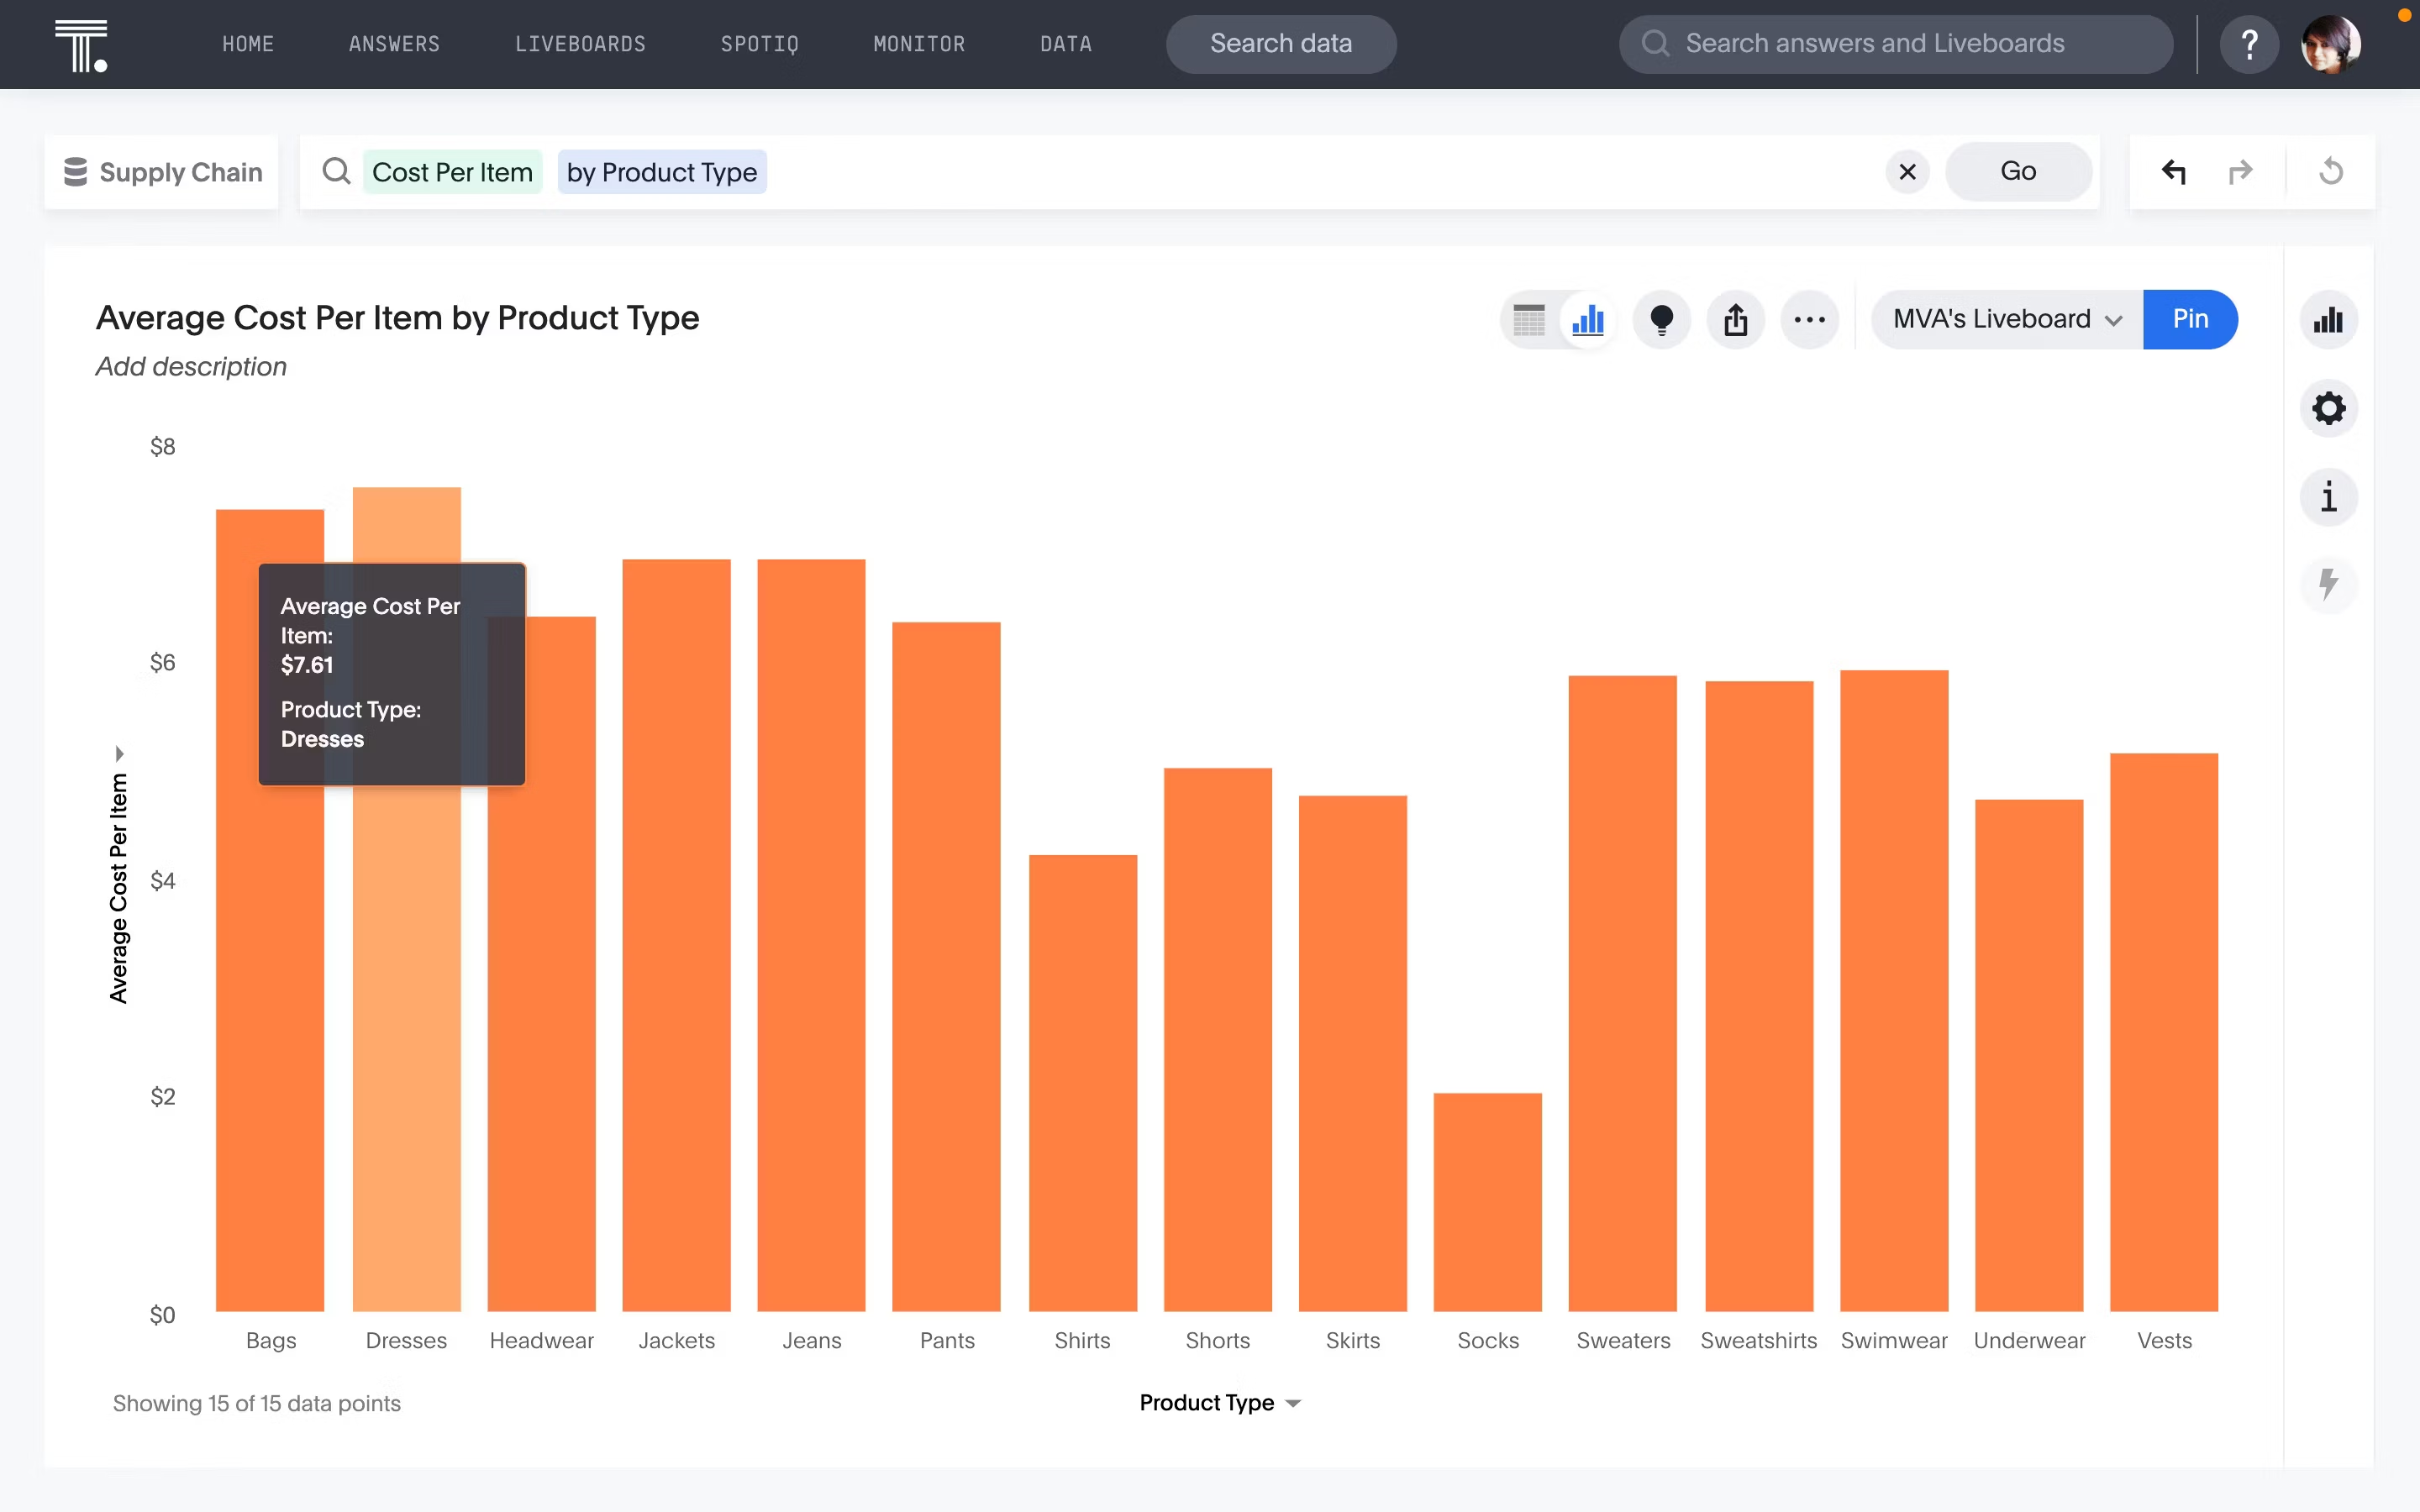
To measure cost per item, add up all your purchasing expenses—direct and indirect, and then divide it by the total quantity of goods ordered.
As the pressure to boost productivity and drive innovation increases, procurement leaders are turning to derive value from their data. For instance, by leveraging ThoughtSpot’s AI-Powered Analytics, one of the largest American fast-food restaurant chains, Chick-fil-A, was able to gain visibility into its supply chain and sourcing operations and boost efficiency.
With a self-service procurement analytics tool like ThoughtSpot, every user—even those with technical skills can build their own interactive Liveboards and gain AI-enhanced insights, helping them make data-driven decisions at scale.
Want to see this for yourself? Sign up for a ThoughtSpot demo and uncover insights that can transform your procurement and sourcing operations for the better.


