


How do successful businesses know whether they're actually succeeding? The answer is key performance indicators, or KPIs. These are the specific measurements that tell you if your business is moving in the right direction—like tracking your revenue growth, how many customers you're keeping, or how quickly you're resolving support issues.
Without KPIs, you're essentially running your business on gut feelings or on numbers that may not measure what matters most.
This guide breaks down what KPIs are, why they matter, and how to choose and track the right ones for your business, with practical examples you can start using today.
What are key performance areas and key performance indicators?
Key Performance Areas (KPAs) are the broad, strategic parts of your business where results matter most, like sales, customer satisfaction, or operational efficiency.
Key Performance Indicators (KPIs) are the specific, measurable metrics you use to track how well you're performing within those areas.
Pro-tip: Think of KPAs as the destinations on your map and KPIs as the GPS coordinates telling you if you're on the right track.
Understanding what a KPI is and how it connects to key performance areas helps you focus your entire team on the same goals. As Serena Huang, Global Head of People Analytics at Kraft Heinz Company, puts it: “You can't improve what you don't measure.” This insight comes from her experience retaining top talent with people analytics.
KPA vs KPI: What's the difference?
While they work together, KPAs and KPIs do different jobs. Here's how they compare:
|
Aspect |
Key Performance Area (KPA) |
Key Performance Indicator (KPI) |
|
Scope |
A broad, strategic business area |
A specific, quantifiable metric |
|
Purpose |
Defines what to focus on |
Measures how you are performing |
|
Example |
Customer Satisfaction |
Net Promoter Score (NPS) |
|
Question it answers |
"Where do we need to excel?" |
"Are we excelling in that area?" |
A popular way to align your KPAs is with the four perspectives of the Balanced Scorecard framework:
Financial: Revenue growth, profit margins, cost management
Customer: Satisfaction scores, retention rates, loyalty metrics
Internal Process: Operational efficiency, quality measures, cycle times
Innovation and Improvement: Employee development, innovation metrics, knowledge management
The Balanced Scorecard works because it forces you to look beyond just financial results. When you only track revenue and costs, you miss the operational inefficiencies and customer problems that can eventually hurt your bottom line.
By measuring across all four perspectives, you spot issues early—like declining employee performance or slipping process quality—before they impact revenue.
Start Getting Better Insights
Four types of key performance indicators
KPIs can fulfill several different core roles in how you evaluate your business, and understanding these distinctions helps you build a complete picture of your performance.
1. Quantitative vs. qualitative
Quantitative indicators are the hard numbers that tell you what is happening:
Monthly recurring revenue: The predictable income your business generates each month from subscriptions or contracts, helping you forecast growth and financial stability.
Website conversion rate: The percentage of visitors who complete a desired action like signing up or purchasing, revealing how effectively your site turns traffic into results.
Number of support tickets closed: The total customer issues resolved in a given period, indicating your team's productivity and responsiveness to customer needs.
Qualitative indicators are descriptive and help you understand the why behind the numbers:
Customer satisfaction feedback: Open-ended responses and comments that reveal how customers feel about your product or service, uncovering pain points that numbers alone can't show.
Employee morale ratings: Sentiment data from surveys or interviews that gauge workplace culture, engagement levels, and potential retention risks before they impact performance.
Brand perception surveys: Qualitative insights into how your target audience views your brand's reputation, values, and market position compared to competitors.
2. Leading vs. lagging
Leading indicators are predictive metrics that forecast future outcomes:
Number of sales demos booked: The volume of scheduled product demonstrations with prospects, signaling potential future deals and helping you predict upcoming revenue before contracts are signed.
Website traffic trends: Patterns in visitor volume and behavior over time, indicating growing market interest and potential customer demand before it converts into actual sales or sign-ups.
Marketing qualified leads: Prospects who've shown genuine interest through specific actions like downloading content or attending webinars, and predicting which contacts are most likely to become customers.
Lagging indicators measure past performance and confirm results:
Annual revenue: The total income your business generated over the past year, confirming whether your strategies successfully drove growth and met financial targets.
Customer churn rate: The percentage of customers who stopped using your service in a given period, revealing the effectiveness of your retention efforts after the fact.
Employee turnover: The rate at which employees leave your organization, indicating past workplace satisfaction and the success of your retention initiatives once departures have already occurred.
A strong KPI management strategy weaves together all four types to give you a complete picture. Use quantitative indicators for baseline numbers, qualitative for context behind the figures, leading indicators as your early warning system, and lagging indicators to validate results.
This combination transforms isolated data points into a cohesive narrative about where your business has been, where it's going, and what to do next.
💡 Check out the top KPI examples that every business needs to measure.
KPI examples by department
The right KPIs depend entirely on your business goals and the department you're measuring. Here are some common key performance indicator examples to get you started:
Sales KPIs
|
KPI |
What it measures |
|
Sales growth |
Tracks revenue increase or decrease over time. |
|
Average profit margin |
Measures the profitability of your sales |
|
Customer lifetime value (CLV) |
Predicts total revenue per customer |
|
Win rate |
Percentage of deals closed successfully |
|
Pipeline coverage |
Ratio of pipeline value to sales targets |
Discover more sales KPIs and find new perspectives on your entire sales pipeline.
Marketing KPIs
|
KPI |
What it measures |
|
Customer acquisition cost (CAC) |
The total cost to acquire a new customer. |
|
Return on marketing investment (ROMI) |
Revenue generated per marketing dollar spent |
|
Marketing qualified leads (MQLs) |
Leads deemed ready for sales |
|
Conversion rate |
Percentage of visitors who take desired actions |
|
Brand awareness |
Recognition and recall metrics |
Explore our full list of marketing KPIs, too—it’s a great opportunity to find new ways of seeing business intelligence.
Customer Success KPIs
|
KPI |
What it measures |
|
Net Promoter Score (NPS) |
Customer loyalty and recommendation likelihood |
|
Customer satisfaction score (CSAT) |
Happiness with specific interactions |
|
Customer churn rate |
Percentage of customers who stop using your service |
|
First contact resolution (FCR) |
Issues resolved on first interaction |
|
Average resolution time |
Time to resolve customer issues |
Finance KPIs
|
KPI |
What it measures |
|
Operating cash flow |
Cash generated from normal business operations, indicating financial health and ability to fund growth |
|
Gross profit margin |
Revenue remaining after subtracting the cost of goods sold, showing pricing power and production efficiency |
|
Return on investment (ROI) |
Profitability of investments relative to their cost, helping prioritize resource allocation |
|
Accounts receivable turnover |
How quickly you collect payments from customers, revealing cash flow efficiency and credit policy effectiveness |
|
Burn rate |
The rate at which you're spending cash reserves, critical for startups and growth-stage companies to manage runways |
Operations KPIs
|
KPI |
What it measures |
|
Order fulfillment cycle time |
Time from order placement to delivery, measuring operational efficiency and customer experience |
|
Inventory turnover ratio |
How often inventory is sold and replaced, indicating demand forecasting accuracy and working capital efficiency |
|
Overall equipment effectiveness (OEE) |
Manufacturing productivity combines availability, performance, and quality to identify improvement opportunities |
|
Defect rate |
Percentage of products or services that fail quality standards, revealing process control and training needs |
|
Capacity utilization rate |
Percentage of potential output actually being produced, showing how efficiently you're using available resources |
How to choose the right KPIs for your business: 6 best practices
What makes a good KPI?
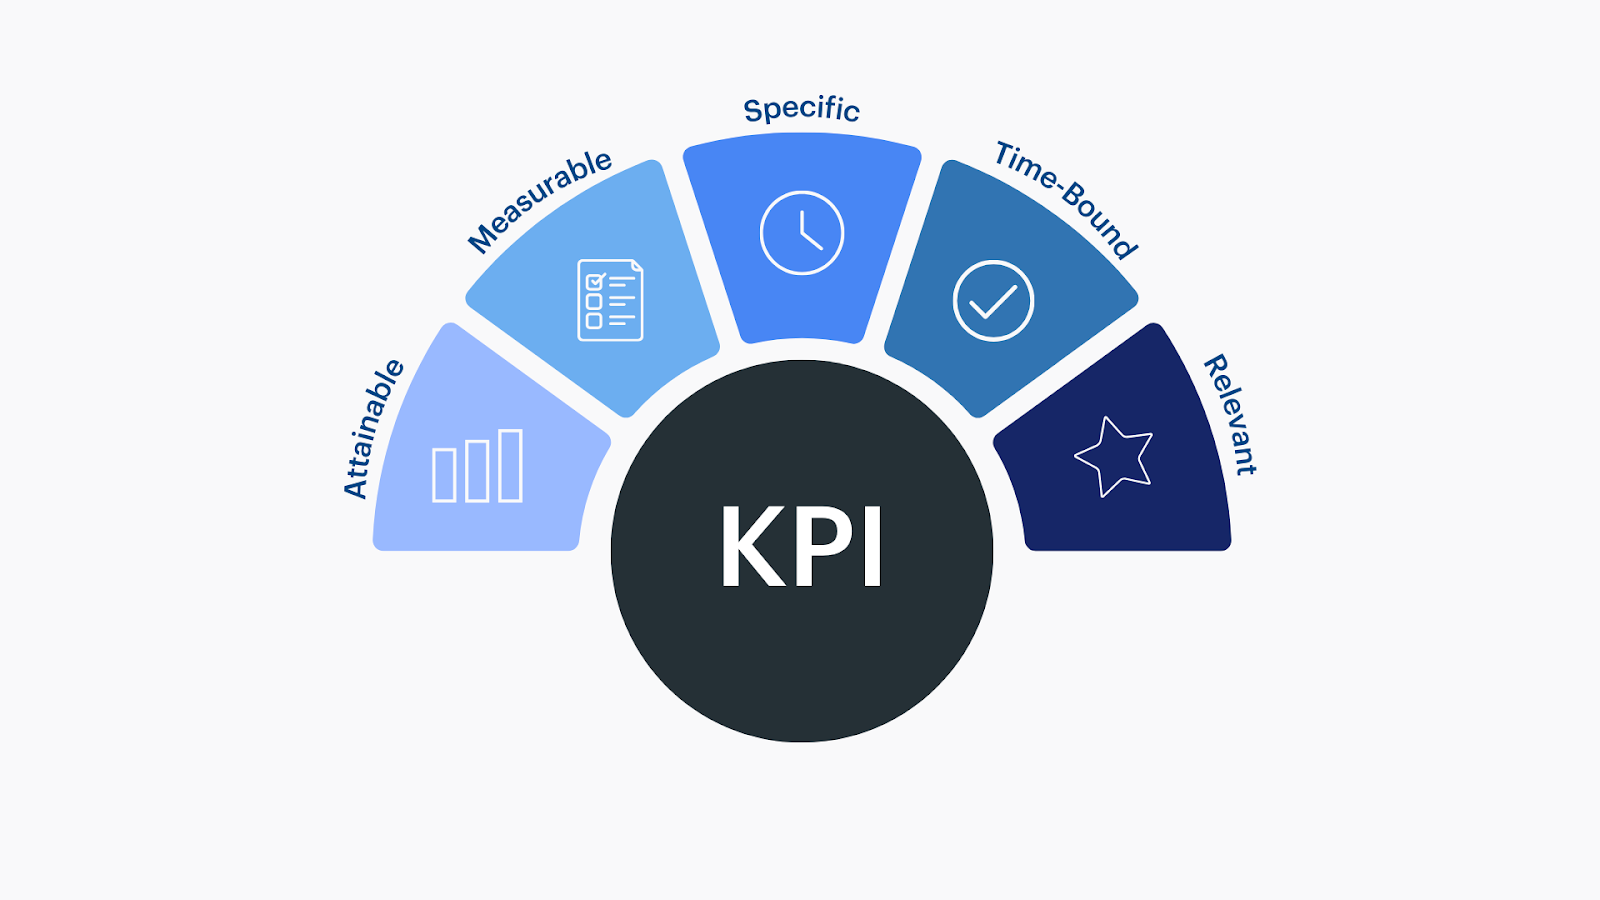
Your KPIs need to be: attainable, measurable, specific, time-bound, and relevant.
But what works for one business won't necessarily work for another. Your industry, business model, and growth stage all shape which metrics actually matter. Daniel Seymore, Head of Business Intelligence at Investec, identifies the key: "You need to be explicit and explain the 'why' in business terms." This clarity is essential for developing domain expertise across your organization.
Here's how to identify the right KPIs for your specific situation:
1. Clarify your strategy and outcomes
Start with your business objectives—OKRs or strategic goals. Your KPIs should directly support these outcomes, not just track activity.
2. Choose your key performance areas
Select 3-4 KPAs aligned to strategy using the Balanced Scorecard: Financial, Customer, Internal Process, and Learning & Growth perspectives.
3. Define KPIs for each KPA
Assign 3-5 specific KPIs per area. Document the owner, measurement frequency, and data source for each metric.
4. Baseline and set targets
Establish current performance, then set thresholds: green (target met), amber (warning), and red (action required) based on industry benchmarks.
5. Instrument data and build your Liveboard
Centralize metric definitions in a metrics layer, using a data studio solution like ThoughtSpot Analyst Studio to create governed, reusable data models everyone can trust.
6. Review, alert, and iterate
Monitor your mix of leading and lagging indicators. Set up alerts for threshold breaches and refine KPIs quarterly based on results.
To see how this works in practice, here’s a quick demo from Nicholas Rentz, Senior Principal Product Manager at ThoughtSpot, showing how AI Highlights automatically surface changes in your KPIs:
Common mistakes to avoid when setting KPIs
1. Tracking too many KPIs
When you track everything, you might end up focusing on nothing. Stick to a handful of important KPIs for each KPA that directly reflect your strategic goals. Too many metrics create noise and dilute attention from what truly drives your business forward.
2. Choosing vanity metrics
Vanity metrics like social media followers or page views look impressive, but don't always connect to business outcomes. Always ask: "Does this metric help me make a better decision?" If the answer is no, it might just be noise distracting you from what matters.
3. Forgetting ownership and targets
A KPI without an owner is a recipe for inaction. Each KPI should have a designated person responsible for monitoring it and clear thresholds for what "good" looks like. This is a great opportunity to give business unit leaders a chance to show that they understand how their performance contributes to the company's mission.
4. Relying on static dashboards that become outdated
Static KPI dashboards become outdated the moment they're published, creating bottlenecks where people wait days for analyst help. Modern analytics platforms change this entirely, as Wellthy discovered when they replaced their old dashboard system with Liveboards from ThoughtSpot. The end result was a 351% ROI and a doubling of their analytics team's output velocity.
5. Overwhelming people with data instead of actionable insights
Too much data without context paralyzes decision-making. Radha Sankaran at Verizon explains on The Data Chief how she makes it her goal to distill insights into the next best action, rather than throwing numbers at her team. Make sure your team understands KPI meanings and how to apply them to improve their performance where it counts the most.
6. Making KPI tracking a passive, one-way activity
KPI tracking is moving beyond passive tracking into active inquiry. One major driver of this trend is the fact that modern platforms like ThoughtSpot let you submit queries in natural language. If a KPI sparks a question, use Spotter, ThoughtSpot's AI analyst, to simply type your question, get an answer, and make KPI analysis an active conversation.
Turn your KPIs from static reports into active conversations
KPIs are much more than just numbers on a dashboard; they're the pulse of your business. But to feel that pulse, you often need to move beyond what traditional BI platforms offer.
If you're still relying on static dashboards that require analyst help for follow-up questions, you're creating bottlenecks and delays. With ThoughtSpot, you and your team can dig into the data behind the numbers, ask follow-up questions, and get trusted answers in seconds.
Ready to see it for yourself? Start your free trial and experience how you can make accurate, actionable KPI measurement a centerpiece of your business strategy.
Frequently asked questions
What is the difference between key performance areas and key performance indicators?
Key Performance Areas (KPAs) define broad strategic business domains where you need to excel, while Key Performance Indicators (KPIs) are specific, measurable metrics that track your performance within those areas. KPAs set the focus, KPIs provide the measurement.
How many KPIs should you track for each business area?
It’s a good idea to track 3-5 KPIs per key performance area to maintain focus and avoid information overload. Too many metrics can increase, rather than reduce, the difficulty of making decisions.
What makes a good KPI different from a regular business metric?
Regular metrics may be interesting or provide valuable insights, but they don't necessarily guide immediate decision-making.
Can you use the same KPIs across different industries?
While some KPIs like revenue growth or customer satisfaction apply broadly, the most effective examples are often tailored to your specific industry, business model, and strategic objectives.


