For years, the business intelligence industry has promised not only to make businesses smarter, but empower them with self service reporting insights from corporate data. Every major analytics player has proffered solutions, backed by expensive marketing campaigns, claiming to finally deliver self service once and for all.
Why then, has adoption and usage of these self-service technologies hovered at an abysmal 21%, for the past 10 years, despite enterprise spend on data and analytics technology soaring to $210B by 2020? To me, the answer is as obvious as it is painful for the industry to admit: we’ve been solving the wrong problem.
Query Variation is Harder – and More Important – Than Complexity
For decades, the builders of analytics technology and the businesses they have sought to serve have been focused on solving the complexity part of the equation. Can the product answer the most complex question we as IT leaders can ask or think the business will ask? In the bid to answer these questions, business analytics software vendors built platforms that could handle increasingly more complex questions.
The problem is that the biggest self-service challenge is the variation of the questions, not the complexity. Ask any data analyst or BI power user and they will tell you, it's not the complexity of questions that they struggle with - it’s the volume of questions from business people, all with slight variations, that really bogg them down.
Because BI tools have been designed to handle the most complex questions, they have been built with complex drag and drop UIs and hundreds of buttons to achieve that objective. As a result, regular business people can’t use them, or don’t have the patience to invest 3-5 days in the training required to use them. Thus, because they can’t ask the most basic questions of the system themselves, they give up entirely. Which is why “self service” technologies have been dead on arrival for all but the most technically inclined.
Playing Powerball is a Losing Strategy
The odds of winning the Powerball lottery are very low. Like 1 in 292,000,000 low. Meanwhile, the odds your pre-built reports and dashboards are going to answer all the questions your business users are going to ask are way worse.

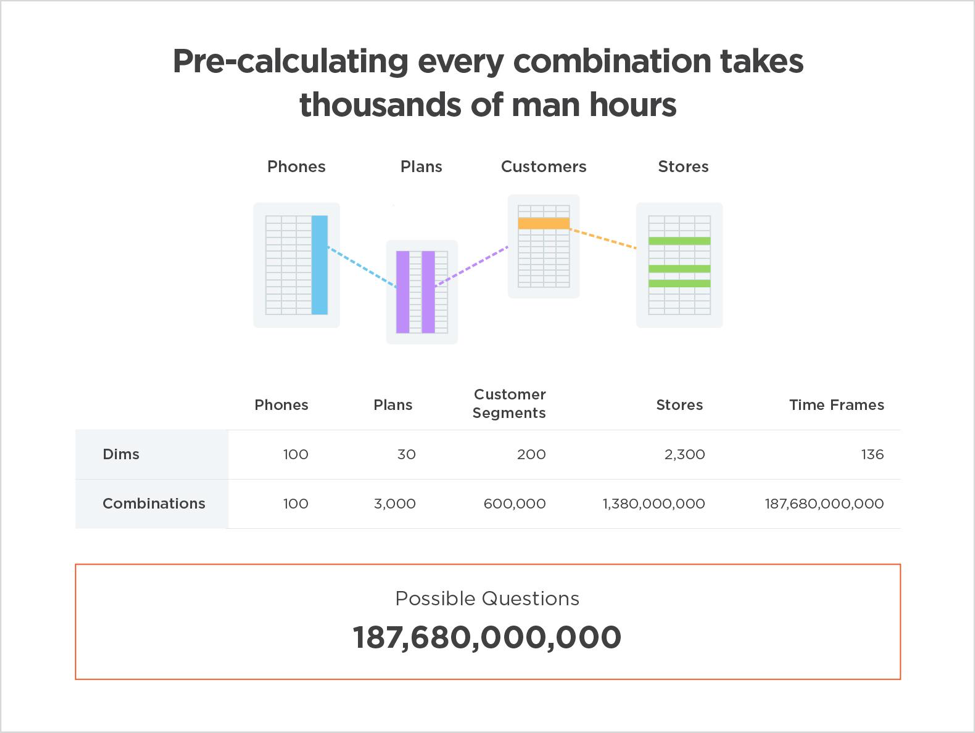
The reason is simple: there are too many possible variations of questions your business colleagues can (and should!) ask of your data. It’s the variety of questions, not the complexity of questions that frustrates both business people and analytics teams charged with answering these questions for the business. Just think: for every possible combination of variables - like every product you sell, payment plans for those product, dates of sale, demographics, and sale locations - there can be a corresponding question. That’s billions of possible combinations.
Building the right report or dashboard that answers the exact right question – out of billions of potential questions – is as likely as winning a Powerball lottery.

And how many of you have won the lottery?
Almost every data and IT leader I talk to, regardless of industry, is still playing the odds, relying on IT generated insights to answer questions from the broader business.
Every Industry is Facing the Same Terrible Odds
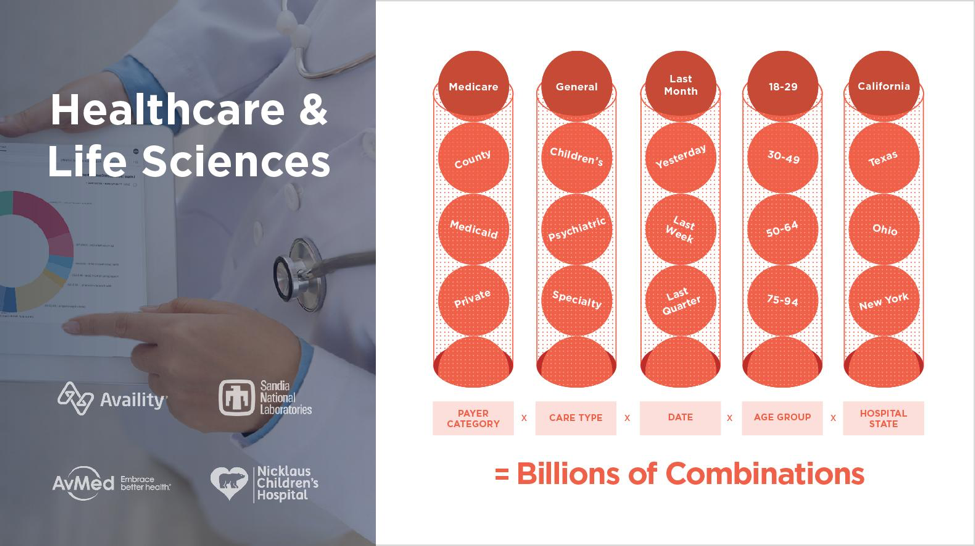
Look at the healthcare and insurance industry. The questions insurance professionals, hospital administrators, and providers can ask come with substantial variables. Providers, patients, admittance date, type of event, and specific practitioner interactions all contribute to the variation overwhelming most healthcare analytics teams.

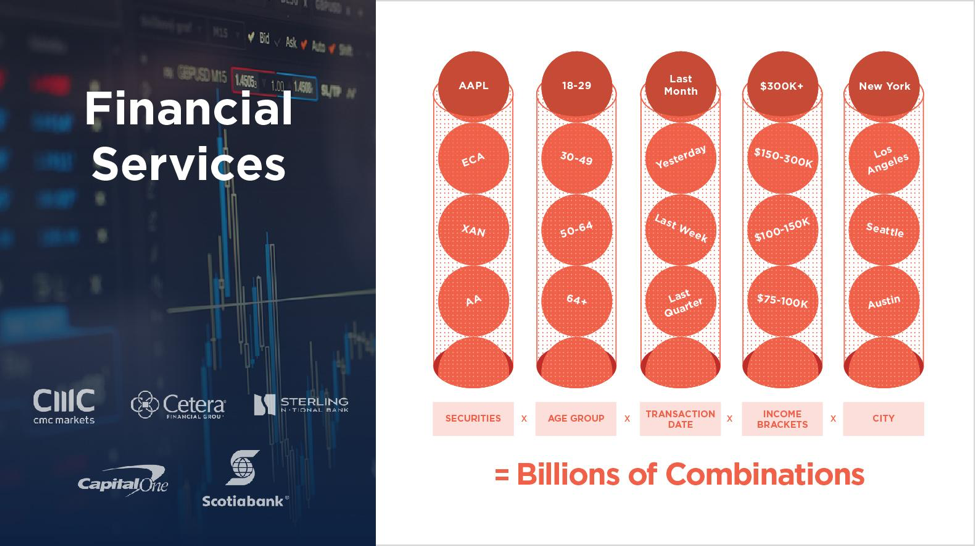
Financial services, too, faces an overwhelming number of potential questions due the many variables they analyze. Everything from billions of credit card transactions, products and categories to income brackets to customer demographics must be considered. There’s no way IT generated BI reports and dashboards can answer all the possible combinations of questions that arise when looking at each of these variables.

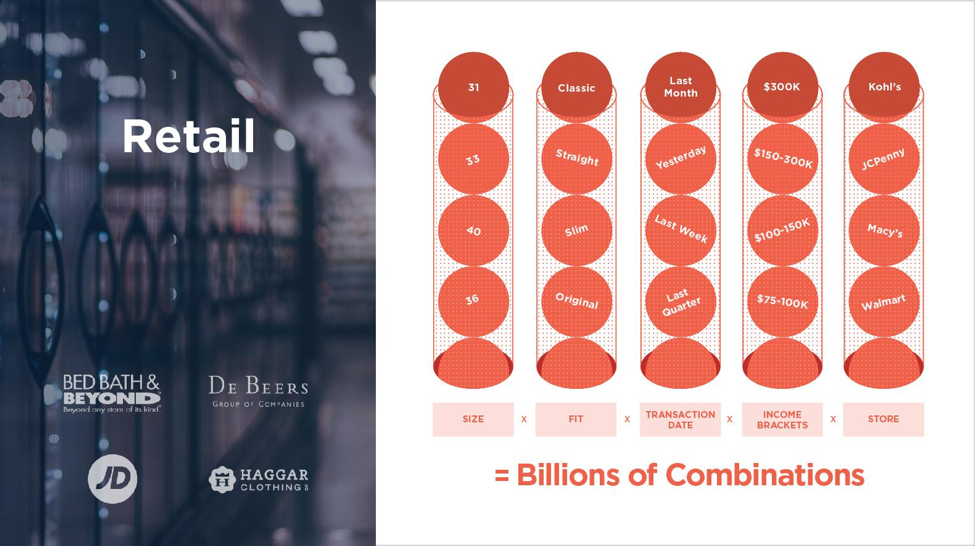
There’s perhaps no industry with a clearer Powerball problem than retail. Think about a large phone retailer for example. With hundreds of products, different brands, customer segments, store locations, and plan types, there are billions and billions of potential questions business users can ask. And unless retailers plan to do nothing but generate reports, legacy approaches to data simply cannot address them all.

Put the Self-Service Odds Back in Your Favor - with Search
Luckily, there’s a major shift happening. Both data leaders and technology builders have recognized they must empower domain experts and business users with the ability to answer their own questions if they want to solve the variation problem.
At ThoughtSpot, we’ve created the world’s first answer engine, powered by technology every single one of us uses daily in our personal lives: search. With search-driven analytics, business users can find insights on their own via a search bar. Our business intelligence platform was built from the bottom-up to execute each search instantly, by combing through through billions of rows, automatically combining datasets and tables, and returning answers instantly. Finally, business users can get analytics at the speed of thought.
This doesn’t just benefit your non-technical business people. Data teams, free from the shackles of endless report generation, have the bandwidth and resources to embark on the work they have been hired to perform, like data modeling, ETL, advanced and predictive analysis, that are all critical differentiators for the long term success of today’s enterprise.
So, are you going to continue gambling with your analytics? Or is it time to take out the guesswork, and truly bring self service analytics to every employee?
If you’re ready to stop playing Powerball, let’s talk about how ThoughtSpot can help. Sign up for a 1:1 demo today!


