“The pessimist complains about the wind; the optimist expects it to change; the realist adjusts the sails.” - William A Ward.
I start with this timeless quote from William A. Ward, because if there was ever a time to be a realist, it is now. We’ve all seen the headlines around COVID-19. They’re enough to scare you witless. But the data tells an even scarier story. If we don’t choose our course appropriately right now, the consequences are going to be devastating.
This is the defining moment of our generation. COVID-19 has the potential to kill 2-3% of our population, cripple the global economy, and bring healthcare systems around the world to their knees. It will take all of us working together to solve this crisis.
While doctors, nurses and other healthcare professionals are fighting this on the frontline we believe technologists and innovators have an equally important role to play here and this article is the call to arms for them.
Going beyond analytics
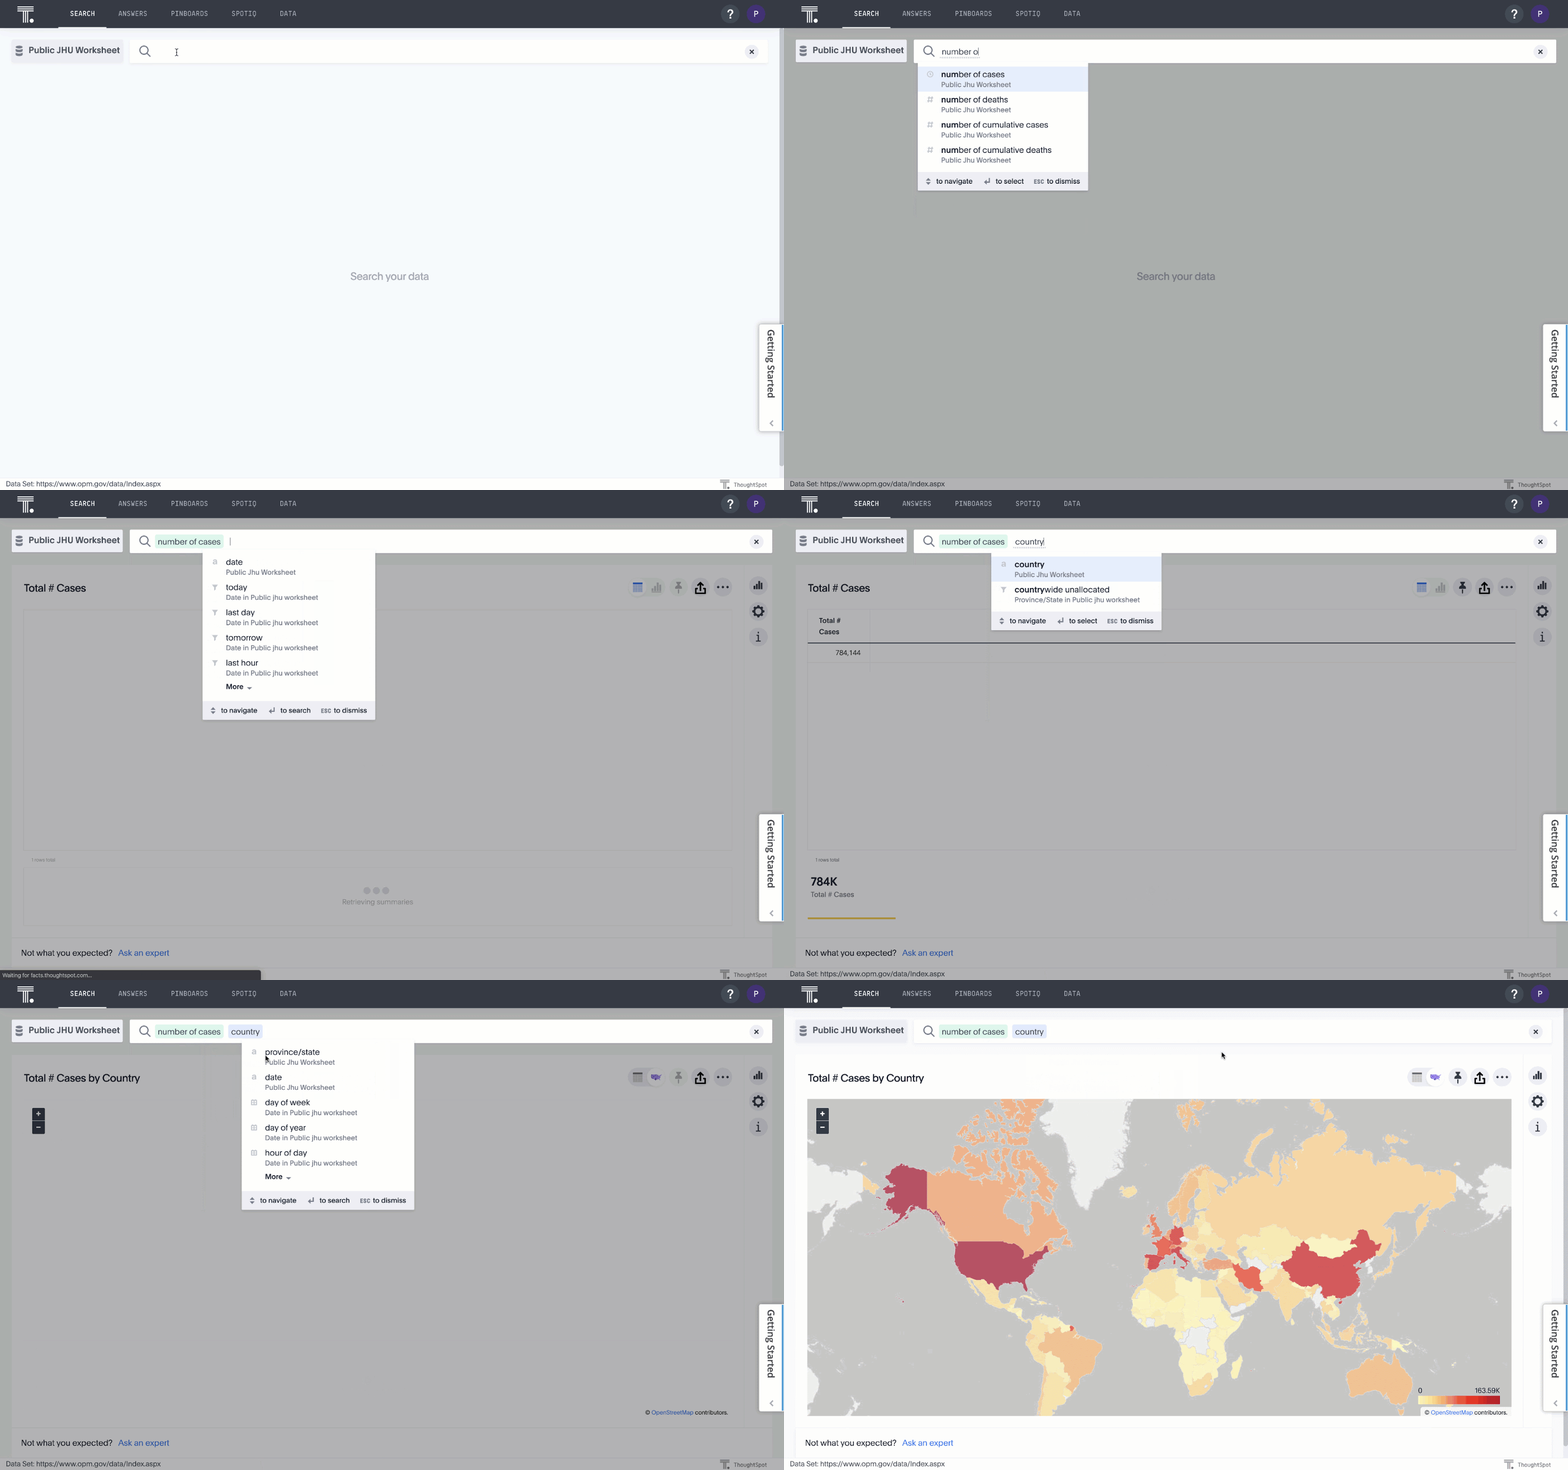
As a search and AI-based analytics company, we’ve created an instance to analyze data related to COVID-19, which you can search to find answers to your questions about the spread of the disease.

But we want - and need - to do more. A number of us have read the articles about social distancing and flattening the curve, but very few people understand how our choices can make a difference to the spread in precise terms. That’s why we built a mathematical model for understanding various scenarios that may occur for different durations of shelter-in-place. It includes an algorithm we created that computes an optimal schedule for shutdown based on two different strategies to either contain or mitigate the impact of COVID-19.
Two different strategies: Contain vs. Mitigate
There are two strategies to deal with epidemics. Containment means we reduce the spread of the disease to a point that the number of infected people starts to steadily decline and we eventually eliminate the disease without infecting a large number of people. The most successful strategy here is to shut down for a significant period of time. This is similar to the approach taken in China. To work, this requires either global cooperation or countries to seal themselves off from the outside world. Meanwhile, with a mitigation strategy, we don’t stop the spread of the disease, but we slow it down enough so as not to overwhelm our healthcare systems and maintain adequate resources for hospitalized patients. This has also been referred to as flattening the curve. With the mitigate strategy, we effectively shutdown and reopen society repeatedly to throttle the spread of the virus.
TL;DR - Scenario Summary
With this model, it’s possible to forecast the impact on mortality based on differing lengths of shutdown in conjunction with other parameters like virus reproduction rate, available ventilators, and more.
Currently, a lot of people are hoping that we will be able to end social distancing in a few weeks and get back to normal. The model shows that could not be farther from the truth.
We’ve modeled 4 potential scenarios, including:
Aggressive Shutdown: Aggressive social distancing and continued shutdown for 9 weeks
Weak Shutdown: Limited social distancing with a shutdown lasting 15 weeks
Multiple, Short Shutdowns: Multiple, short shutdowns with limited social distancing
Weak Shutdown + Treatment: Very limited social distancing with the introduction of a treatment vaccine after 5 months
You can make your own assumptions using this COVID-19 Shutdown Forecast App. It was built by one of ThoughtSpot’s engineers, Ashish Shubham. It is important to note that this model was built not by epidemiologists or experts in healthcare, but by a couple of computer scientists based on the data available in the public domain.
Terminology & Assumptions
Before we get into some potential scenarios forecasting mortality based on lengths of shutdowns, we need to establish some basic terminology, as well as the assumptions we’ve made for our scenarios. You can change these assumptions in the app to model different scenarios yourself.
Reproduction Rate (R0): This is the most important number to understand. This measures the rate of reproduction of a disease from one infected individual to another. R0 essentially tells you if the entire population was susceptible to infection, on an average how many additional people will get infected by one infected person. Having R0 > 1 means disease spreads exponentially. Having R0 < 1 means, disease dies down quickly.
Assumption for this blog: R0 is 2.2 with no social distancing. In the early days in China R0 was reported to be around 2.2 in literature. During shutdown, we’ve modeled out various scenarios of R0 ranging from 0.3 to 1.0, which you can see has a radical impact on the results.
Hospitalization Rate: This measures how many people who are infected will end up requiring admission to a hospital.
Assumption for this blog: 15% of infections, based on data from China, with admissions happening 14 days after exposure and lasting for 7 days.
Mortality Rate: This measures how many people will die as a result of infection
Assumption for this blog: 0.5% for those hospitalized with ventilators and other equipment capacity, 3-5% for those hospitalized with ventilators and other equipment overcapacity.
Generation Time: This is the time it takes to transmit the disease from one person to another. Various estimates put this between 5-8 days. For this model, we will assume this to be 7 days.
Assumption for this blog: 7 days
Herd Immunity: When a large fraction of the population becomes immune to the disease then it is hard for the disease to spread fast to the remaining population. This can happen either because they are vaccinated against the disease or because they got infected and recovered and now have immunity (in our model we have assumed no recurrent infections occur, but it can happen if the virus mutates). For complete herd immunity, we need to have at least (1 - 1/R0 ) fraction of the population immunized. The reason for this is that the rate of spread is the product of the reproduction rate and fraction of the population that can be infected. For herd immunity, we need this product to be less than 1.
Assumption for this blog: 55% of the population immune to create herd immunity
Forecasting the Optimal Shutdown Schedule
One of the main questions on everyone’s mind is how long do we need to keep the shutdown so that COVID-19 is a thing of the past. Everyone from the President to our neighbors are debating this. So, we looked at four scenarios using our model.
Scenario 1: Aggressive Shutdown

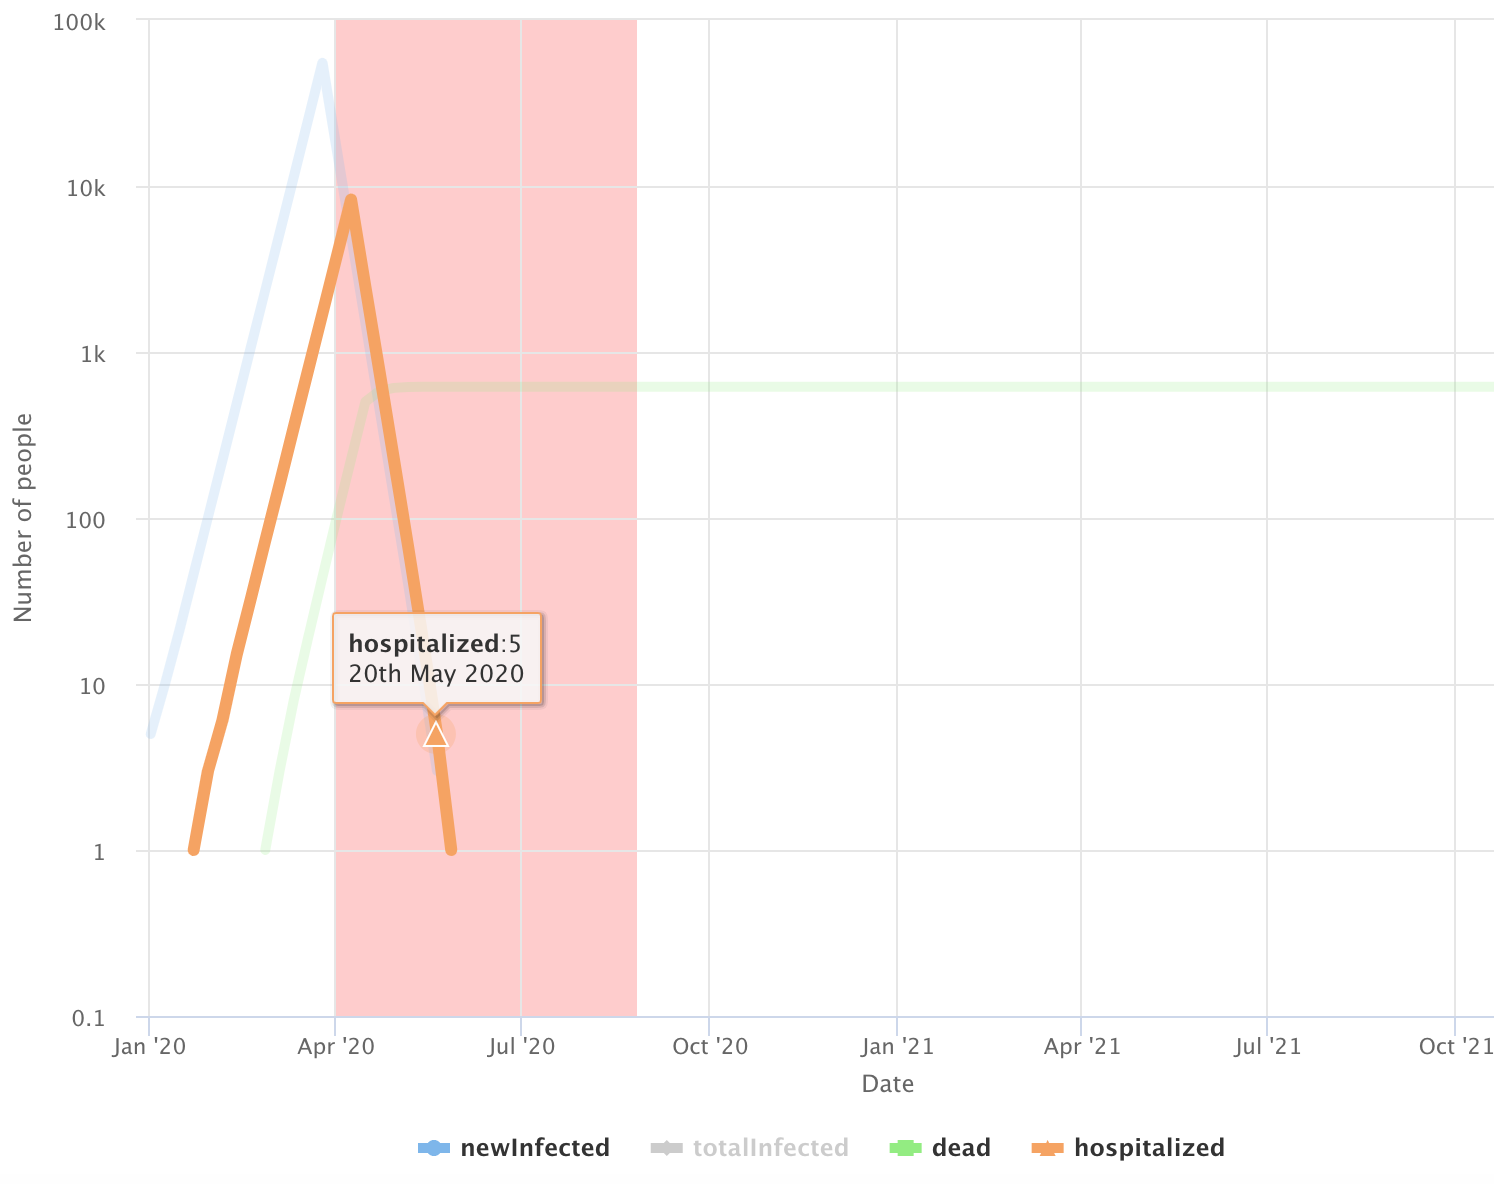
In this scenario, we assume we can reduce the R0 to 0.3 with aggressive and widespread social distancing from shutdowns. This would likely require an approach like China, with strong enforcement, contact tracing, and quarantining all international arrivals. This is the best case scenario where our measures are so effective that every 3 infections only leads to one new infection. And even still, this would require us to shutdown for 9 weeks (shutdown period is represented above by the red shaded area) to drive the number of new cases to zero. In this scenario, the number of additional deaths is contained to a few hundred. However, this does not give us herd immunity and we will remain susceptible to any new imported cases, which would restart the whole process again. To stay Covid-19 free, we would need tight control on immigration and vigilance around identifying and isolating any possible new cases.
Scenario 2: Weak Shutdown

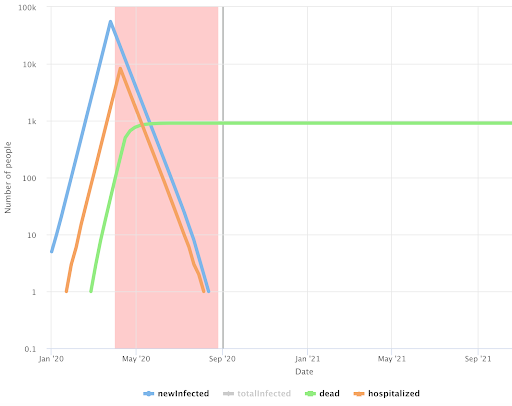
In this scenario, we also model prolonged social distancing, but a less aggressive (and more realistic) version than Scenario #1. Here R0 is increased to 0.5, which is still better than what’s happening in most US cities. In this scenario, we would need to shutdown for roughly 15 weeks to eradicate the virus. And just like in Scenario #1, here we must also be extremely vigilant against new imported cases.
Scenario 3: Multiple, Short Shutdowns

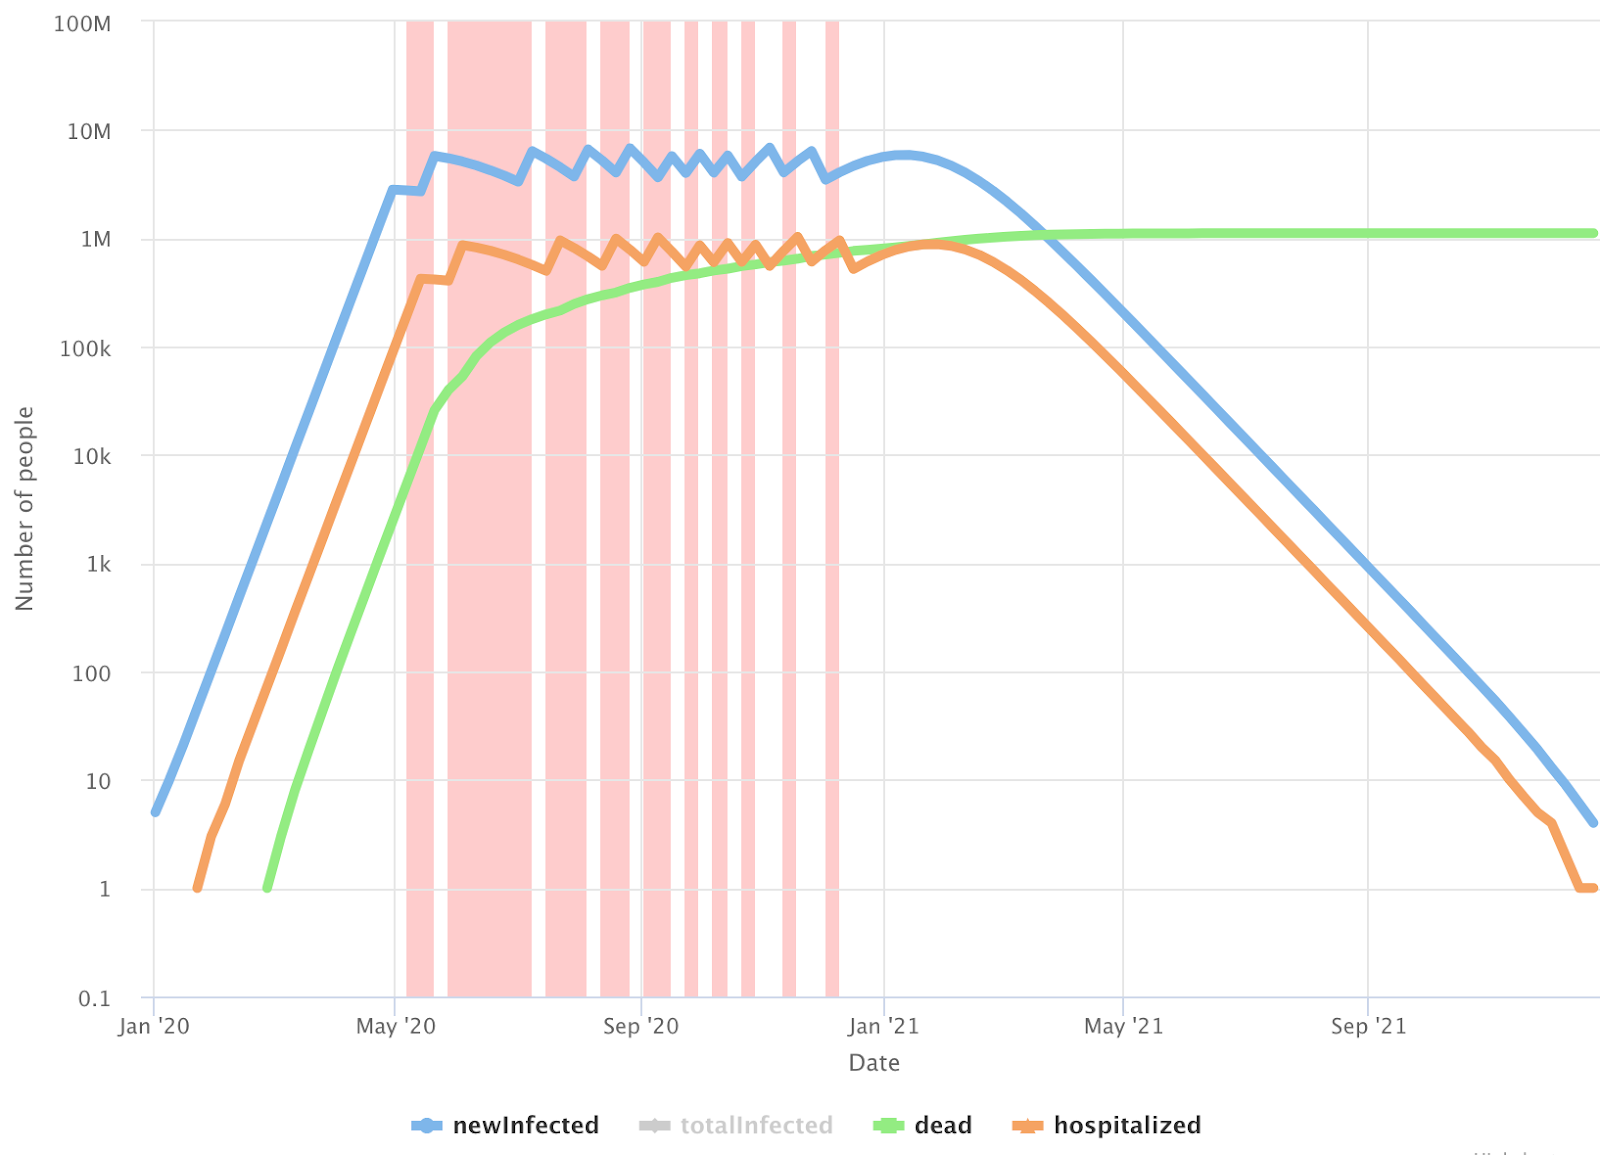
Here we assume R0 increases to 1.0, which is our best estimate as to what’s happening in cities in the United States where social distancing is being practiced. In this scenario, containment is no longer possible and mitigation is the only option (also referred to as flattening the curve). In order not to overwhelm our hospitals, we would need multiple shutdowns of varying lengths until we can reach herd immunity at 55% of the population having been infected. While the exact lengths of each shutdown may vary, this is the most likely scenario to unfold based on current policy.
In this scenario we assume we can create about one million hospital beds for COVID-19 patients. Based on this article, there are around 850K hospital beds in the US. A large fraction of these beds are usually occupied by non-COVID-19 patients (cancer patients, accidents, geriatric patients, surgical patients, etc.). We can increase capacity by building new hospitals, placing beds in hallways, and putting up tents around hospitals. Then there is the availability of healthcare workers to support the increased capacity. We may have to train a lot of people quickly to augment the current health care workforce. Based on different numbers being reported, 20-50% of admitted COVID-19 patients in hospitals need ventilators. The above article estimates that we have around 170K ventilators in US (counting ventilators that are currently in storage). To support these 1 million patients, we will need 200K-500K ventilators. We are going to be significantly short on those, but we are assuming the private sector will bridge the gap in time.
In this scenario, reaching herd immunity will take approximately 18 months. We are forecasting around 180 million people will get infected and around 27 million people become hospitalized. This scenario also requires shutdowns in aggregate of over 30 weeks. Despite doing this, we will still have about a million deaths.
Scenario 4: Weak Shutdown + Treatment Arrives

Here we assume the same social distancing efforts are in place as scenario #3 with an R0 of 1.0, but we introduce an early breakthrough in the development of a treatment.
In this scenario, we assume that this new treatment helps in three ways:
Hospitalization rate falls by a factor of three, from 15% to 5%
Mortality rate for patients goes down from 0.5% to 0.3%
Mortality rate in case of overburdened hospitals goes down from 3% to 1.5%
In reality, a treatment may have a very different impact on outcomes, but these seem like a reasonable scenario to simulate.
In this case, we may have a choice to make. We could look to achieve herd immunity sooner by letting the hospitals reach capacity before the treatment is available. In that case, we would experience 0.5% mortality until the treatment arrives, then it would decrease to 0.3%. This decision would reduce the length of the shutdown, but lead to more deaths. Alternatively, we could continue the shutdown until the treatment is available. We’d then manage the disease so the number of hospitalizations remains just below capacity. This would result in a longer shutdown, but with fewer deaths overall. In scenario #4, we chose to extend the shutdown to save more lives, and our model predicted around 750,000 deaths.
Test your own scenarios
We have looked at a number of scenarios, varying mortality rates, varying R0, considering the number of current ventilators as the constraints. The qualitative story does not change, but numbers do change. You can set your own parameters and model these scenarios in the COVID-19 Shutdown Forecast App.
Limitations of this Model:
R0 variations: We assume R0 is fixed for shutdown state and fixed for non-shutdown stage. But a number of factors including temperature, cultural habits can change it.
Modeling Ventilators and ICU beds: Currently the situation is more dire and the bottleneck is not hospital beds, but ICU beds and Ventilators. The United States has roughly 170K thousand, ventilators counting stockpiles in storage. About a third of the patients going to hospital need ventilator support. Which means the number of ventilators needs to roughly double. By the time surge in patients happens. We think with the right mobilization of the private sector, that may be within reach.
Optimal Distribution: We assume the patients needing hospital beds and ventilators can consume any available facility in the US. In reality there will be hotspots within the country where they may not be able to use available resources somewhere else in the country.
Adjusting our Sails
So now that we have seen the good, the bad and the ugly, what can we do to get to a better place. The purpose of this article is a call to arms to band together and to create better outcomes than the default.
There are other factors that could lead to better outcomes:
Virus mutation: sometimes the virus mutates in a way that the severity of symptoms is greatly reduced. This may reduce the probability of needing hospitalization. This has happened in past epidemics.
Existing drugs: existing drugs may prove to be effective at reducing the symptoms (there are some clinical underway).
New vaccines: We may have an early breakthrough in vaccines.
But in the likelihood one or more of these outcomes are not possible, we will need everyone to come together to come up with solutions. Here are some ideas.
Reduce the virus reproduction rate (R0)
As the different scenarios show, we’re much better off reducing the time to contain the disease and the number of deaths if we reduce R0. While a lot of experts are claiming we missed the window to reduce R0 to the point of containment, I don’t think we can give up on that.
Here are ways we can aim for containment and reduce R0 to as low as possible:
Discipline: Everyone must observe the shutdown. The enforcement must have teeth and more education is needed for people to realize what is at stake.
Contact tracing: Quickly build technology for contact tracing and get the regulatory approval for it. Currently cell phone companies may have the data about who was in contact with who, but it cannot be used due to privacy concerns. The current situation demands that we quickly remove any regulatory restrictions on using data for the purpose of fighting COVID-19. This is why South Korea, China and Taiwan were able to contain the spread so well.
Limit travel: limit travel across high disease areas and rest of the country.
Better identify who will get infected and sick: Encourage self-quarantining for individuals likely to develop severe symptoms. Stop any travel across state lines. The degree by which we can predict who will get infected by the disease is based on granular data locked within individual hospital record systems. The confirmation of who got the disease is trapped within labs. To build the best, most predictive model, we need granular data - the more the better. This requires a change in regulatory policy to make it possible to share this data and action on the part of those who hold the data.
Fortify our healthcare systems
If we can’t contain the disease, then ultimately it will be about managing the supply and demand for the health care system. We must quickly fortify our systems:
Build more: Use every resource possible to increase capacity. We may need an army core of engineers to help build the hospitals, like in China. Tesla, Ford, and GM and other manufacturing companies need to build the necessary ventilators.
Train more: We will need to dramatically grow the workforce in hospitals. We may need to stand up training programs so we can quickly deploy more people.
Protect healthcare workers: There is a severe supply shortage for personal protective equipment like suits and masks for healthcare workers. This is like sending soldiers in a war without weapons or armor. We may lose a large fraction of healthcare workers themselves to infection, exacerbating the problem. We must rapidly innovate to figure out the precious few doctors and nurses we have are not themselves falling sick.
Build infrastructure for operational efficiency
We need to use technology and processes to leverage people and equipment as efficiently as possible to help the patients who need it the most. How do we make sure that we are able to adapt schedules of who is working in the hospital when based on who becomes available or unavailable so we are always fully staffed? How do we avoid having ventilators in parts of the country that are not getting used while we have severe shortages in other parts. We will need to be more efficient with our resources than ever. If we can rapidly deploy software systems that enable this efficiency, it may mean saving thousands or potentially millions of lives.
Take Imaginative, Decisive Action, and Research
There are so many questions that we need to answer that will require imagination, decisive action, and expedited research, such as:
What are the characteristics of the 85-90% exposed people who only get mild symptoms compared to the rest who need hospitalization? If we identify someone’s propensity for hospitalization under COVID-19, we could institute more targeted isolation for high risk individuals.
How can we identify COVID-19 patients early in their infection so they are not spreading it?
What other existing drugs may lessen the symptoms?
Again, much of healthcare research takes time because of privacy regulations. If the government can make it easy to pool the data in one place and make it available to healthcare researchers and even frontline doctors and nurses, it will make a huge difference in our ability to quickly find the answers we desperately need. To enable such a pool of data quickly, citizens and government will have to be willing to forego HIPAA regulations for a short time and upend slow, decades old rules and processes to even get to the data. But it’s technically possible.
I am sure there are so many other things we can do to lessen the impact of this pandemic that no one has thought of yet. I am writing this to appeal to all the innovators out there. This is the most important challenge our generation is going to face. This is our calling to truly make a difference. Let’s get to it.


