Homelessness in America: A Story in 10 Charts
Homelessness in America: A Story in 10 Charts
The other day I was scanning the SF Chronicle and came across an article which looked at the top 2019 resolution for Bay Area residents. Turns out it is addressing the homelessness crisis.
While it certainly feels like the issue has been growing, I wanted to dive into the data to see what was actually going on. So, I decided to upload some publicly available datasets and explore them in Thoughtspot.
A State by State Look
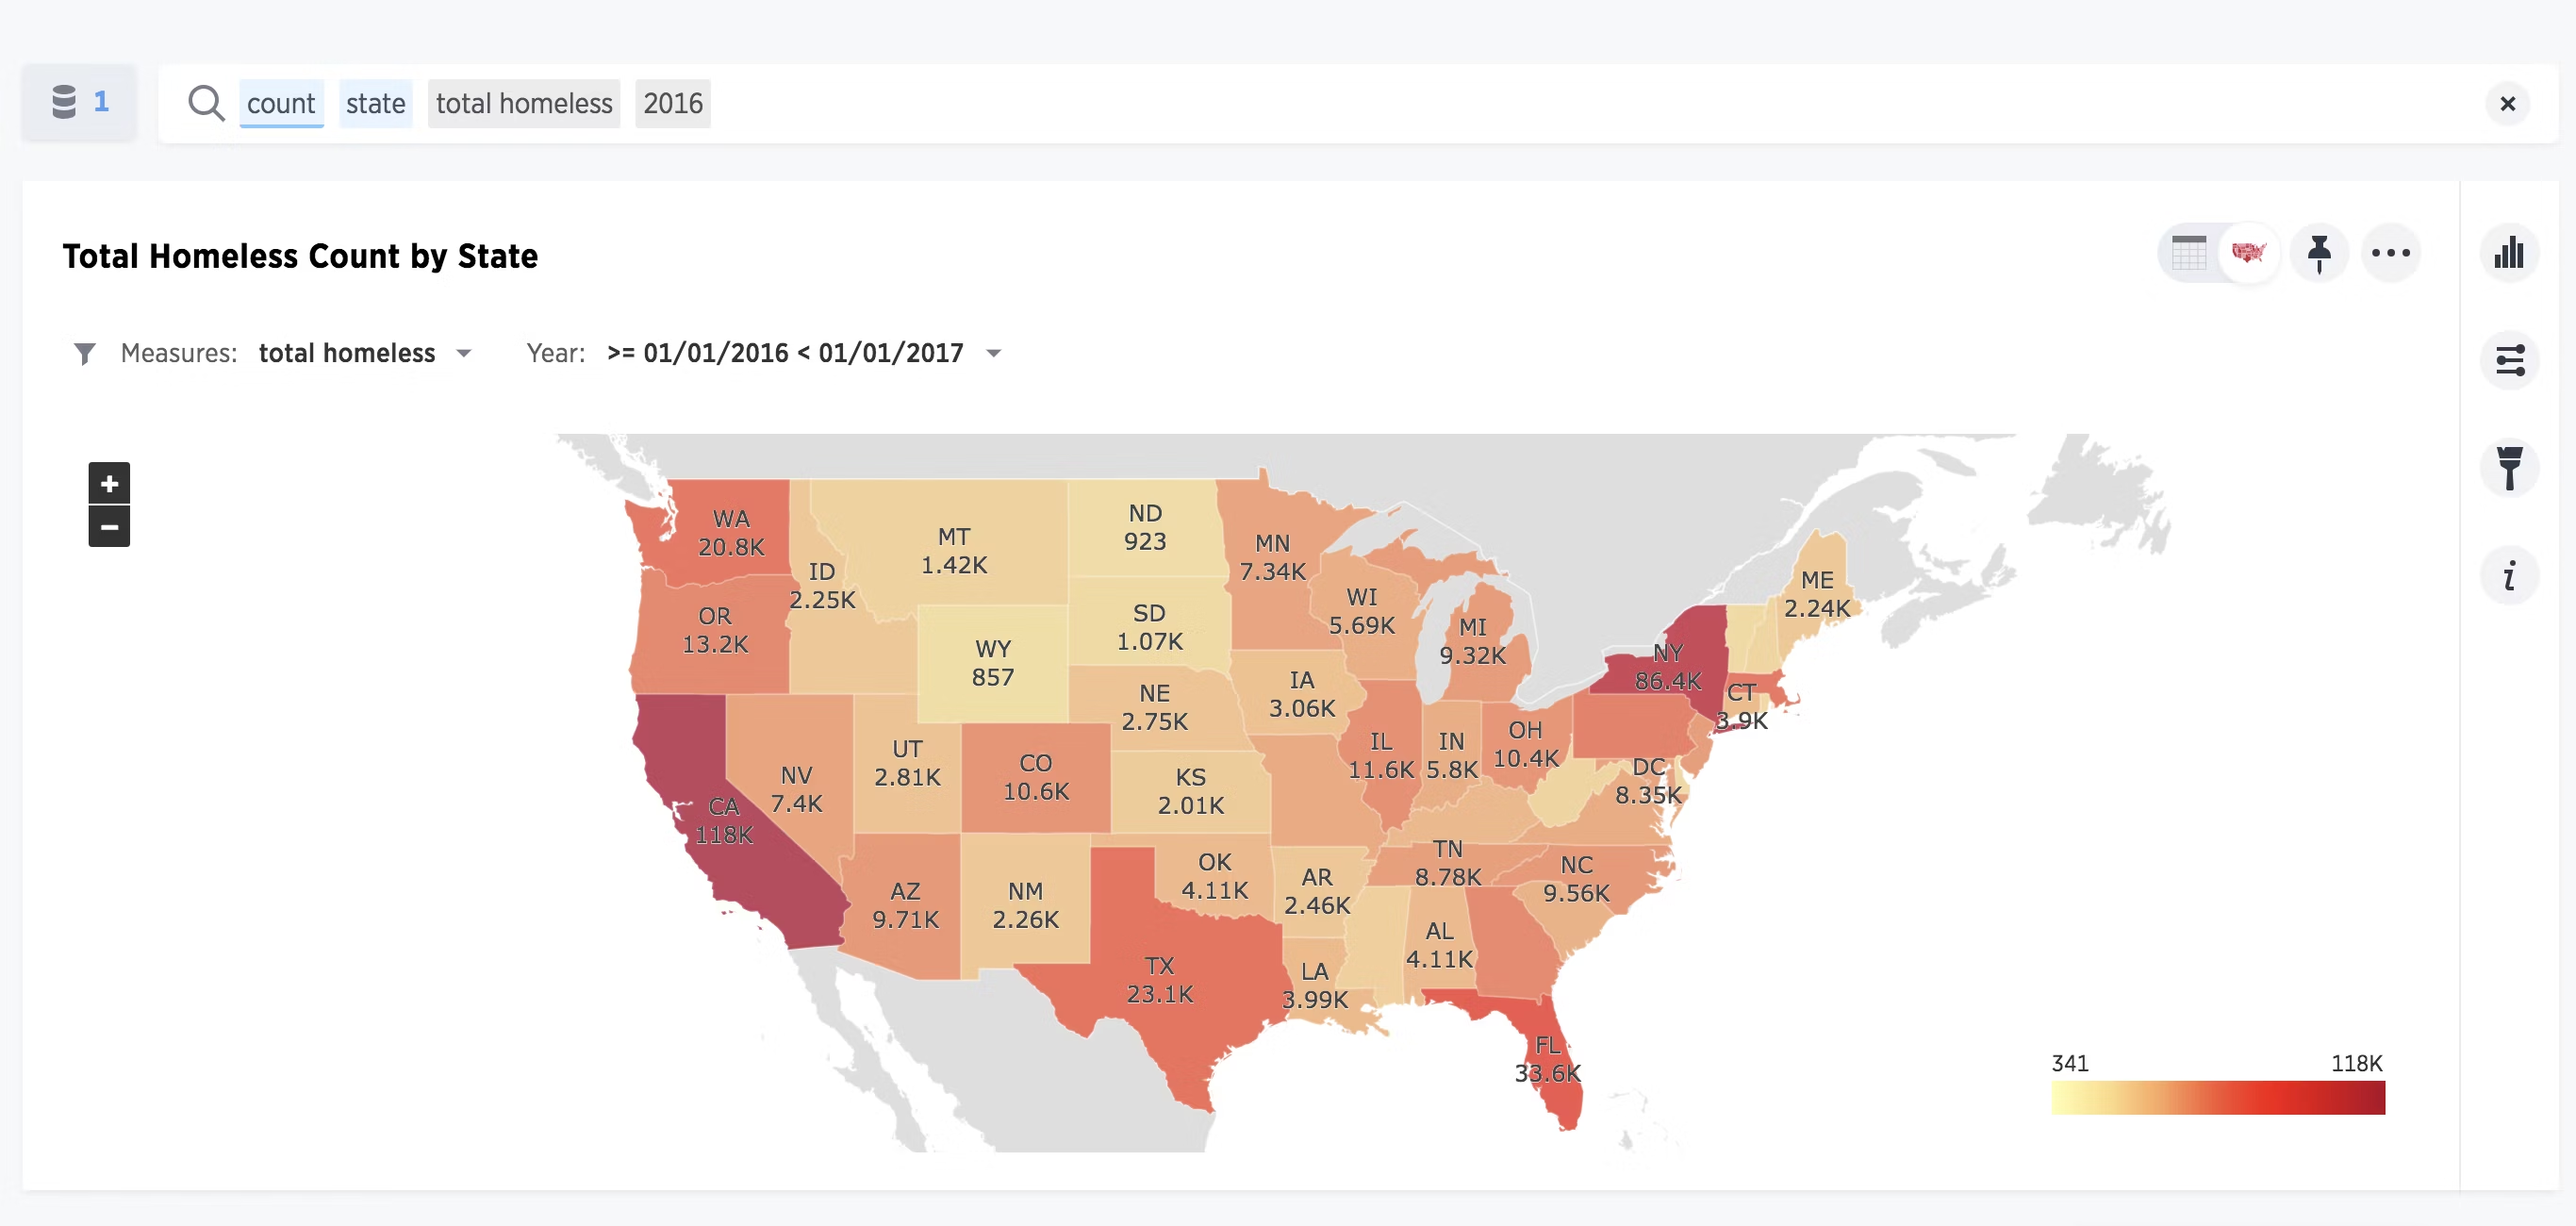
Data Source: Homelessness in US, 2007 to 2016, Kaggle
I started by looking at the total number of homeless people in each state. States like California, New York, and Washington have more homeless people compared to states like Wyoming and South Dakota.
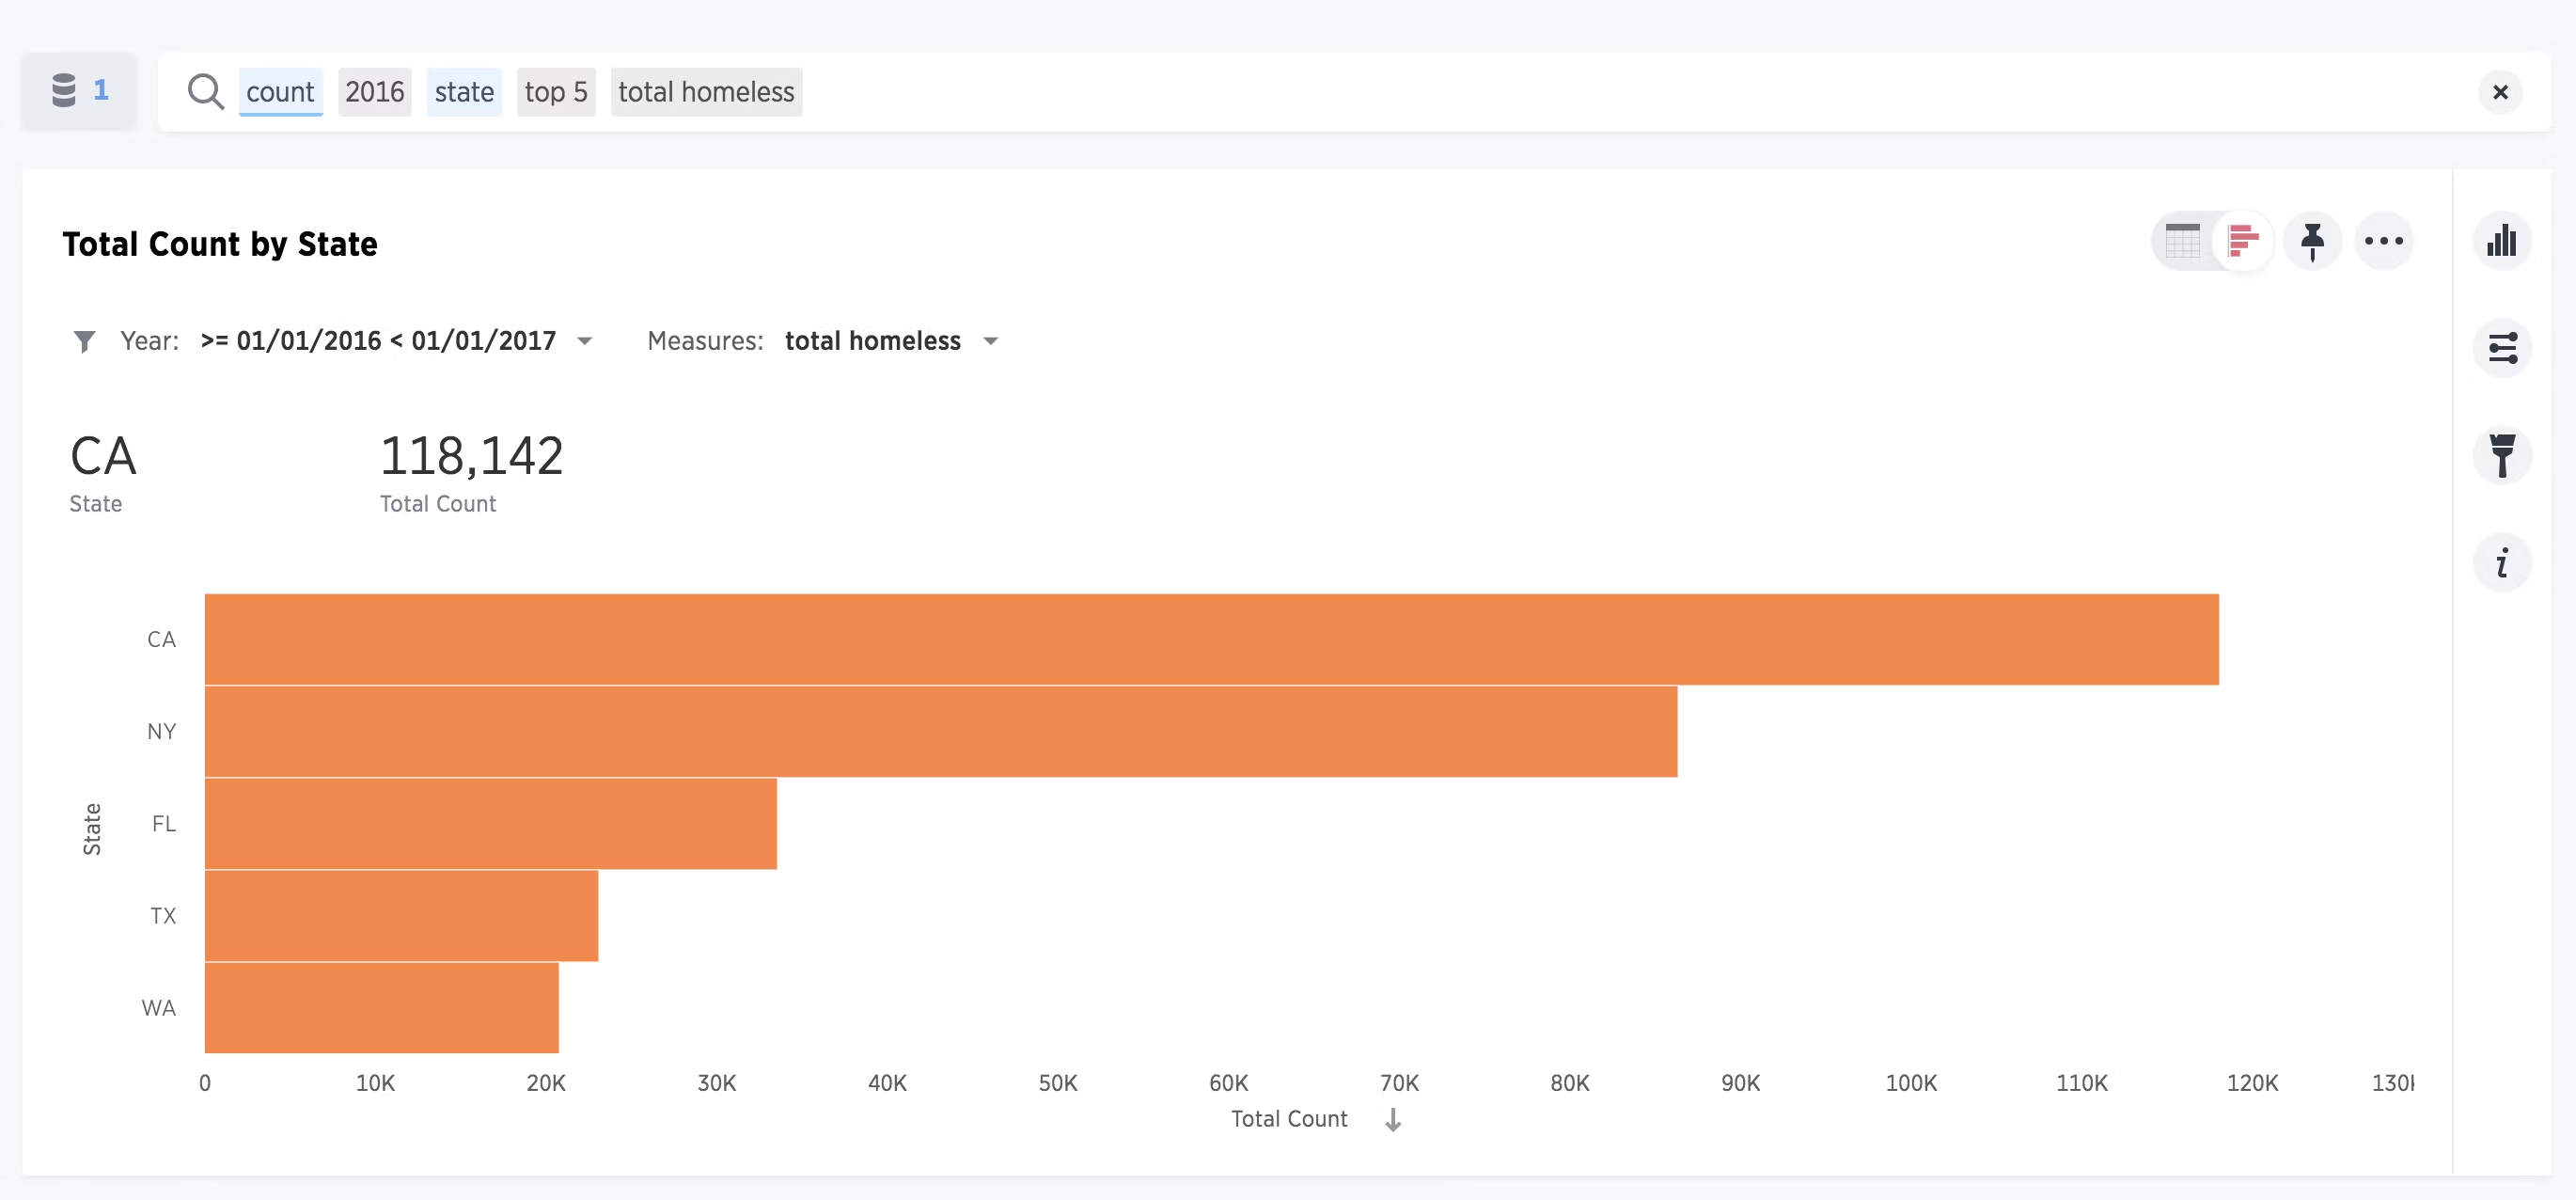
To get an exact list of top 5 states which house the maximum total homeless population, I ran a simple search.
Data Source: Homelessness in US, 2007 to 2016, Kaggle
As you can see these are: California, New York, Florida, Texas, Washington, in that order.
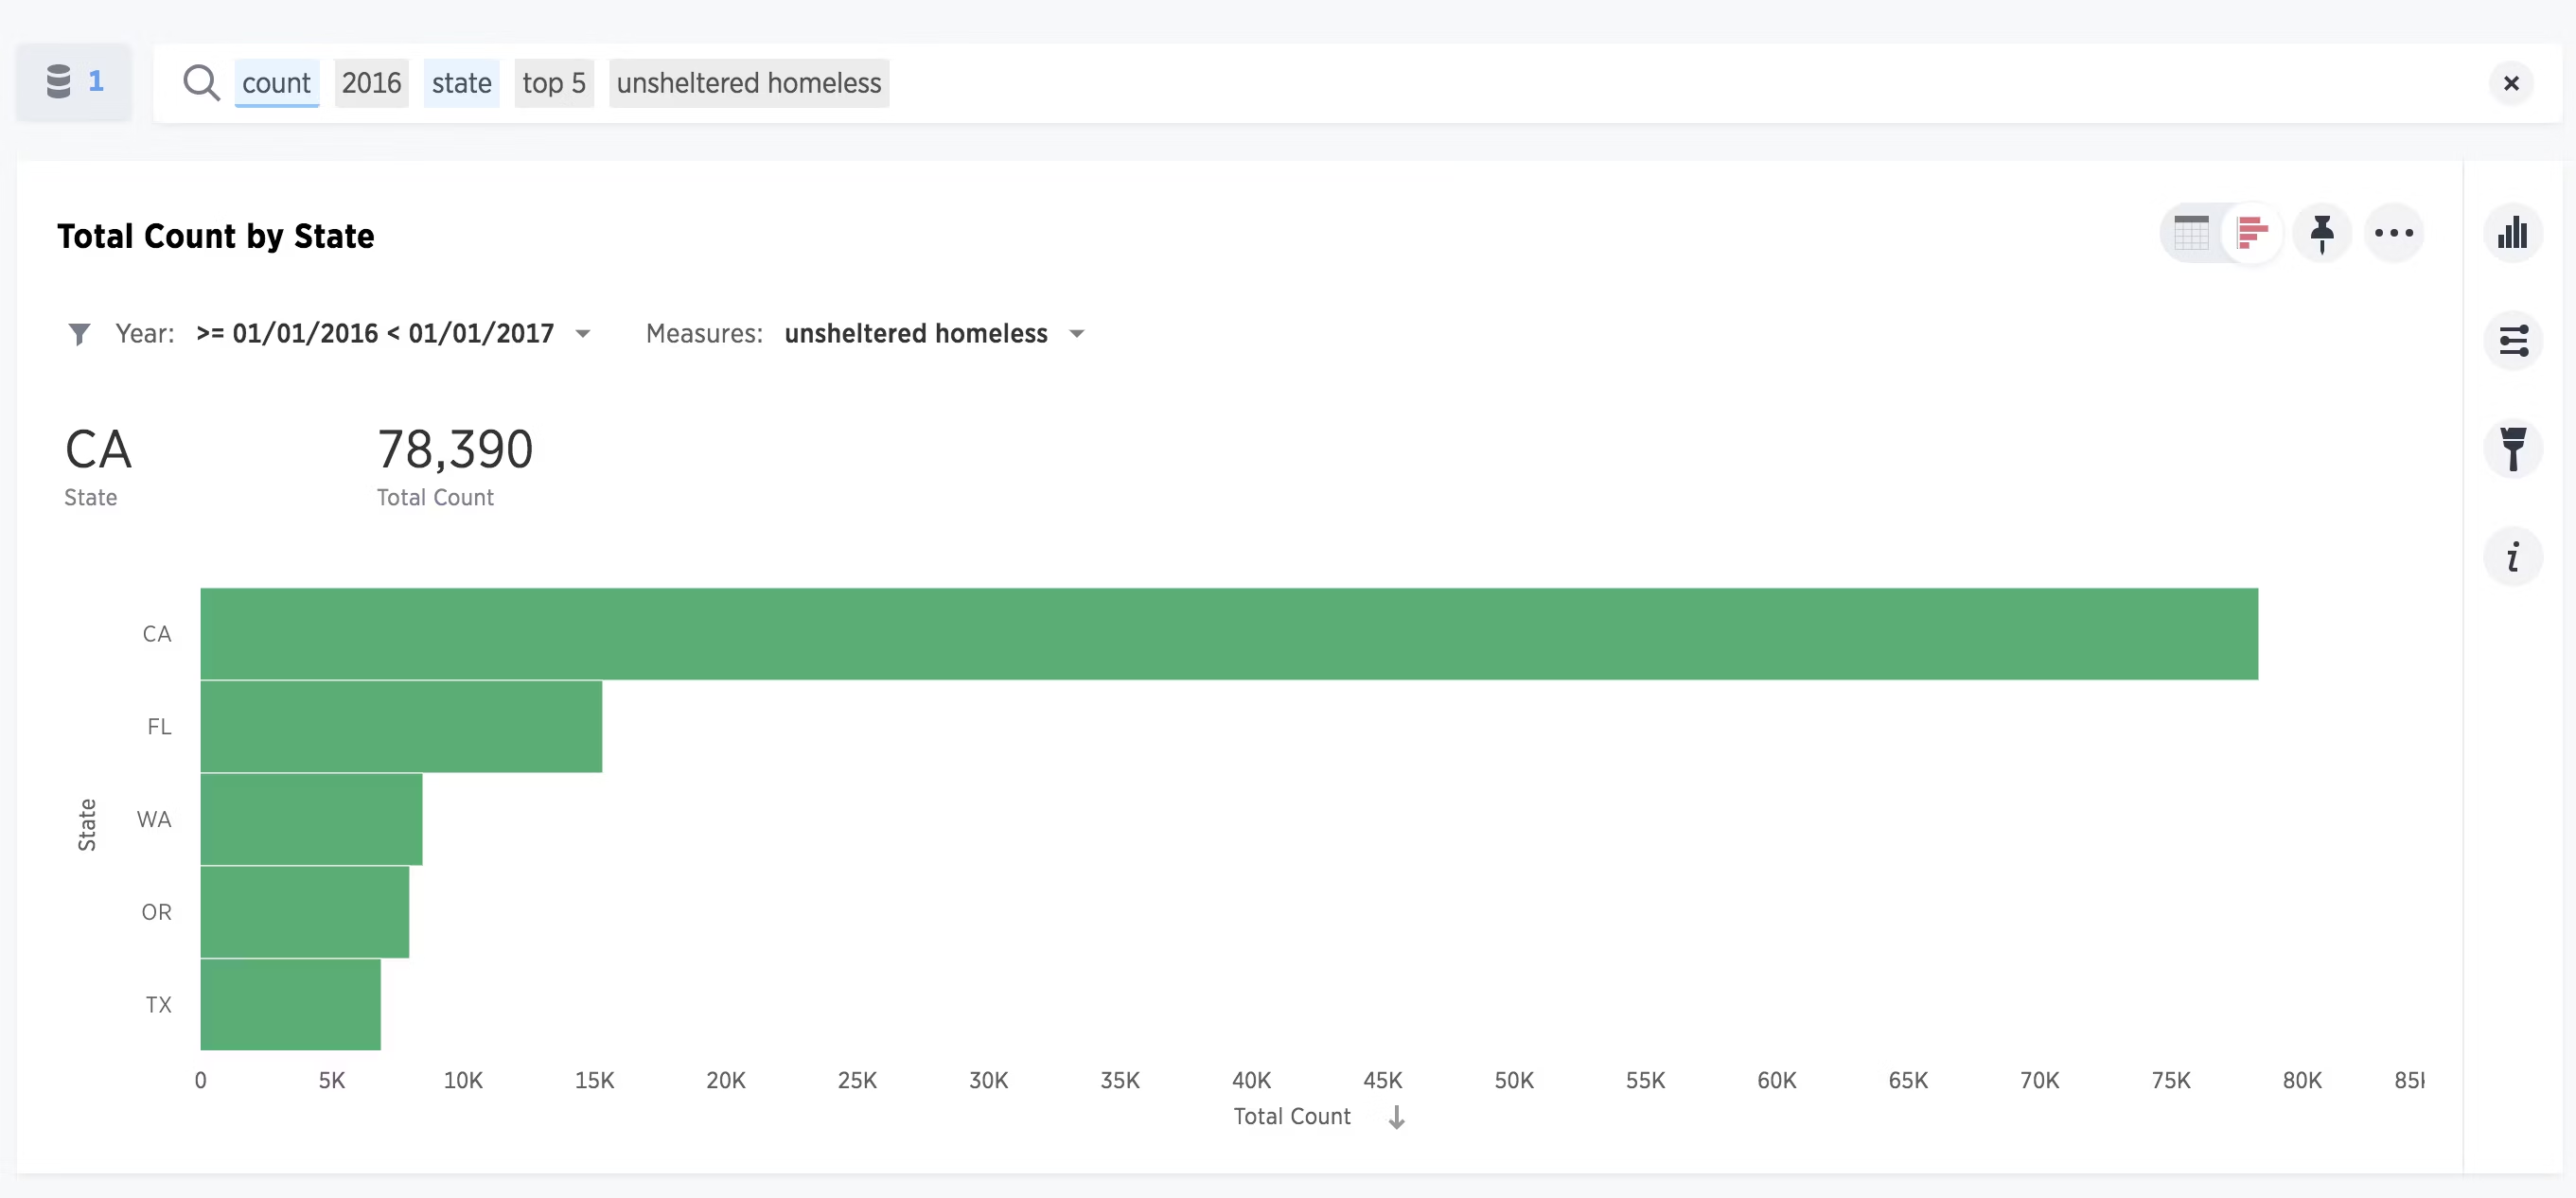
While all homelessness is a serious issue, unsheltered homelessness is often the most dire and debilitating. I wanted to drill further and see which states had the greatest number of unsheltered homeless people, and if that was any different from the states with the overall greatest number of homeless.
Data Source: Homelessness in US, 2007 to 2016, Kaggle
To my surprise, there was a slight difference. While California, Florida, Washington, and Texas stayed on the list, New York dropped out of the top five.
I wanted to know more, specifically around how sheltered and unsheltered homelessness rates compare across different states. I did a quick search on sheltered vs unsheltered homelessness using a HUD dataset.
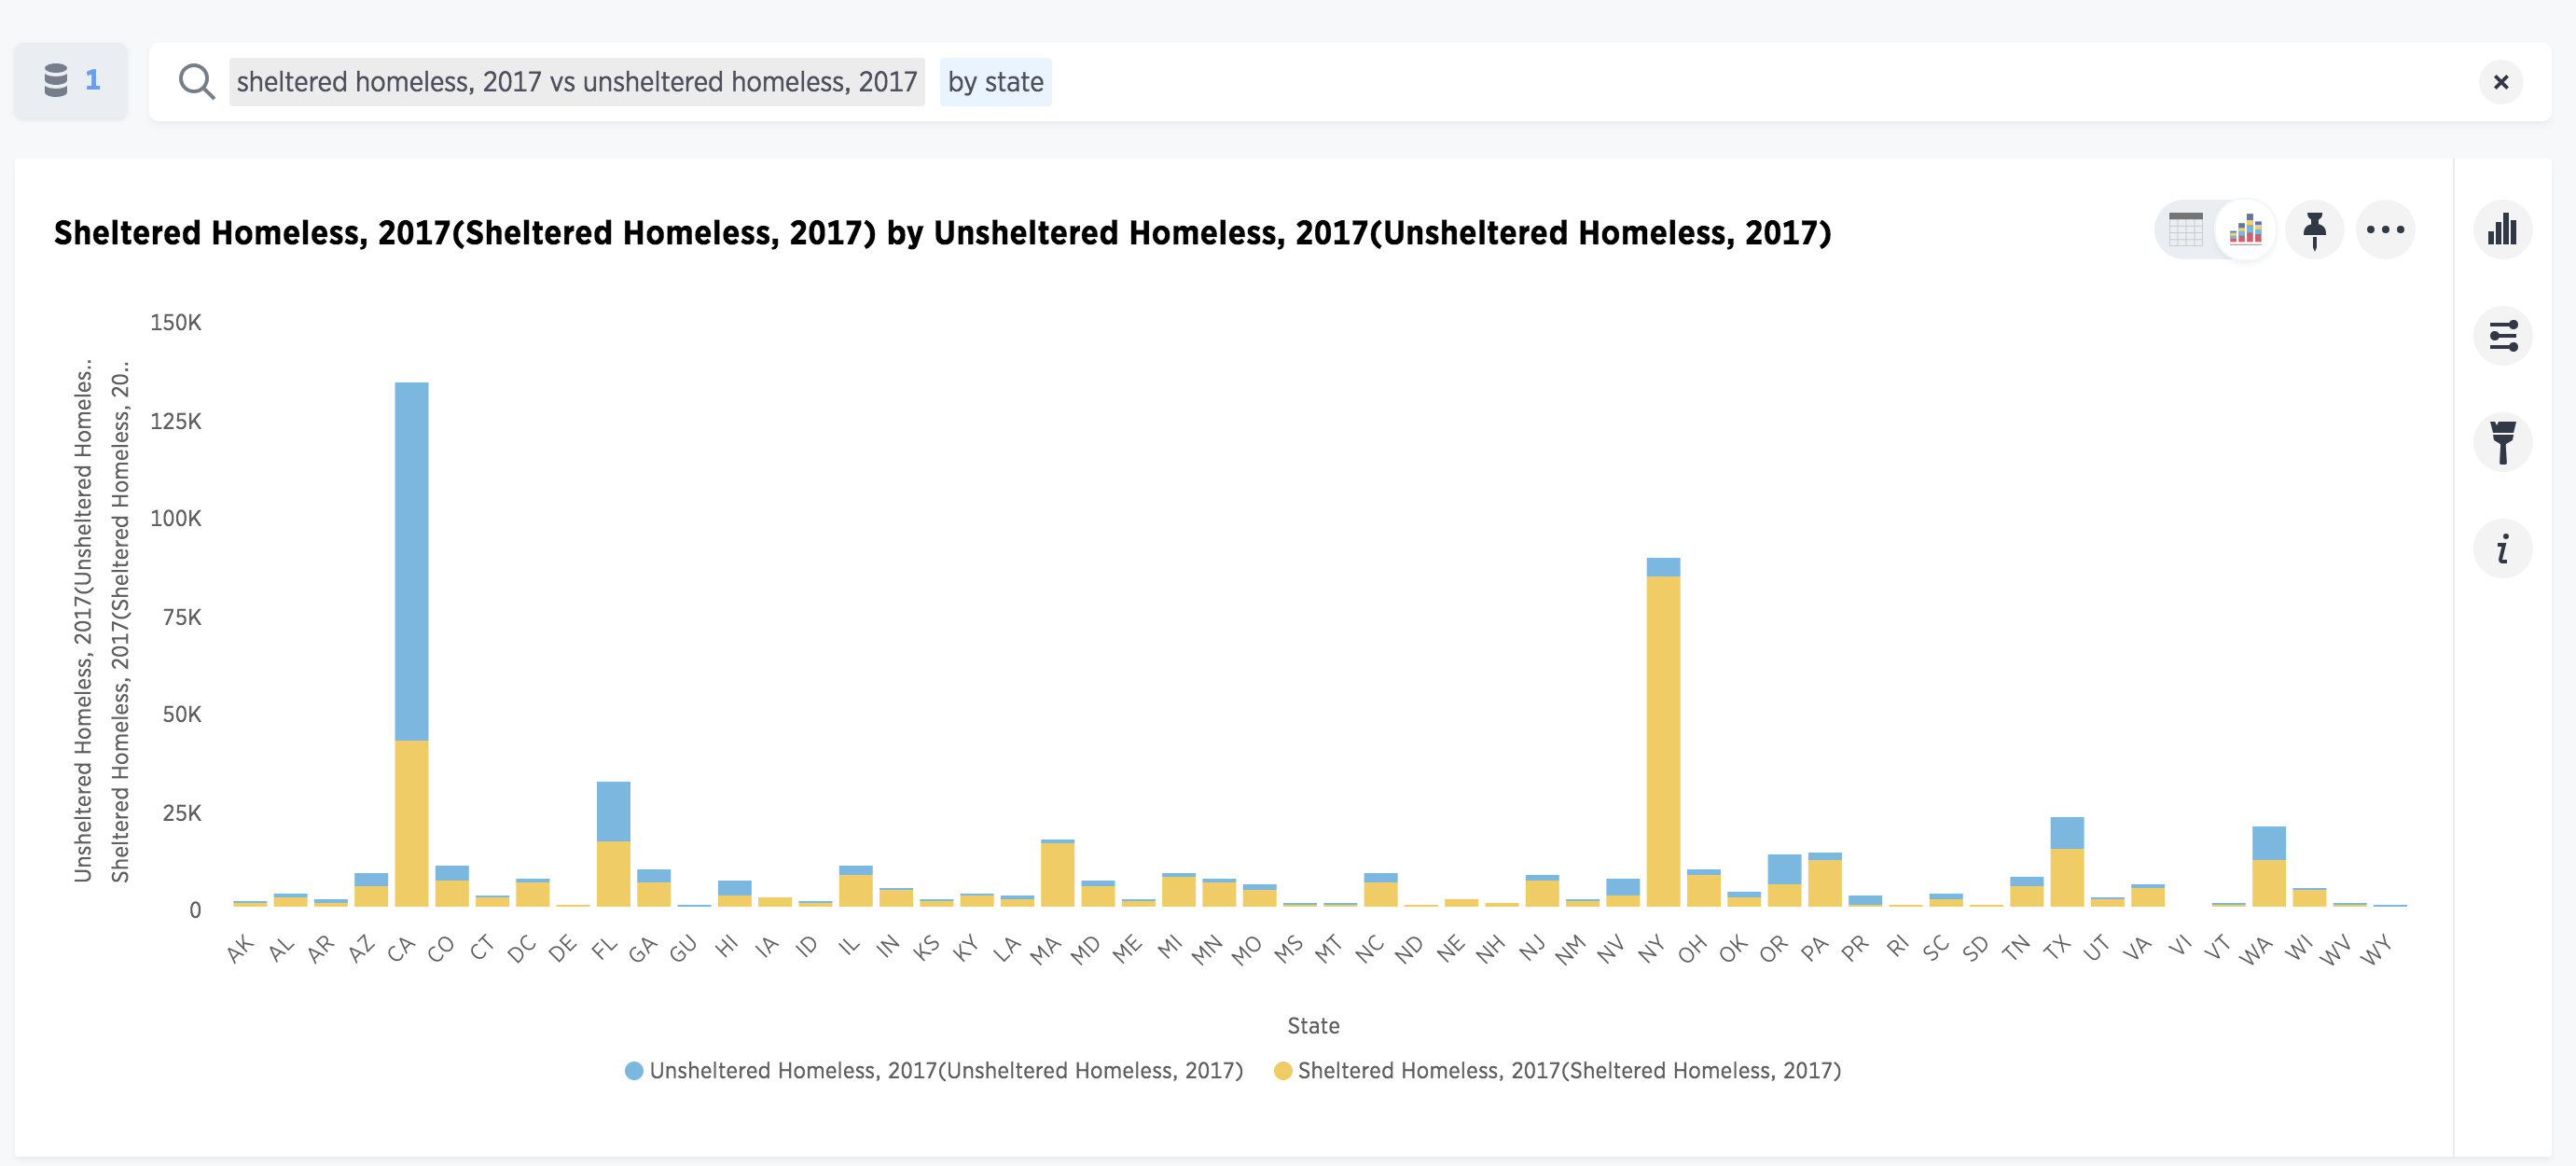
New York has a primarily sheltered homeless population. Turns out, that’s a similar mix across most states.
California is a different story. Running this analysis through SpotIQ showed me California has 25.7 times the average unsheltered homeless.
This is a major contributor to the differences in the perception of homelessness in different states. Unsheltered homeless people are much more visible on the streets than their sheltered counterparts, especially in urban areas like San Francisco and the greater Bay Area, or Los Angeles county.
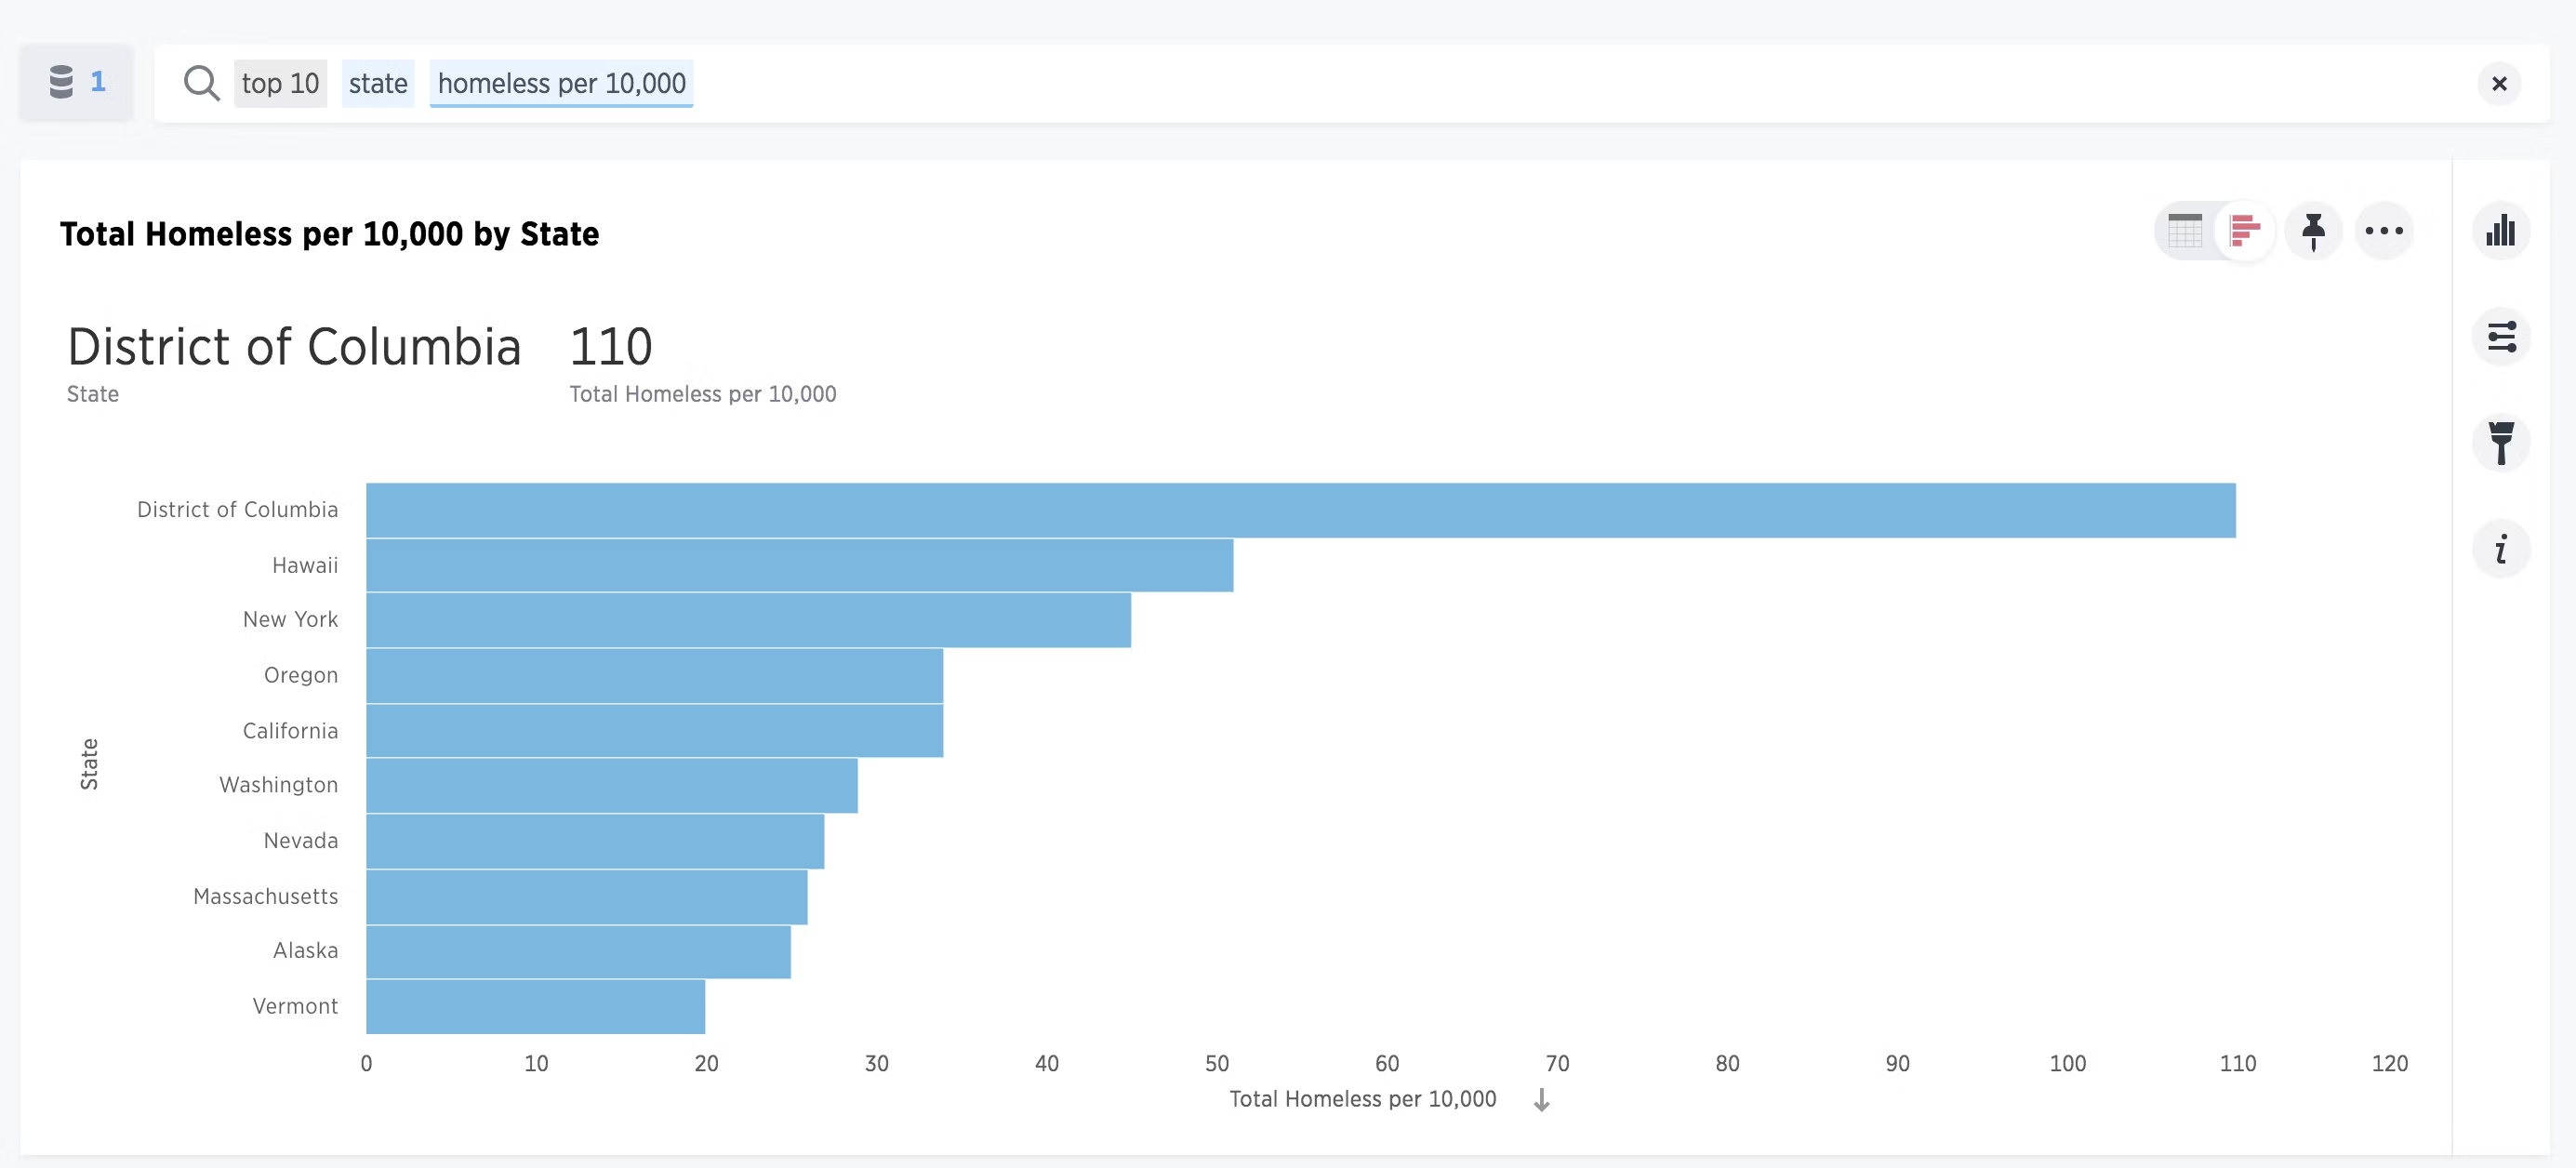
While the total number of homelessness elucidates part of the picture, I also wanted to see the states with the highest homeless rates.
Data source: https://www.hudexchange.info/resource/5639/2017-ahar-part-1-pit-estimates-of-homelessness-in-the-us/
I did another quick search of the HUD dataset and had my answer. DC, Hawaii, and New York have the highest rates of homelessness in the country.
Trends Over Time
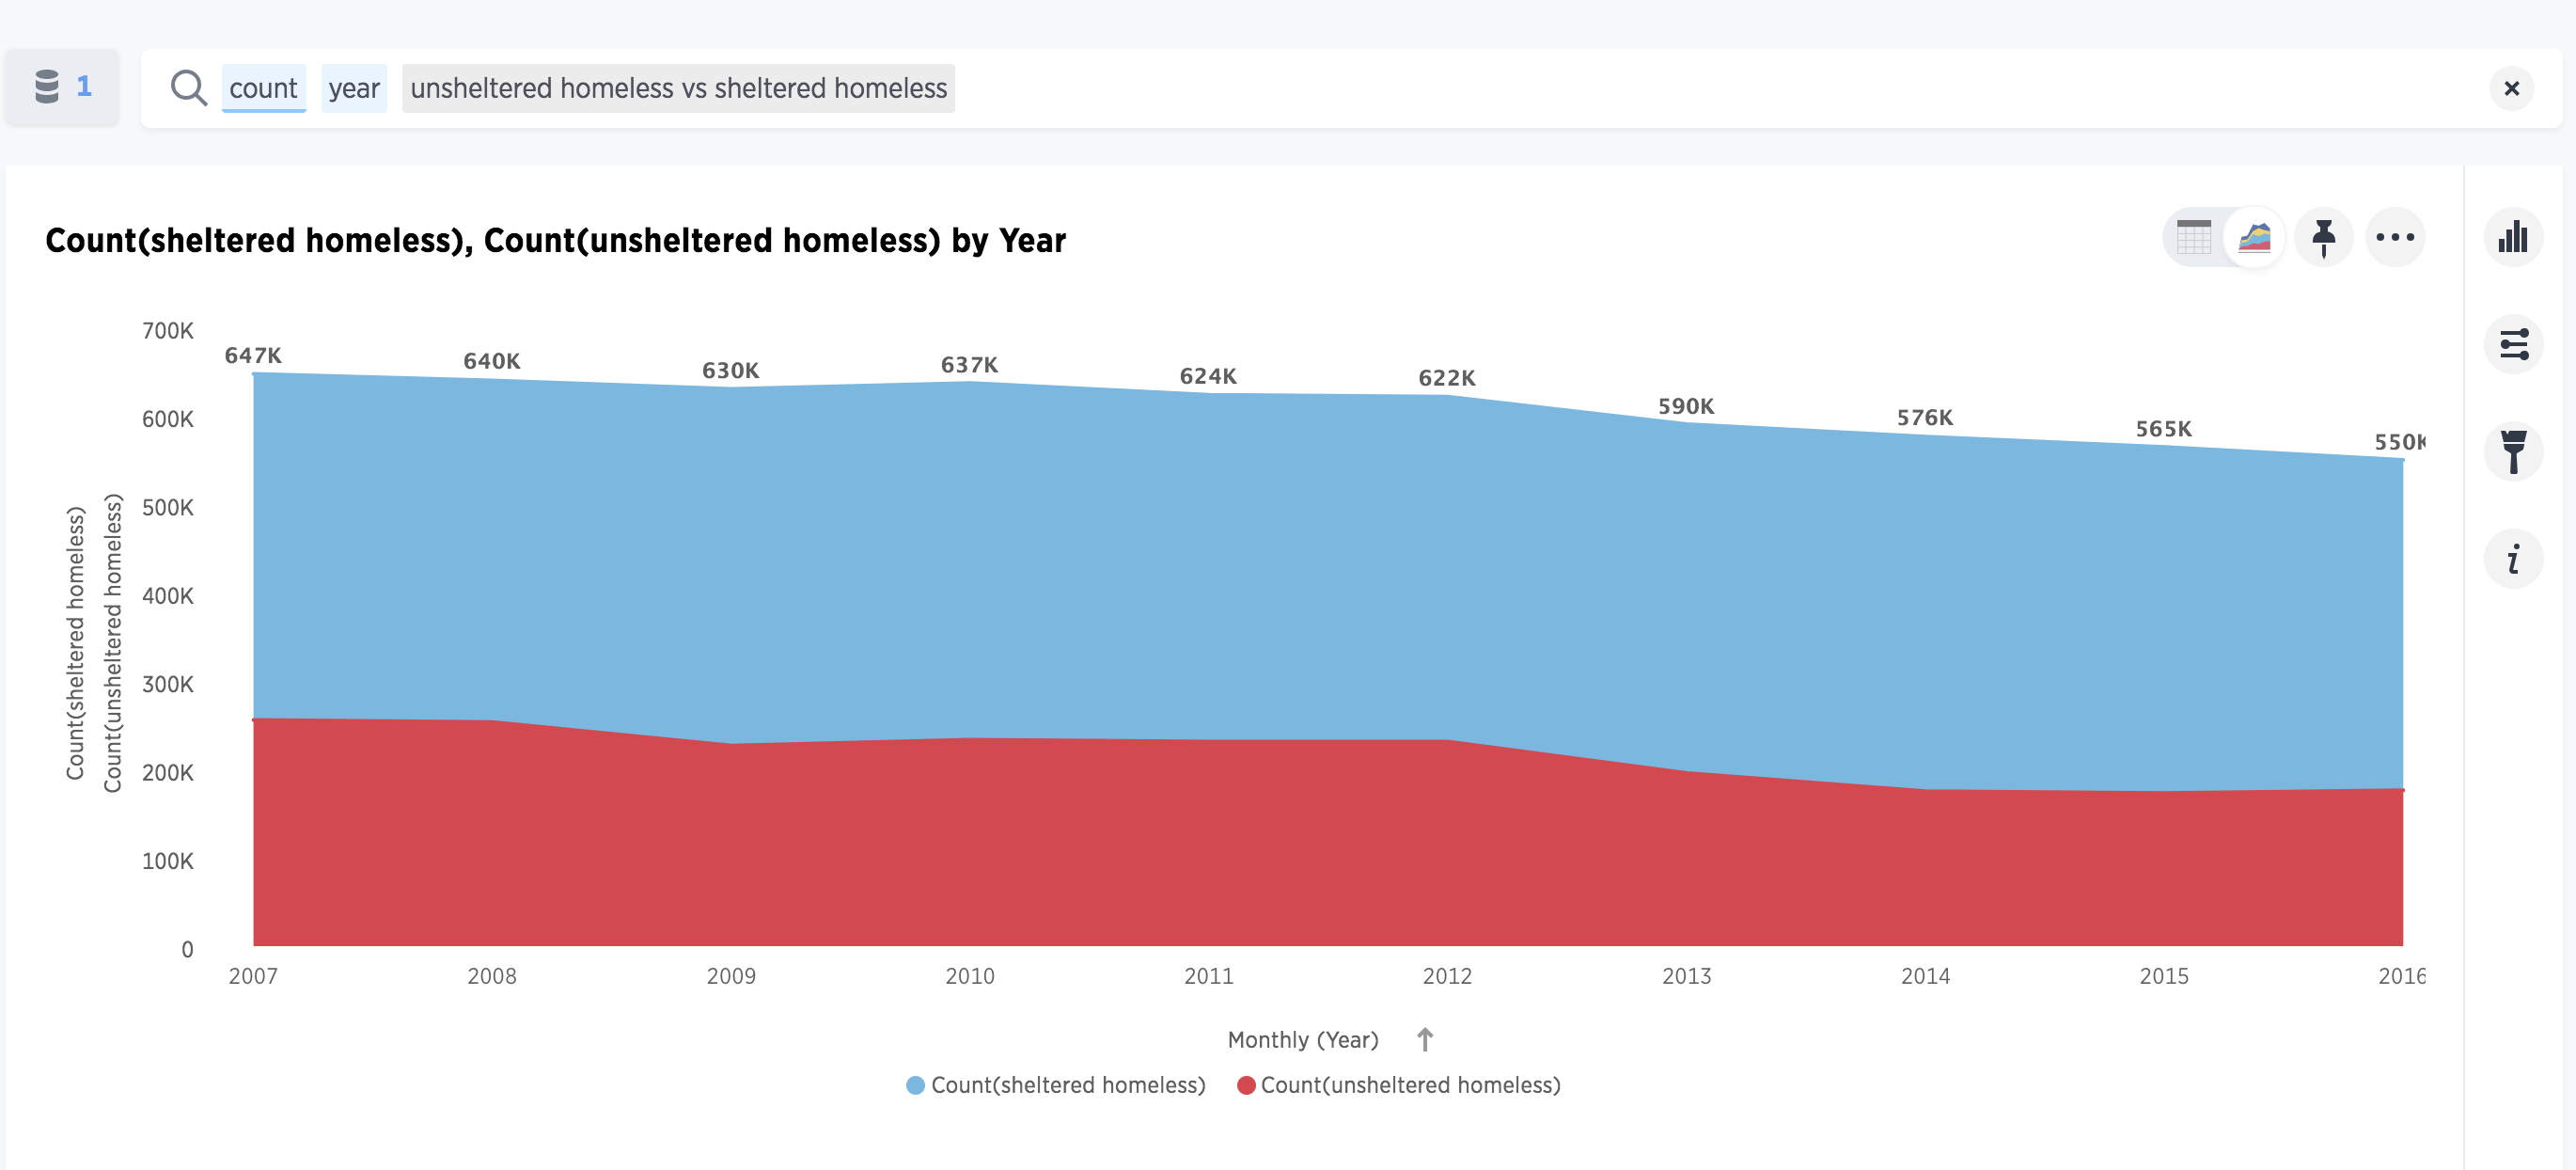
While I had a good understanding of homelessness in different areas of the country, I wanted to examine the perception the issue has been getting worse in recent years. Here is what I found:
Data source: https://ourworldindata.org/homelessness
Overall, homelessness in the US is actually on a downward trend. Both sheltered and unsheltered homelessness rates have fallen across the US over the last nine years. Good news indeed!
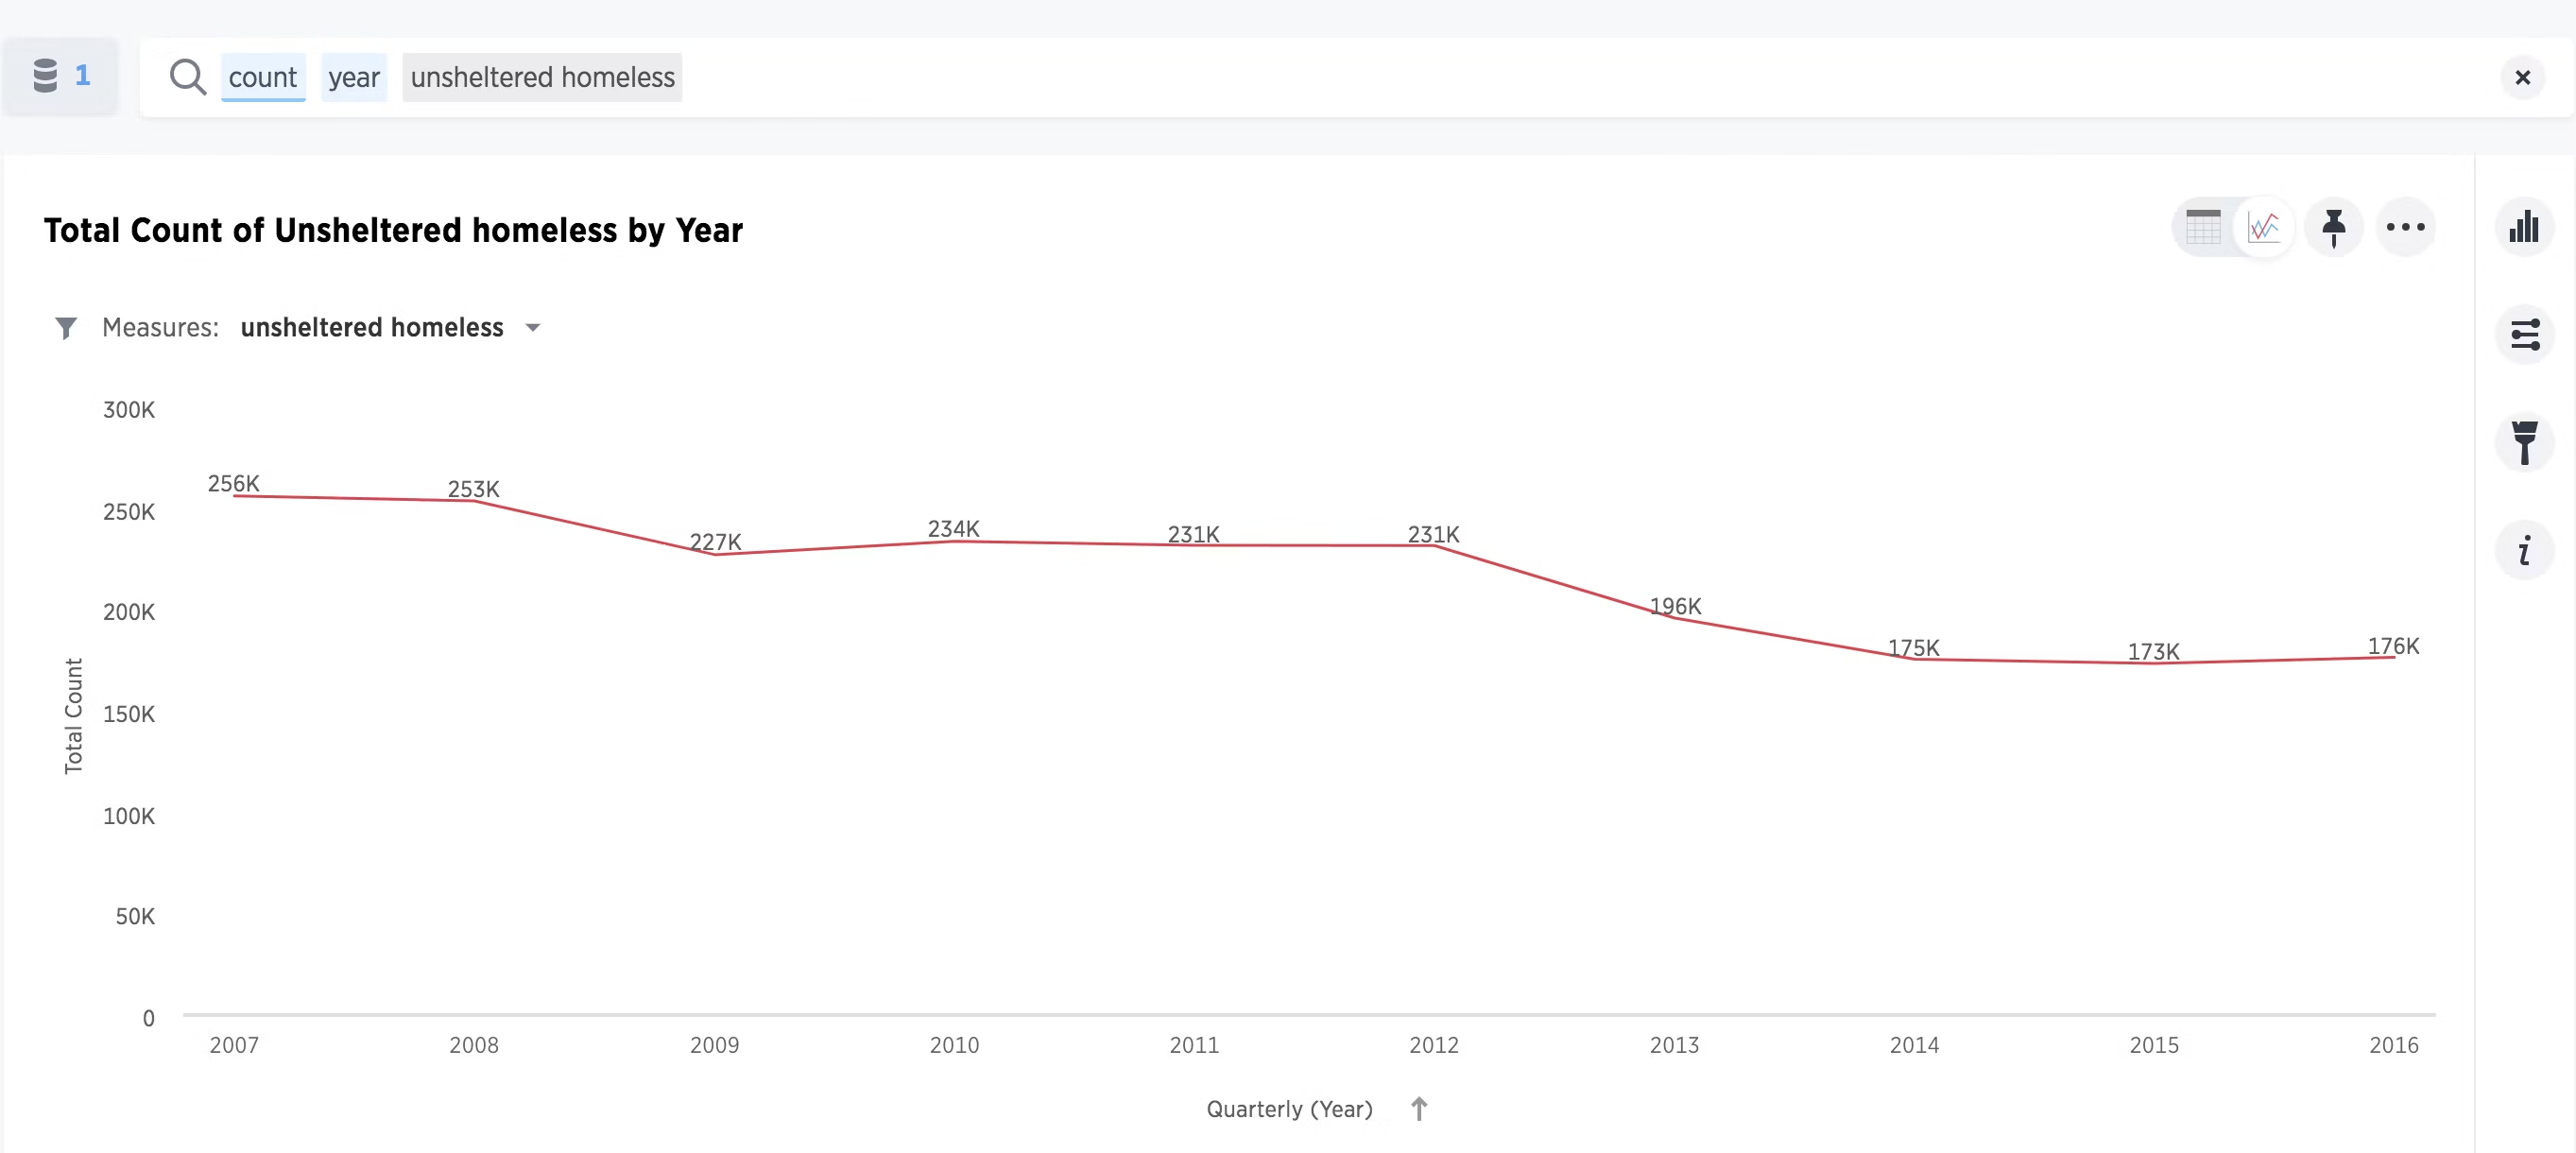
I wanted to look specifically at changes in unsheltered homelessness rates. The trend holds true here, too, with overall count falling over the years, with big declines in 2013 and 2014.
Data Source: Homelessness in US, 2007 to 2016 , Kaggle
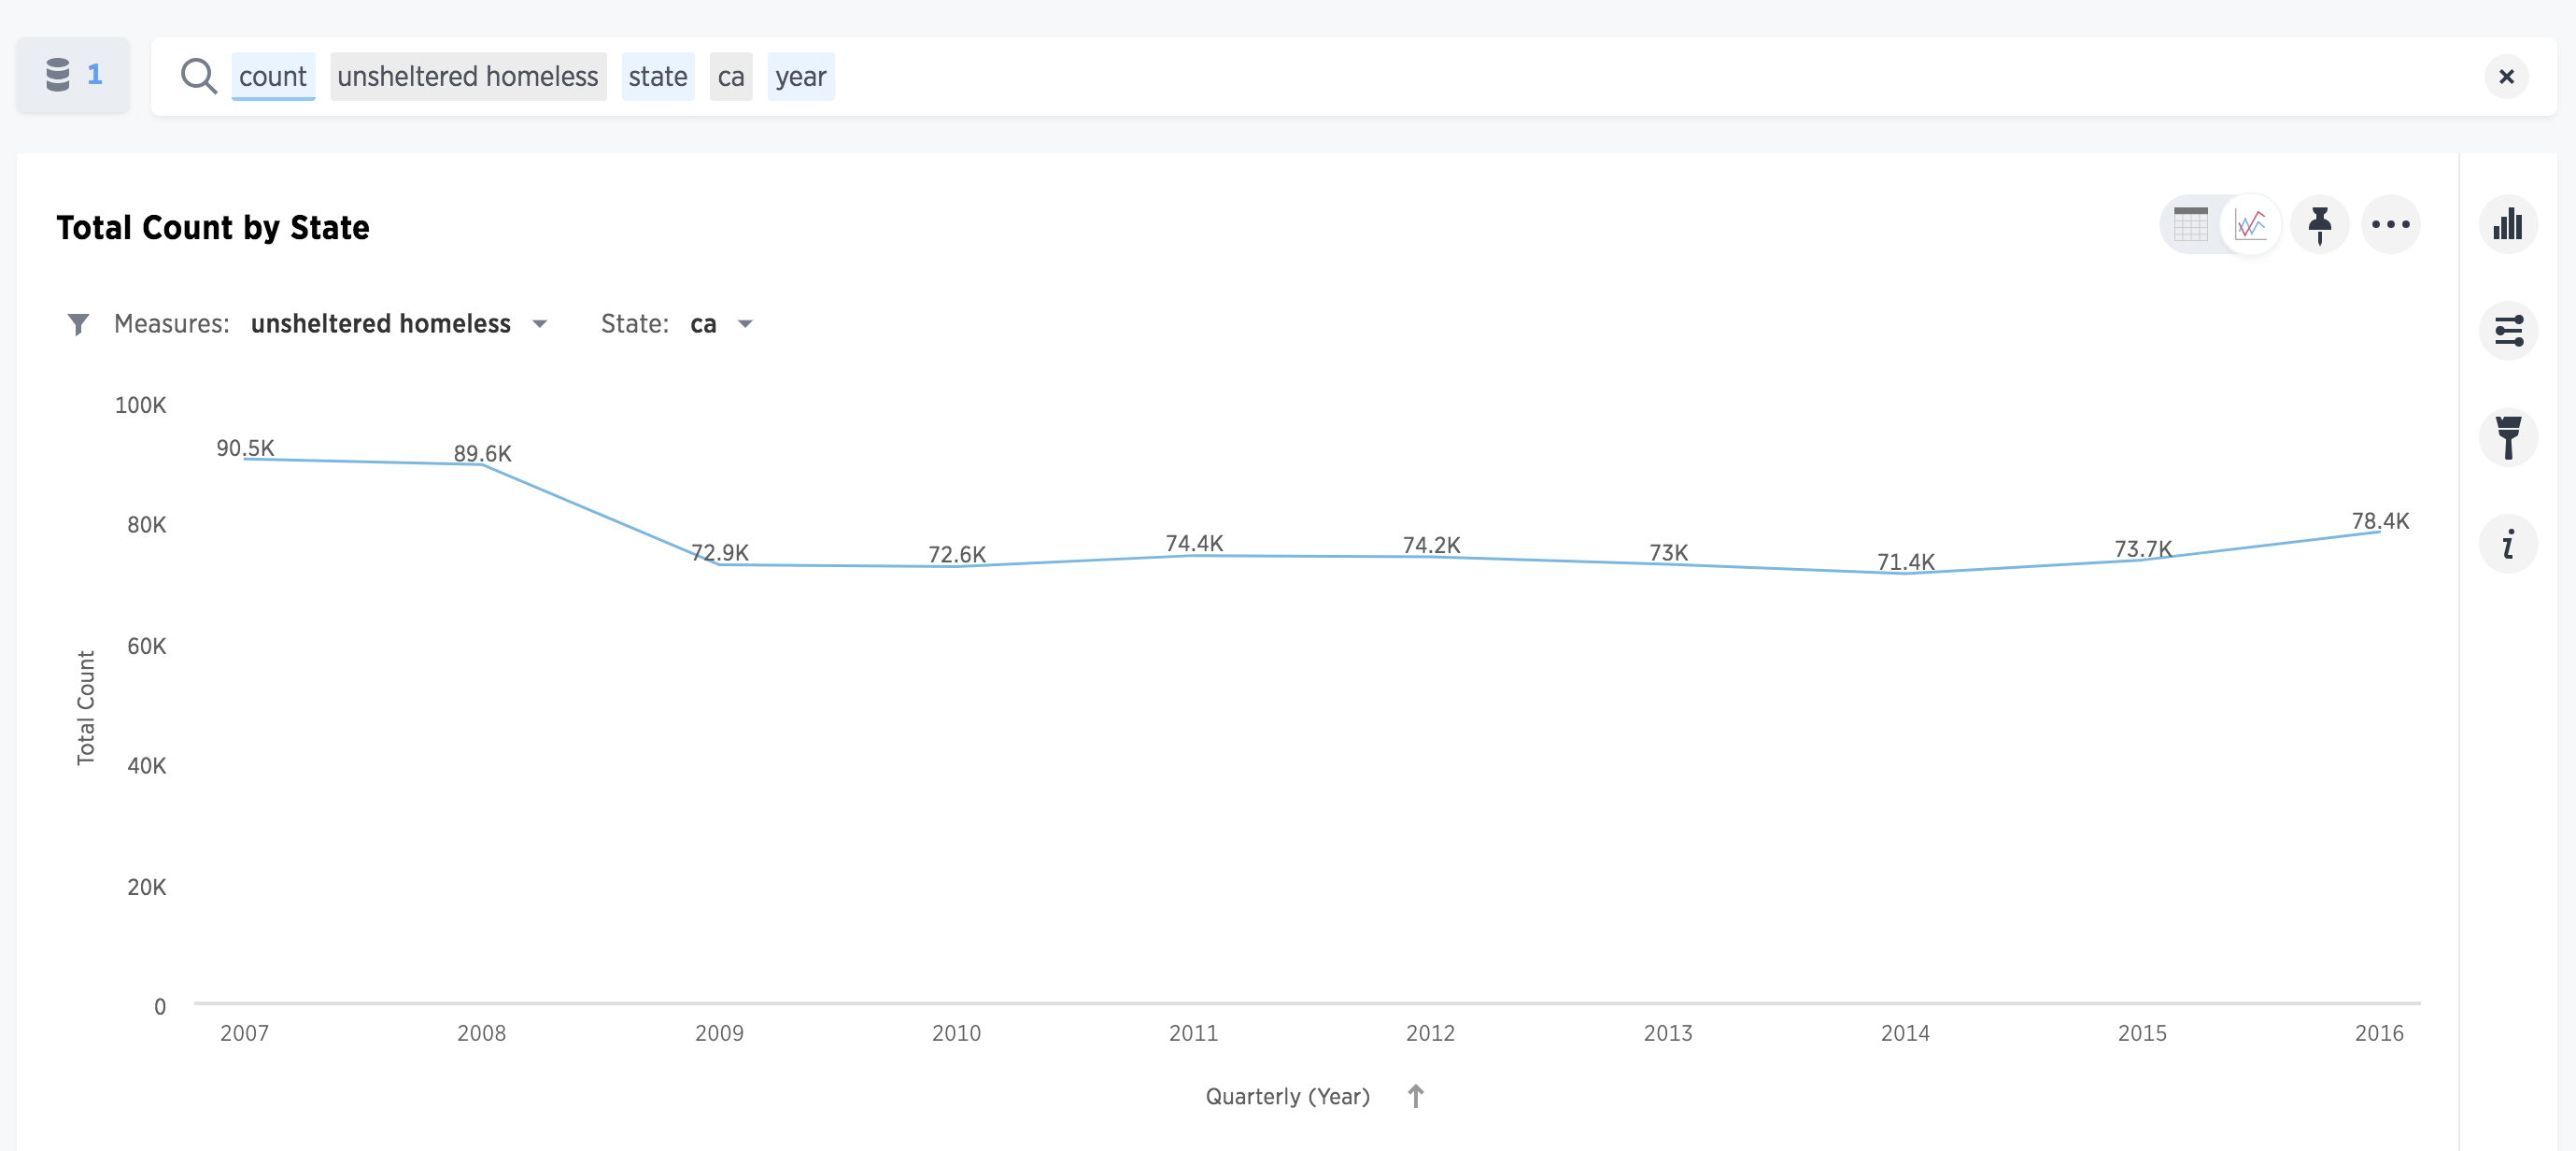
So what about California? I quickly added another term to my search and found an insight.
Data Source: Homelessness in US, 2007 to 2016 , Kaggle
While the country at large has seen a decrease, California is a bit of an anomaly. The number of unsheltered homeless has stayed flat for eight years and actually increased slightly in the last few years.
With this insight, it’s no wonder housing and homelessness is such a pervasive topic of public interest in California, especially in San Francisco.
While most of the datasets had numbers up to 2016, I looked at the 2017 dataset in the HUDA report for the latest numbers over the last year since 2017. After a quick analysis, I found something surprising. Though the last nine years have seen a decrease, there has been a slight increase in total homelessness in 2017 for the first time in recent years.
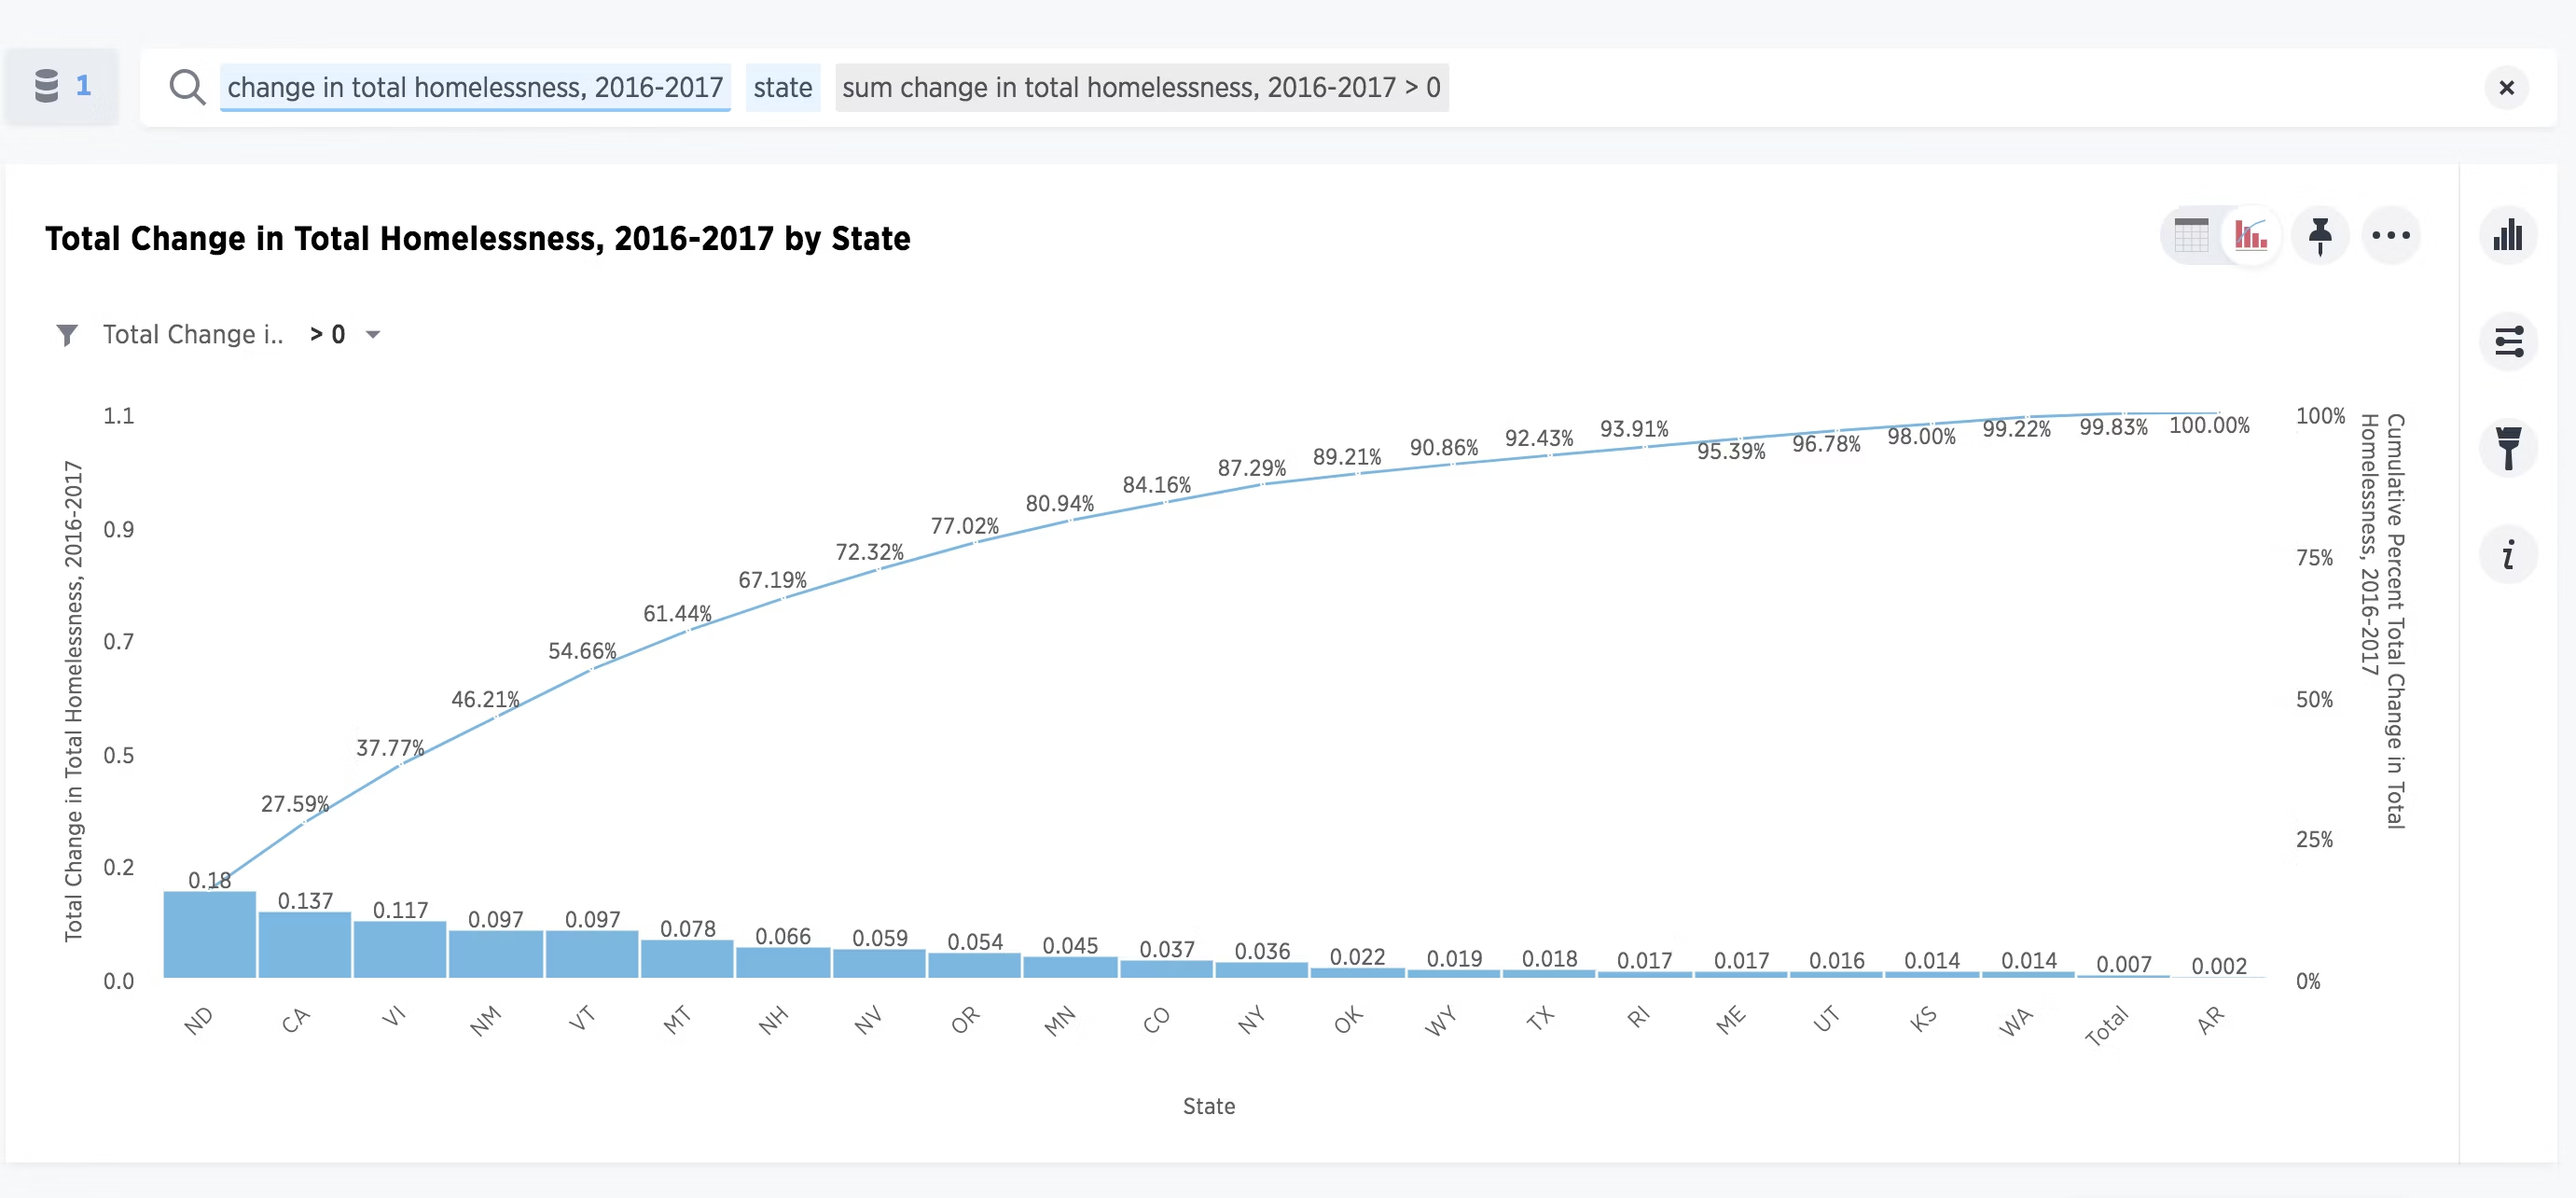
For example, North Dakota actually saw an 18% increase in their total homeless count, while California saw a 13.7% increase. These increases, as shown in the chart above, resulted in the slight rise in homelessness in the last two years.
Housing Prices & Homelessness
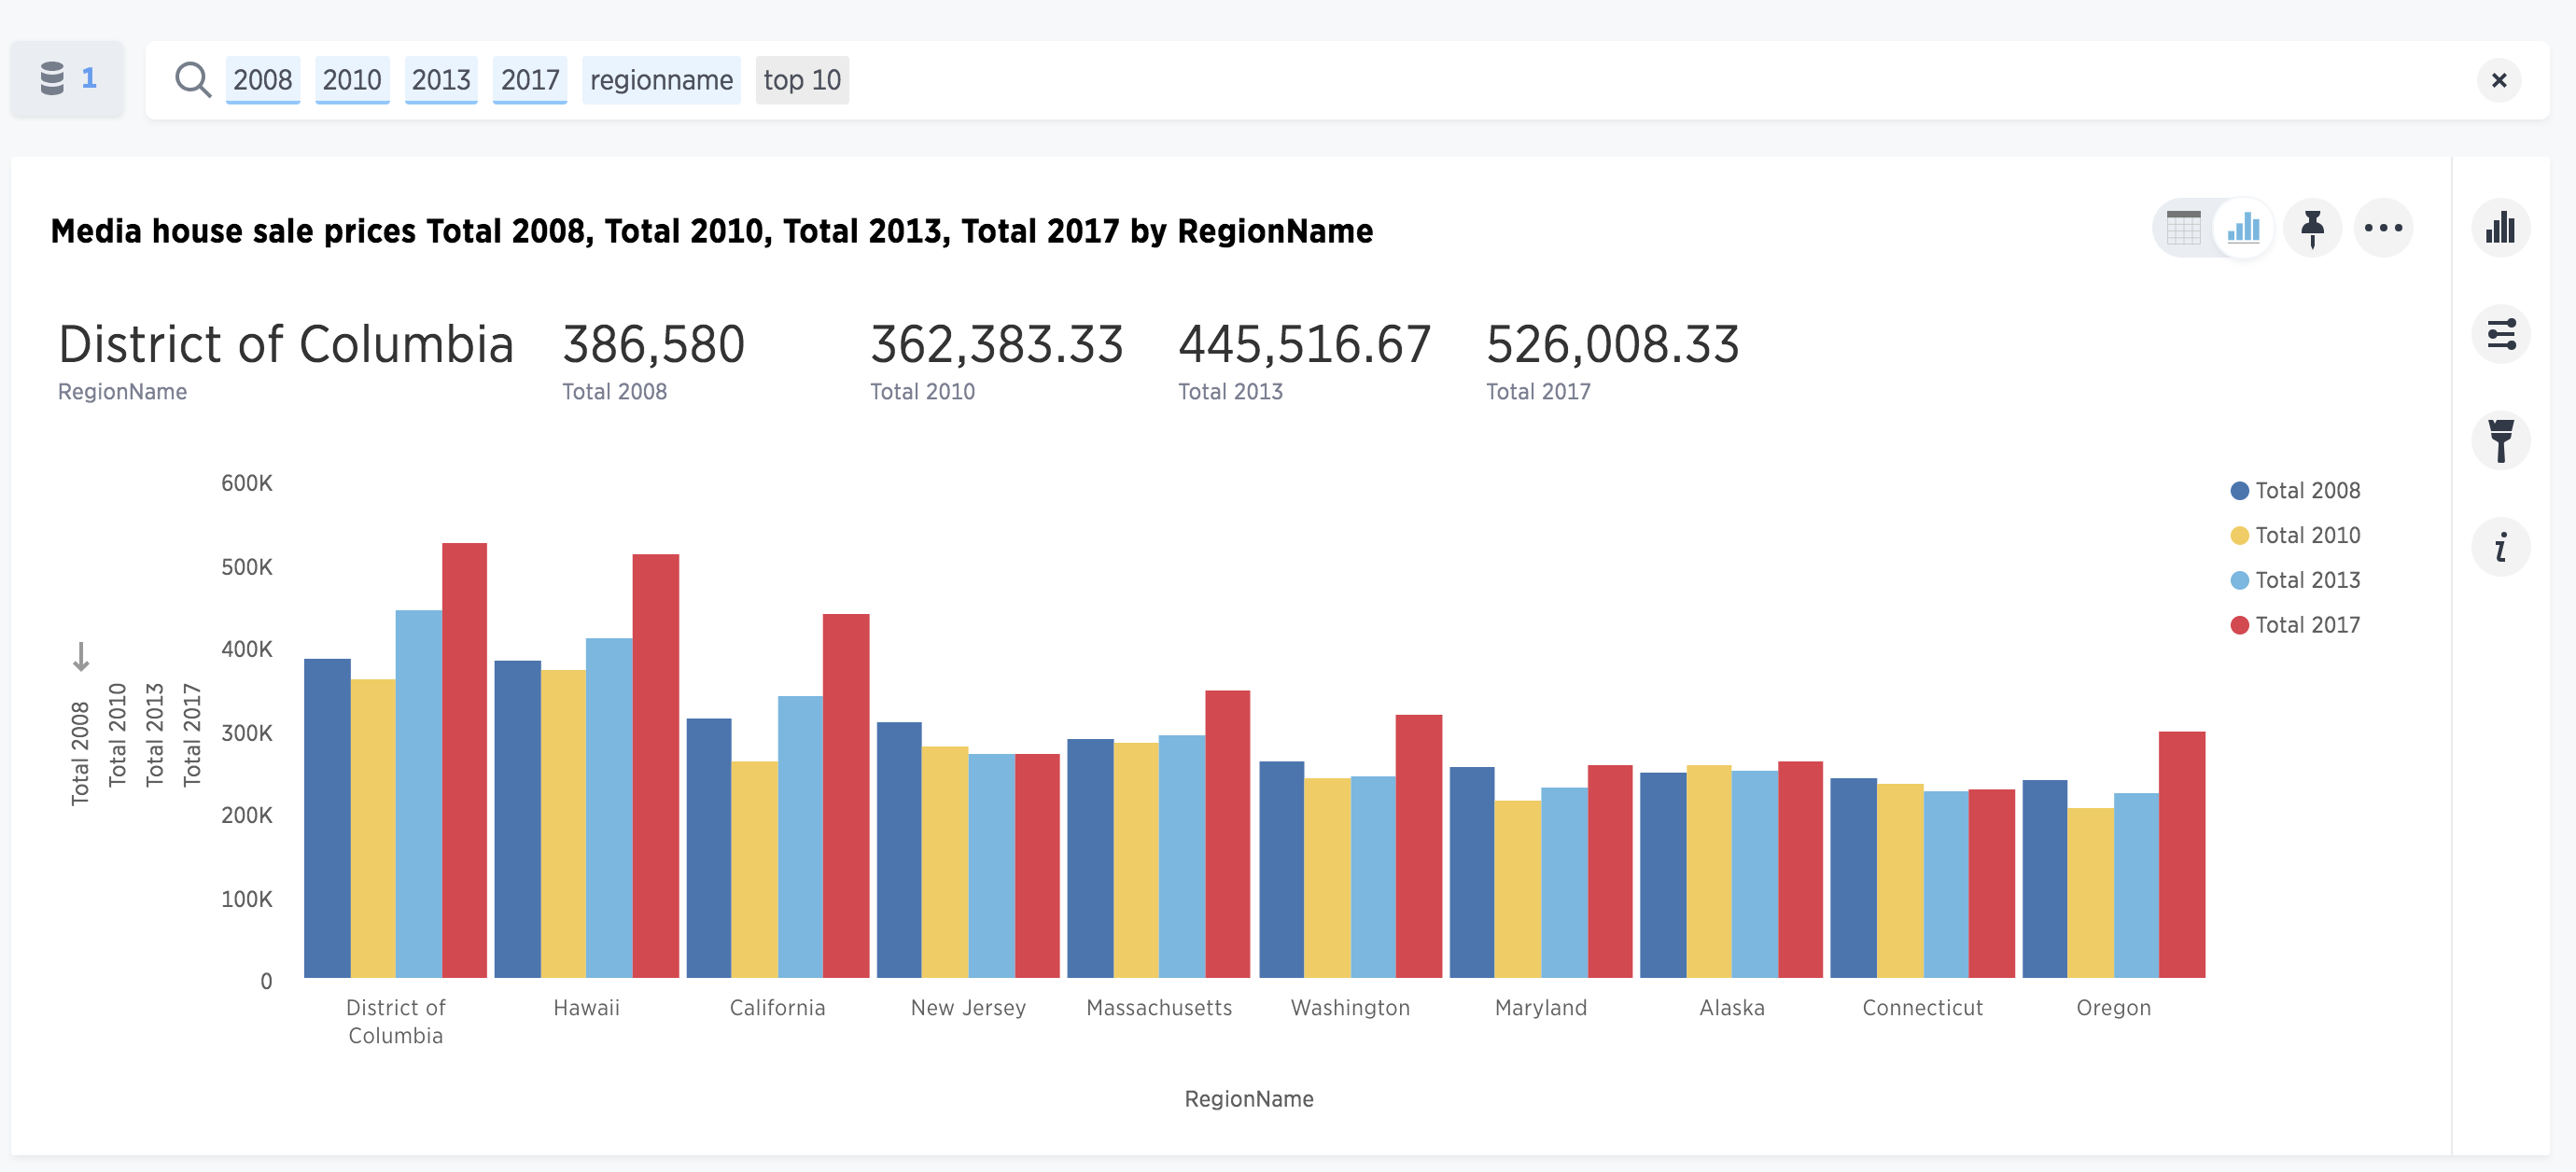
Much of the discussion around homelessness in the Bay Area has been interlinked with conversations around the soaring cost of housing. I wanted to see how housing prices relate to homelessness in the states with the most expensive homes. I downloaded the median sales prices from Zillow, quickly uploaded to ThoughtSpot, and began searching.
Data source: https://www.zillow.com/research/data/
While there was a universal dip in house prices following the 2008 financial crisis, house prices have been aggressively on the rise since 2010. Many of the states with the most expensive home prices also have some of the highest rates of homelessness. With one search, I found a correlation!
No Single Cause
While creeping housing price and a lack of affordable housing is one the leading cause of homelessness, it’s not the only one. Unemployment, poverty and low income also contribute to the issue. According to the National Alliance to End Homelessness, a nonpartisan organization to end homelessness in the US, women escaping domestic violence face a particular threat of homelessness. Additionally, acute physical and mental health problems or a long term disability can also lead to eventual homelessness.
Impact of the Shutdown
A month into the shutdown, the continued closure of the government is poised to affect the most vulnerable sections of society. The Department of Housing and Urban Development has already been hit by the shutdown. Federal government subsidies for rent are being cut-off. New HUD grant programs have not been announced and housing assistance contracts could expire if the shutdown extends into February.
How You Can Help
While the overall decade-long trend seems to be going in the right direction, we’re by no means anywhere near ending homelessness. There are plenty of ways each of us can contribute to reducing the debilitating effects of homelessness in our communities, such as:
Donate clothes, blankets, books, toys, homeless goods and anything you are not using to a homeless shelter or a homeless individual directly.
Volunteer at a local shelter by serving or cooking meals, washing dishes, or building homes through charities like Habitat for Humanity
Teach at a local shelter, helping people build new skills such as accounting, child care, administrative work, etc.
Advocate for legislation to help the homeless. Organize food drives or participate in fundraising campaigns.


