By 2025, the International Data Corporation (IDC) predicts the Global Datasphere will reach 175 zettabytes. This exponential growth in data production is driven by a variety of innovations, including digitization, widespread adoption, and the integration of LLMs and AI, among other contributing factors.
As the digital universe expands, the need to harness and find value in this vast volume of data becomes more prevalent. This is where data analytics emerges as a transformative force.
Through data analytics, you are empowered to turn otherwise siloed, binary data into actionable intelligence—a benefit to nearly any industry or humanitarian cause. What, then, is the essence of data analytics, and how does it shape our understanding of the world around us?
Table of contents:
Data analytics is the art and science of examining raw data to extract actionable insights and make informed decisions. Using various techniques and technologies, you can uncover patterns, correlations, and trends within datasets. Data-driven organizations leverage data and analytics to guide their decision-making and overall strategy. According to McKinsey Global Institute, data-driven organizations are 23 times more likely to acquire customers, 6 times as likely to retain customers, and 19 times as likely to be profitable.
Data analytics is often confused with data analysis. While these terms are related, they aren’t exactly the same. Data analysis is a subcategory of data analytics that specifically deals with extracting meaning from data. Data analytics, as a whole, includes processes beyond analysis, including data science and data engineering.
Data analytics offers a wide range of benefits across various industries and sectors. Here are some key advantages:
Informed decision-making: By analyzing data, you can make strategic decisions based on evidence and insights rather than relying solely on intuition.
Optimize your operational efficiency: Data analytics helps you identify inefficiencies and bottlenecks in your processes. This allows you to optimize your operations for increased efficiency and cost savings.
Enhance customer satisfaction: Analyzing customer data enables you to understand customer needs and preferences better. This information can be used to tailor your products and services, leading to improved customer satisfaction and loyalty. It also helps to reduce customer churn.
Gain a competitive advantage: By effectively leveraging data analytics, you gain a distinctive advantage by identifying trends, opportunities, and potential risks in your industry.
Manage risks: Use data analytics to assess and mitigate risks by identifying potential issues and predicting future trends. This is particularly important in industries such as finance and insurance.
Drive innovation and product development: Analyze market trends and customer feedback to guide the development of new products and services. By doing so, you can meet the needs of your target audience and have a higher chance of success.
Reduce costs: Through data analytics, identify areas where costs can be reduced without compromising efficiency. This can lead to significant savings in your operational expenses.
Maximize your marketing effectiveness: Use data analytics to target specific audience segments more effectively, personalize marketing messages, and measure the success of your campaigns.
Data analytics is not a one-size-fits-all approach. There are four main types of data analytics, each serving a distinct purpose:
1. Descriptive data analytics
Descriptive analytics is a type of data analytics that focuses on summarizing and presenting historical data to provide a clear understanding of what has happened in the past. It aims to answer the question, "What happened?" It involves meaningful organization and summarization of data.
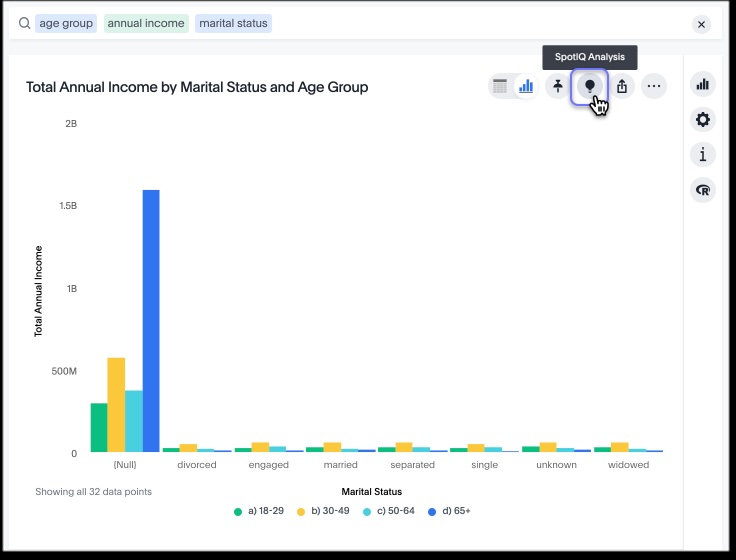
Key characteristics of descriptive analytics include:
Data summarization: In data summarization, descriptive analytics involves condensing extensive datasets to present a concise representation. This involves employing measures such as mean, median, mode, range, and other statistical summaries.
Data visualization: Types of graphs, charts, and other visual representations are used to present data in a way that is easy to understand. Data visualizations help you identify patterns and trends more quickly than raw data.
Key performance indicators (KPIs): Descriptive analytics often relies on the use of key performance indicators to assess the performance of a business or specific processes. KPIs are metrics that are crucial for understanding the success or challenges within an organization.
Historical perspective: This type of analytics is focused on understanding historical data and events. It provides a baseline for further analysis and helps to identify areas that may require further investigation.
2. Diagnostic data analytics
Diagnostic data analytics is an advanced data exploration technique that focuses on understanding the causes and factors behind past events or outcomes. It aims to answer the question, "Why did this happen?" by drilling down into historical data to identify patterns, anomalies, and relationships that can provide insights into the root causes of specific outcomes.
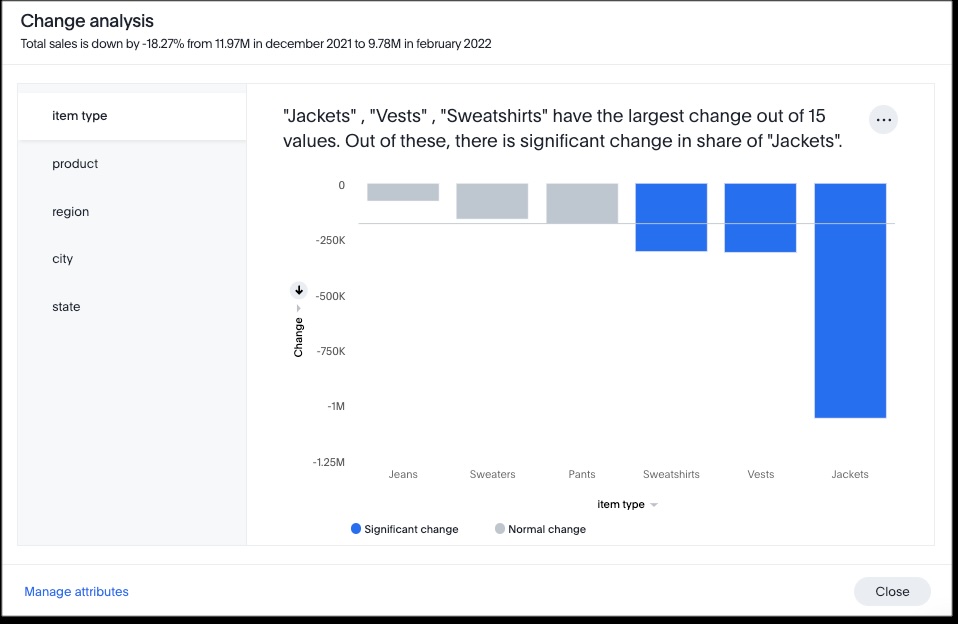
Key characteristics of diagnostic analytics include:
Root cause analysis: Diagnostic analytics involves a thorough investigation to identify the underlying reasons or factors contributing to a particular outcome. It goes beyond describing what happened and delves into understanding the "why."
Correlation and causation: This type of analytics explores correlations between variables and seeks to establish causation. It helps in determining whether certain factors directly influence or contribute to specific outcomes.
Comparative analysis: Diagnostic analytics often involves comparing different datasets or segments to identify variations and trends. This comparative analysis helps isolate key factors that may have influenced the observed outcomes.
Hypothesis testing: Analytical techniques, like hypothesis testing, are commonly used in diagnostic analytics to validate assumptions and test potential explanations for observed phenomena.
3. Predictive data analytics
Predictive data analytics is the next type of data analytics that focuses on forecasting future trends and outcomes based on historical data and statistical algorithms. It aims to answer the question, "What might happen in the future?" By building large language models that can make predictions or estimations about future events or behaviors, you can identify patterns and relationships within the data.
Key characteristics of predictive analytics include:
Statistical models: Predictive analytics relies on the use of statistical models and machine learning algorithms to identify patterns and trends in historical data. These models are then used to make predictions about future events.
Data mining: Various data mining techniques are used to explore and extract valuable patterns from large datasets. This involves discovering hidden relationships and trends that may not be apparent through traditional analysis.
Probability and likelihood: Predictive analytics provides insights into the likelihood of future events occurring. It assigns probabilities to different outcomes, helping you to assess and prepare for potential scenarios.
Forecasting: This type of analytics is often associated with forecasting future trends or behaviors. Whether it's predicting sales, customer behavior, or equipment failures, predictive analytics helps you to anticipate and plan for the future.
4. Prescriptive data analytics
Prescriptive data analytics is a more advanced analytics that refers to the stage in data analytics that focuses on providing actionable recommendations for decision-making to achieve specific objectives. It answers the question, "What should you do next?" This type of analytics goes beyond descriptive, diagnostic, and predictive analytics by not only identifying potential future outcomes but also suggesting the most effective actions to optimize those outcomes.
Key characteristics of prescriptive analytics include:
Optimization: Prescriptive analytics aims to optimize decision-making by recommending the most beneficial actions based on the analysis of historical data and predicted future scenarios.
Decision support: It provides you with insights into the potential impact of different actions, helping you make choices that align with your organizational goals.
Machine learning and algorithms: Advanced machine learning algorithms and optimization techniques are often employed in prescriptive analytics to analyze data and generate recommendations.
Scenario analysis: Prescriptive analytics considers various scenarios and evaluates the consequences of different actions. This helps you to understand the potential outcomes of each decision before making a choice.
Real-time decision-making: In some cases, prescriptive analytics is used in real-time settings to provide immediate recommendations, enabling timely and effective responses to changing conditions.
Root cause analysis
Root cause analysis (RCA) is a method used to identify and address the primary cause of a problem or issue. In data analytics, RCA is applied to investigate and understand the underlying factors contributing to a particular outcome or event. By identifying the root cause, you can develop effective solutions to prevent the recurrence of issues.
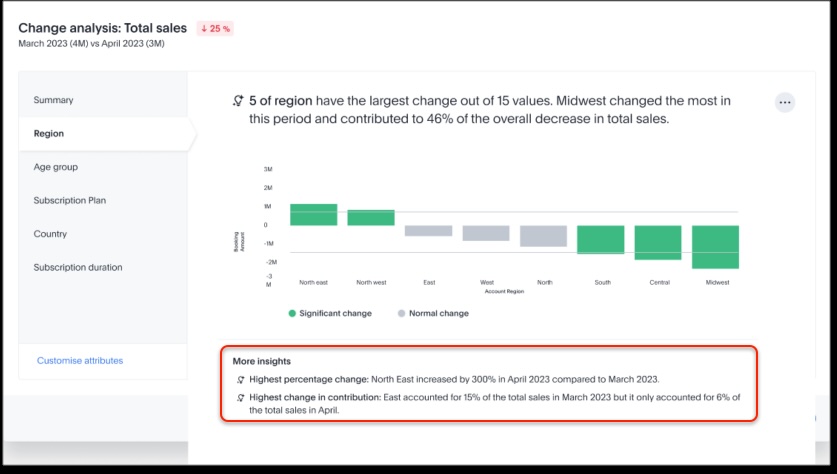
Outlier analysis
Outlier analysis involves the identification and examination of data points that deviate significantly from the rest of the dataset. Outliers can provide valuable insights into unusual patterns, errors, or anomalies in the data. Analyzing outliers is essential for understanding the data distribution and ensuring the quality and reliability of the dataset.
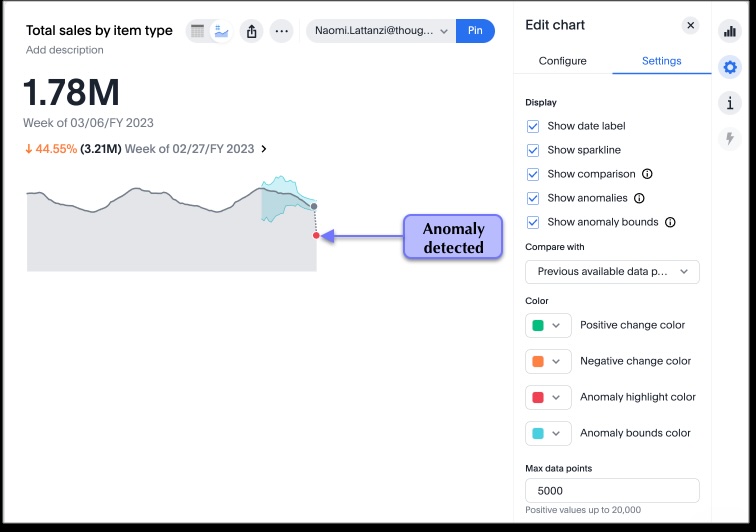
Cohort analysis
Cohort analysis involves the grouping of individuals based on shared characteristics or experiences, and then analyzing their behavior or performance over time. This technique is commonly used in marketing and customer analytics to study how different cohorts of users or customers evolve and interact with a product or service. It helps you understand the impact of changes or interventions on specific groups.
Financial services
In the services sector, financial data analytics is instrumental in areas such as fraud detection. Analyzing transaction data allows organizations to identify unusual patterns or behaviors indicative of fraudulent activity. Additionally, credit risk assessment leverages historical data and predictive analytics to evaluate the creditworthiness of individuals or businesses. Portfolio management benefits from data analytics by optimizing investment portfolios, identifying trends, and making informed investment decisions.
Marketing
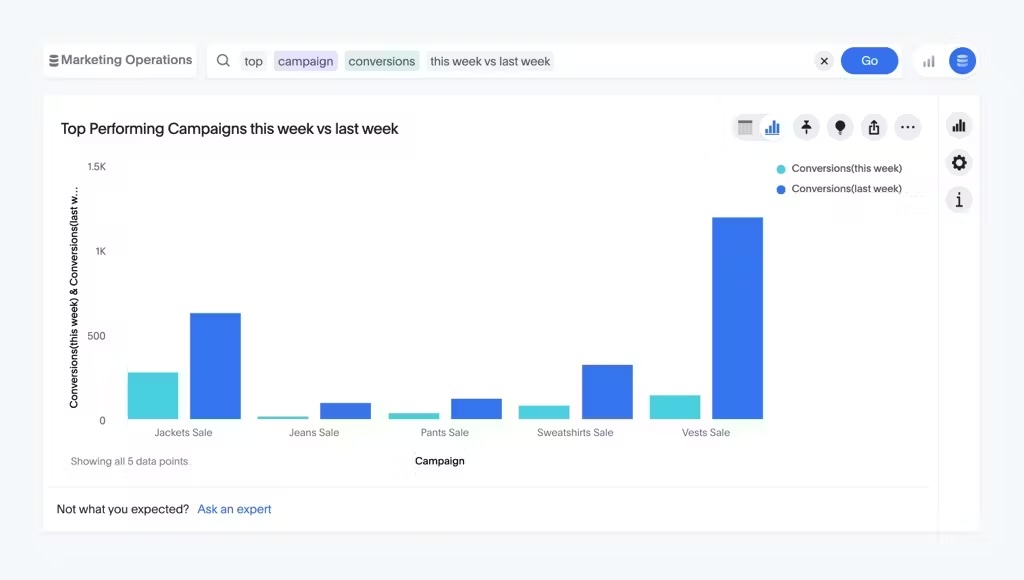
Customer segmentation is a common application of marketing analytics. Analyzing customer data enables the categorization and grouping of customers based on common characteristics, facilitating targeted marketing campaigns. Assessing the effectiveness of online campaigns is another area where marketing analytics tools prove invaluable. This involves evaluating customer engagement, conversion rates, and return on investment. Social media analytics is also employed to monitor platforms, understand customer sentiments, and assess the impact of marketing efforts.
Sales
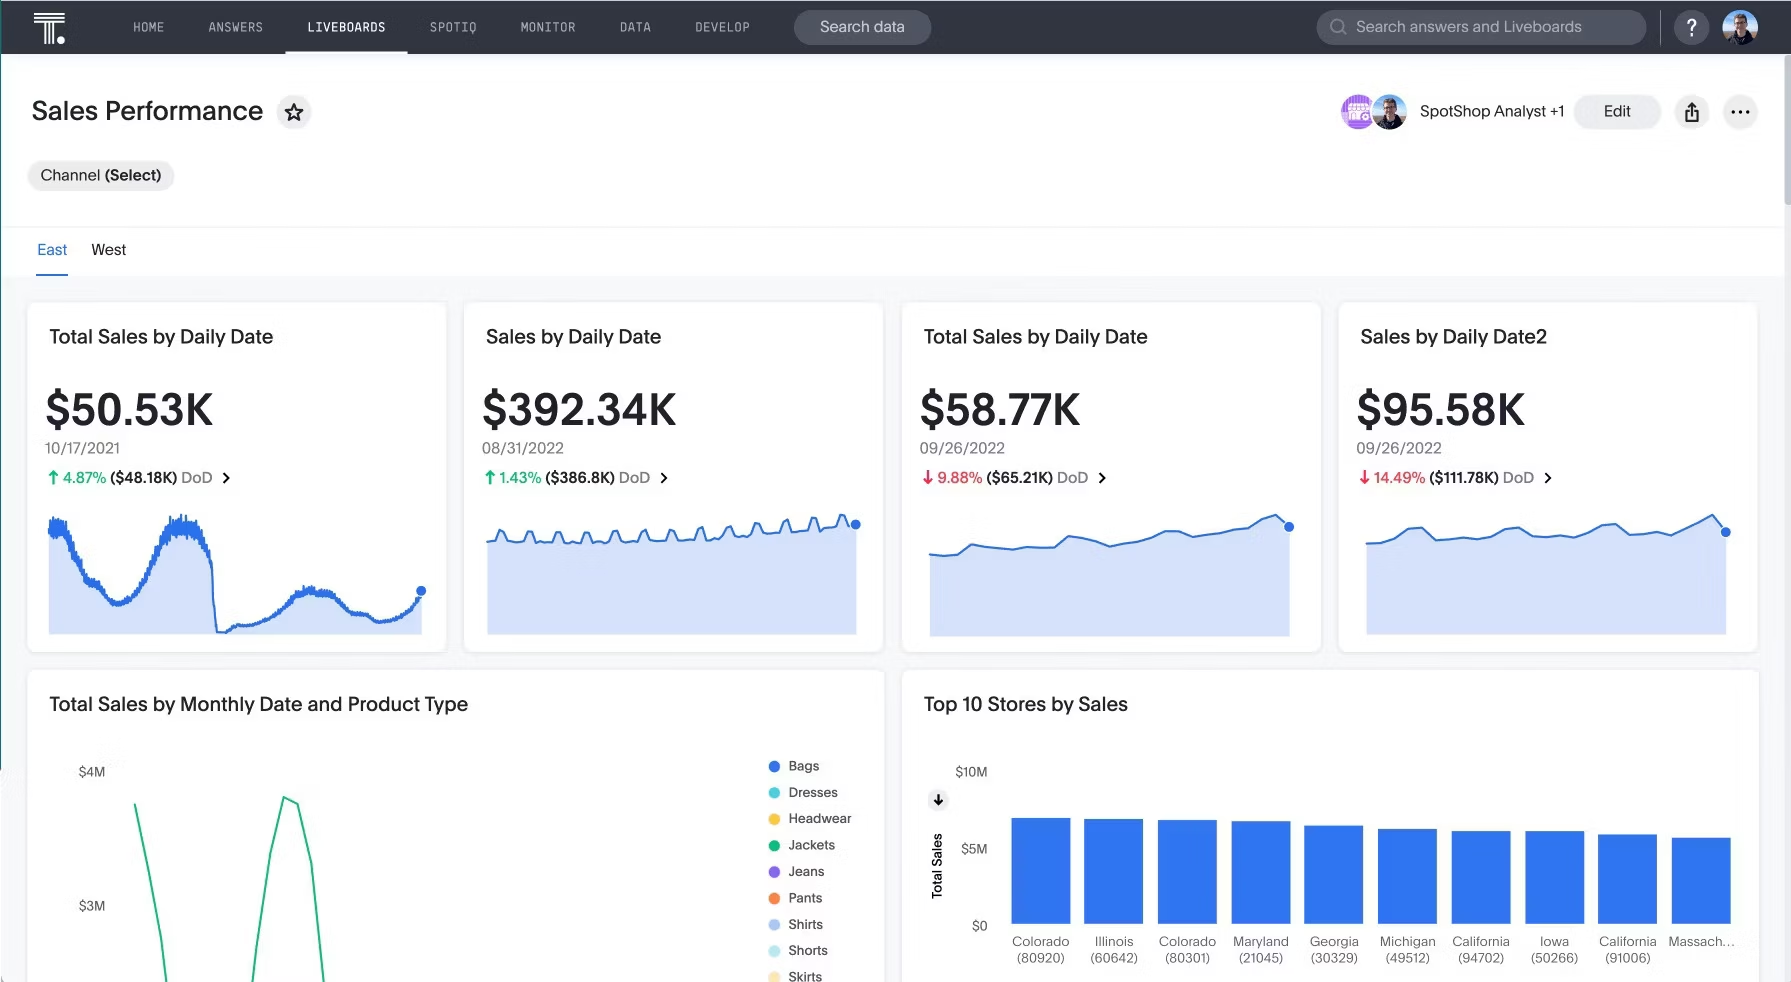
Sales operations benefit from data analytics through various applications. Sales forecasting, for instance, utilizes historical sales data and market trends to predict future sales, aiding in resource planning. Customer Lifetime Value (CLV) analysis calculates the expected revenue from a customer over the entire relationship, informing customer acquisition and retention strategies. Sales performance analytics evaluates the performance of sales teams, identifying top-performing individuals or regions and optimizing sales strategies accordingly.
Healthcare
Healthcare data analytics plays a crucial role in predicting patient outcomes. By analyzing patient data, healthcare providers can predict potential health obstacles for patient populations. This helps in providing proactive and personalized healthcare that delivers better patient outcomes. Operational efficiency in healthcare is also improved through data analytics, optimizing hospital operations by analyzing patient flow, resource utilization, and staff performance.
E-commerce
E-commerce businesses leverage data analytics in various ways. Recommendation systems analyze customer browsing and purchase history to provide personalized product recommendations, enhancing the overall shopping experience. Supply chain optimization is another critical application, streamlining inventory management, reducing shipping costs, and improving overall supply chain efficiency.
According to Allied Market Research, the global big data and business analytics market was valued at $225.3 billion in 2023 and is projected to reach $665.7 billion by 2033. This exponential growth underscores the pivotal role that data analytics is playing in shaping the future of industries worldwide. Let's delve into the key trends shaping the future of data analytics and how they are poised to revolutionize the way businesses derive value from their data.
Artificial intelligence and machine learning
As we move forward, the integration of Artificial Intelligence (AI) and Machine Learning (ML) is set to play a key role in the evolution of data analytics. Increasingly sophisticated AI algorithms, fueled by advanced ML models, will empower organizations to gain deeper insights, improve predictive analytics, and automate decision-making processes. This trend signifies a shift towards more intelligent and adaptive data analysis, enabling businesses to extract meaningful patterns from complex datasets.
Advanced data visualization
The demand for advanced data visualization tools is expected to rise. As data becomes more intricate, businesses will need innovative ways to interpret and communicate complex insights. Advanced data visualization techniques, including multi-modal data visualization and interactive dashboards, will become integral for presenting data in a visually compelling and easily understandable manner.
Real-time analytics
Real-time analytics is ready to become a standard requirement for businesses seeking to gain a strategic advantage. The ability to analyze data as it is generated, rather than relying on historical information will allow organizations to make immediate decisions. This trend is particularly crucial in dynamic industries where rapid response to changing conditions is essential, such as finance, e-commerce, and supply chain management.
Data analytics involves the use of various tools to analyze and interpret data, gain insights, and make informed decisions. Here are some of the popular data analytics tools:
1. ThoughtSpot
No shame in this selfless plug–ThoughtSpot is first on our list, and for good reason.
Our business intelligence platform empowers all users to visualize and analyze data using natural language search. Leveraging advanced language models such as GPT and Google PaLM, ThoughtSpot enables self-service analytics at an enterprise scale. With just a few clicks, you can easily integrate ThoughtSpot into your existing data pipeline and generate real-time, interactive Liveboards. Liveboards help you create and share data stories, apply drill-downs and filters to explore specific data points. Using augmented analytics, ThoughtSpot also auto-analyzes your data and alerts users to identified patterns and trends. Additionally, you have granular control over data security with a centralized governance system that improves transparency and prevents unauthorized access. ThoughtSpot even allows you to embed data analytics into your product with ThoughtSpot Everywhere.
Don’t just take our word for it—consider Wellthy. Earlier, the company’s customers used legacy business intelligence tools that required SQL and Python input. However, their data team, already occupied with ad-hoc requests, struggled to execute extensive data projects. With the introduction of ThoughtSpot, Wellthy's data team gained the freedom to ask queries and explore data without constraints. This helped the company save over $200k by increasing analyst efficiency and even enabling front-line business users to find their own insights.
See how ThoughtSpot can help you analyze data seamlessly—Get a free demo.
2. Mode
Mode Analytics is a platform that allows you to perform SQL-based analysis. With its user-friendly Notebook interface and Visual Explorer, you can seamlessly connect to your database, execute queries, and transform raw data into interactive visualizations for quicker ad-hoc analysis. Mode provides Notebooks for SQL, Python, and R, empowering data teams to manipulate and analyze data according to their preferences. Additionally, their visualization library is equipped with advanced analytics features, enabling business users to delve into data and derive instant insights.
Honeycomb grappled with analyzing vast datasets due to fragmented data sources and manual product data queries using Metabase. In a bid to enhance decision-making and stay agile, they transitioned to Mode. That’s why Mode is considered one of the best Metabase alternatives.
Mode consolidated all of Honeycomb's data sources, enabling seamless querying and insightful answers about product usage. The team utilized Mode's Notebook environment for slicing data and creating Python-based visualizations. This combination of SQL for querying and joining data, coupled with Python for exploration and visualization, proved instrumental for Honeycomb in deciphering customer behavior and refining their product strategy.
Try Mode today and revolutionize your data analytics!
3. Tableau
Tableau is a legacy business intelligence and analytics tool launched in 2003 and then acquired by Salesforce in 2019. Known for its advanced analytical capabilities, Tableau allows analysts to prep data and organize it for visualization with a drag-and-drop interface. However, for business users, the learning curve might be a bit steeper. The company also has AI tools that help users in data preparation and analysis.
Relevant read: Tableau alternatives to look out for
4. Looker
Looker is Google’s data exploration tool. It allows users to connect data from diverse sources, using the capabilities of AI and ML technologies for exploration. Looker offers an SQL interface for data modeling, dashboard creation, and real-time monitoring of essential KPIs. The platform also provides users with access to its semantic layer, LookerML, facilitating ad-hoc queries and robust data governance.
Choosing the right tool for your business involves considering various factors:
Define your business goals: Clearly outline your business objectives and goals. Identify the specific problems you want to solve or the insights you want to gain through data analytics.
Understand your data needs: Analyze the type and volume of data your business generates and uses. Consider the variety, velocity, and complexity of your data to determine the tools that can handle your specific requirements.
Evaluate user skill level: Assess the technical expertise of your team members who will be using the analytics tool. Some tools are more user-friendly and require less technical knowledge, while others may be more suitable for advanced users. Ask yourself if there is one tool that works for both user skillsets?
Scalability: Consider the scalability of the analytics tool. Will it be able to handle growing data volumes and increased complexity as your business expands? Is there a chance you’ll be looking for embedded analytics capabilities in the future?
Integration with existing systems: Check if the analytics tool can seamlessly integrate with your existing software and systems. Compatibility with databases, semantic layers, CRMs, and other essential tools is crucial for a smooth workflow.
Cost considerations: Evaluate the total cost of ownership, including licensing, training, support, and any additional infrastructure requirements. Consider both upfront and ongoing costs to determine the long-term viability of the tool, and analyze the potential return on investment (ROI) to ensure a comprehensive understanding of the financial implications.
Data security and compliance: Ensure that the analytics tool adheres to data security standards and compliance regulations relevant to your industry. Data privacy is critical, especially when dealing with sensitive information.
User feedback and reviews: User feedback and reviews are crucial aspects of evaluating a tool's effectiveness. This can provide valuable insights into the practical aspects of using the tool. Beyond that, consider the strength and engagement of the tool's community. An active community can provide additional layers of support, shared knowledge, and troubleshooting solutions.
Transforming insights into action
The importance of data analytics in today's business environment is undeniable. The right tools play a pivotal role in unlocking the true potential of data. ThoughtSpot offers more than a solution; it's an opportunity to revolutionize the way your entire organization interacts with data and gain a competitive edge in the dynamic business landscape.
Schedule a live demo, and unleash the true potential of your data!


